Influence of crystallographic orientation on dry etch properties of TiN D. Dictusa兲 Department of Chemistry, University of Leuven, Leuven 3001, Belgium and IMEC, Kapeldreef 75, Leuven 3001, Belgium
D. Shamiryan, V. Paraschiv, and W. Boullart IMEC, Kapeldreef 75, Leuven 3001, Belgium
S. De Gendt Department of Chemistry, University of Leuven, Leuven 3001, Belgium and IMEC, Kapeldreef 75, Leuven 3001, Belgium
S. Vanhaelemeersch IMEC, Kapeldreef 75, Leuven 3001, Belgium
共Received 10 March 2006; accepted 7 August 2006; published 28 September 2006兲 A study of the impact of physical vapor deposition conditions on the etch properties of TiN has been conducted using a transformer coupled plasma. This work focuses only on a Cl2-based etch plasma. It is shown that the crystallographic orientation of TiN, observed from x-ray diffraction spectra, has a major influence on the etch behavior. Etch yields at varying dry etch conditions of two types of TiN, with different crystallographic orientations, have been studied quantitatively. The high roughness which is created during plasma exposure was identified as being the result of different etch rates of grains and intergranular material at the grain boundaries. Moreover, it is shown that TiN共111兲 is more difficult to etch, resulting in more pronounced roughness, than TiN共200兲, which is easier to etch, resulting in smoother surfaces for certain process conditions. © 2006 American Vacuum Society. 关DOI: 10.1116/1.2348725兴
I. INTRODUCTION As microelectronic devices shrink to ever-smaller dimensions, there is a big challenge to find new materials coping with the demanded properties. For transistors, some metal nitrides are currently under investigation to replace polycrystalline silicon as a gate electrode in order to overcome the poly depletion and carrier mobility decrease. These materials have already been investigated thoroughly in the past because they are used for back-endof-line applications. Being able to apply them as well for front-end-of-line applications would result in good cost effectiveness because of the availability in the production line and the presence of material characterization studies on this subject. The metal nitride which is focused on in the present study is TiN. It has already been used in microelectronic processing for quite some time as an antireflective coating for Al-based metallization 共back end of line兲 and more recently, as a diffusion barrier for Cu-based metallization. However, only a limited amount of data is available when processing this material in front end of line for sub-65-nm devices. It has been suggested previously that the differences in dry etching of metal nitrides are mainly related to the volatility of the etch products and the binding energies of the alloyed elements 共TiN: 476 kJ/ mol, TaN: 611 kJ/ mol兲.1,2 In this paper, we show that the crystallographic orientation of TiN plays a key role for its etch properties. a兲
Electronic mail:
[email protected]
2472
J. Vac. Sci. Technol. B 24„5…, Sep/Oct 2006
A similar influence of crystallographic orientation on etch behavior is known for polycrystalline silicon etched in Clbased plasmas.3 There, it is shown that the 共100兲 planes etch at a much higher rate than the 共111兲 planes. In this paper, we report the impact of two different physical-vapor-deposition 共PVD兲 conditions on the etch behavior of TiN. First, conventional PVD TiN, that is used for depositing antireflective coating 共will be referred to as ARC兲, and secondly, a more advanced ionized metal plasma 共IMP兲 PVD TiN will be considered. Only the Cl2-based etching chemistries are reported in this study. Crystalline TiN consists typically of columns that stretch from the bottom to the top of the layer, perpendicular to the wafer surface. These types of layers have been seen for a large range of metals.4 Each column can exist as a single TiN crystal. These TiN crystals are known to consist of a rocksalt 共NaCl兲 cubic lattice in a wide composition range 共0.6 ⬍ N / Ti⬍ 1.16兲.5 In fact, the titanium atoms form a fcc lattice. Nitrogen puts itself on the octahedral places as it is added, forming a simple cubic structure. It has been proven by many researchers that by changing deposition conditions such as radio-frequency power, bias, gas flows, etc., the main crystallographic orientation of the fcc lattice can be varied. This can result in 兵200其, 兵220其, or 兵111其 planes lying parallel to the surface. A summary of the conditions and mechanisms is given in the work of Rausenbach and Gerlach.6 Tanaka et al.7 show that it is also possible for IMP PVD TiN to shift from one orientation to another by changing the
1071-1023/2006/24„5…/2472/5/$23.00
©2006 American Vacuum Society
2472
2473
Dictus et al.: Influence of crystallographic orientation on dry etch properties
2473
TABLE I. Deposition parameters of IMP and ARC TiN. TiN
Substrate temperature 共°C兲
Substrate bias 共V兲
IMP ARC
350 23
−221 0
bias voltage and rf power during deposition. They used a deposition tool similar to that used for the TiN deposition in the present study. II. EXPERIMENT Two types of TiN 共ARC and IMP, deposited under different conditions兲 were used in this study. Deposition was done in an Applied Materials Endura multichamber cluster tool with ARC in the standard Ti/ TiN PVD chamber and IMP in the Ti/ TiN IMP PVD chamber. The main differences between ARC and IMP deposition techniques are the substrate temperature and power settings, as summarized in Table I. The TiN is always deposited on a SiO2 layer. All dry etch processes were carried out in a Lam Research Versys 2300 etch chamber on 200 mm wafers. This particular etch reactor uses a transformer coupled plasma 共TCP™兲 that allows plasma power and substrate bias 共or the bottom electrode power兲 to be controlled separately. The experiments were carried out at 450 W source power, pressure of 5 mTorr, temperature of 60 ° C, and gas-flow rate of 100 sccm Cl2 共sccm denotes standard cubic centimeter per minute at STP兲. Substrate bias was varied between 0 and 600 V. All the wafers were cross sectioned and inspected by scanning electron microscopy 共SEM兲. Etch rates were measured by subtracting the layer thickness before and after etching 共as measured on a cross sectioned wafer using SEM兲 and dividing by the etch time. Considering the measurement error of SEM and the variations in layer thickness over the whole wafer, the total error is estimated as being within + / −10 nm/ min. Multiple experiments of some selected data points have proven this to be valid. Besides SEM, the chemical composition of the samples was analyzed by Rutherford backscattering 共RBS兲 and x-ray photoelectron spectroscopy 共XPS兲. The crystallographic composition was studied using x-ray diffraction 共XRD兲.
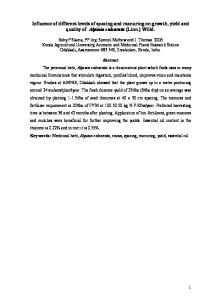
FIG. 1. XRD spectrum of ARC TiN 共deposition process without applying substrate bias兲.
It should be stressed here that all experiments in this study were conducted on thick 共+ / −200 nm兲 layers. In the case of thin 共10 nm兲 TiN layers, as shown in Figs. 3共a兲 and 3共b兲, the XRD spectra show only a small difference in preferential grain orientation between ARC and IMP TiN. This is consistent with the theory of Pelleg et al.8 and Oh and Je,9 where it is shown that for thicker 具200典 films, the compressive stress in the film causes a large strain energy, which induces the 具111典 direction to lie normal to the plane. In Figs. 3共a兲 and 3共b兲 it can also be observed that the crystallographic orientation does not change with temperature. The same observation was made for thick 共200 nm兲 films 共spectra not shown兲, which is consistent with the previous experiments of Yokota et al.10 When exposing the TiN layer to a Cl2-based etch plasma, the columnar structure of the material, as was described in the Introduction, becomes very apparent 关Figs. 4共a兲 and 4共b兲兴. It is clear that etching TiN with Cl2 results in very rough layers. The high roughness was considered as originating from the differences in the etch rate between the grains and the intergranular material at the grain boundaries 共Fig. 5兲.
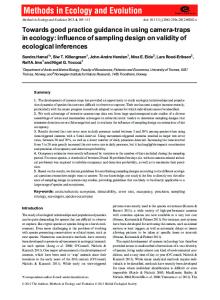
III. RESULTS AND DISCUSSION The preferred crystallographic orientations of the two types of TiN layers, 200 nm thick, which are the subject of this study, are shown in the XRD spectra of Figs. 1 and 2. Table II gives an overview of the different planes and the two-theta diffraction angles for TiN. The main orientation of the cubic TiN lattice is 兵111其 for ARC and 兵200其 for IMP. Accordingly, with these data, ARC TiN can be considered to exist as a bilayer structure with either nitrogen or titanium in each parallel atomic layer. The IMP 共200兲 TiN, on the other hand, has identical atomic layers, with each layer having an equal amount of titanium and nitrogen. JVST B - Microelectronics and Nanometer Structures
FIG. 2. XRD spectrum of IMP TiN 共deposition process with −221 V pedestal bias兲.
2474
Dictus et al.: Influence of crystallographic orientation on dry etch properties
2474
TABLE II. Diffraction angles and related planes for cubic TiN. 2
Lattice plane of TiN
36.66 42.60 61.81 74.07 77.96
共111兲 共200兲 共220兲 共311兲 共222兲
Experiments at different etch times show that the etch rate of the grains and the etch rates of the intergranular material can be measured independently using SEM and that these etch rates are constant in time. Table III gives the etch rates of experiments with varying etch times for ARC and IMP TiN. The results presented in Table III show that for these process conditions, the etch rates of the grains and intergranular material of the IMP TiN are both 70 nm/ min higher than those of the ARC TiN. It can also be observed that the difference in the etch rate between grains and intergranular material is in both cases 140 nm/ min, which indicates that even if the structure is different, there is still a correlation between grains and intergranular material. This is also consistent with previous research which states that this intergranular material consists essentially of low-angle dislocation networks similar to the structure of the grains.11 Typically, the intergranular material also has a higher concentration of impurities. These two facts indicate why this intergranular material shows a higher etch rate than the grains. It must be stressed at this point that the RBS and XPS measurements show that the density and stoichiometry of
FIG. 3. 共a兲 XRD 共grazing incidence兲 spectrum of IMP TiN 共10 nm兲 at temperature range between 300 and 800 ° C. 共b兲 XRD 共grazing incidence兲 spectrum of ARC TiN 共10 nm兲 at temperature range between 300 and 800 ° C. The large peak in all spectra is due to silicon. J. Vac. Sci. Technol. B, Vol. 24, No. 5, Sep/Oct 2006
FIG. 4. 共a兲 Rough TiN surface after etching in a Cl2 plasma. Power: 450 W, bias: 55 V, pressure: 5 mTorr, and flow: 100 sccm Cl2. SEM picture of a tilted wafer. 共b兲 Rough TiN surface after etching in a Cl2 plasma. Power: 450 W, bias: 55 V, pressure: 5 mTorr, and flow: 100 sccm Cl2. SEM picture of a cross sectioned wafer.
both ARC and IMP TiN are about the same. The only difference between the two types of TiN is the crystallographic orientation. XRD experiments after etching were conducted to verify whether the intergranular material did, indeed, not consist of any major crystallographic structure and orientation. The results are given in Figs. 6 and 7. The major 共111兲 and 共200兲 peaks for ARC and IMP TiN, respectively, decreased in intensity because part of the grains were etched, and the smaller 共220兲 peak is still present with the same intensity. This clearly indicates that this 共220兲 peak cannot be due to the intergranular material and also that the peak will probably originate from the bottom part of the layer. It is suggested that this demonstrates again that the stress buildup in thicker layers causes a preferential orientation according to the theory of Pelleg et al. and that, therefore, the bottom part of a layer can consist of different crystallographic orientations as the bulk of the layer. One of the possibilities, presented here, to reduce the roughness after a Cl2-based etch process is to use a high substrate bias. Etch experiments at varying bias voltage show
2475
Dictus et al.: Influence of crystallographic orientation on dry etch properties
2475
FIG. 5. Roughness of TiN after etching in Cl2 plasma originates from differences in etch rate between grains and intergranular material. This can be measured independently using SEM.
TABLE III. Etch rates of grains and intergranular material for IMP and ARC TiN: experiments at etch times between 10 and 60 s, rf power: 450 W, bias: 55 V, and pressure: 5 mTorr.
FIG. 8. ARC TiN etched with 100 sccm Cl2, rf power of 450 W, bias of −180 V, and pressure of 5 mTorr.
Etch rate 共nm/min兲 Grains ARC TiN Intergranular ARC TiN Grains IMP TiN Intergranular IMP TiN
40 180 110 250
remarkable differences in the behavior of the two layers. Figures 8 and 9 show, respectively, ARC and IMP TiN etched in pure Cl2 at −180 V. It is clear that while the IMP sample shows a smooth surface, the ARC TiN sample is still very rough, as was indicated previously. Overviews of the experiments in a range between 0 and −600 V for ARC and IMP are shown in Figs. 10 and 11. Notice that the etch rates of grains and intergranular material are plotted separately. The etch rates are plotted as a function of the square root of the bias according to the theory of Steinbruchel,12 who showed that ion-induced etching should vary linearly with the square root of the bias voltage. For the sake of correctness, the trend lines of the grains for both ARC and IMP TiN are split up into two parts. We suggest that different mechanisms can occur in different bias ranges, but further research should be done to verify this.
FIG. 6. ARC TiN etched with 100 sccm Cl2, rf power of 450 W, bias of 55 V, and pressure of 5 mTorr.
FIG. 7. IMP TiN etched with 100 sccm Cl2, rf power of 450 W, bias of 55 V, and pressure of 5 mTorr. JVST B - Microelectronics and Nanometer Structures
FIG. 9. IMP TiN etched with 100 sccm Cl2, rf power of 450 W, bias of −180 V, and pressure of 5 mTorr.
2476
Dictus et al.: Influence of crystallographic orientation on dry etch properties
2476
All these experiments show again that the crystallographic orientation of the substrate is a major factor which has to be taken into account when developing dry etch processes for TiN.
FIG. 10. Etch rate as function of the square root of the bias for IMP TiN. Pressure: 5 mTorr; rf power: 450 W.
From Fig. 10, it is clear that the etch rates of grains and intergranular material are bias dependent. For IMP TiN at −180 V, the grains and the intergranular material are removed at the same rate. As a result, the etched TiN surface is very smooth 共Fig. 9兲. For ARC TiN 共Fig. 11兲, applying very high bias during the etch process will not result in a smooth surface for these process conditions because the grains and the intergranular material show the same bias dependence.
IV. CONCLUSIONS The structure of two types of PVD TiN, ARC and IMP, has been thoroughly investigated and the crystallographic orientation was identified as being a major parameter influencing the etch behavior of this material. It is already known that crystallographic orientation can have an influence on the etch properties of materials such as silicon, but in this work we show that this is also the case for PVD TiN etched with a Cl2 plasma. Based on the results obtained by screening different bias-voltage conditions, we conclude that the IMP TiN with 共200兲 orientation is much more dependent on ion bombardment than the ARC TiN with 共111兲 orientation. As a consequence, in the case of IMP TiN we could optimize the etch conditions in such a way that the TiN surface remains smooth during the etch process. For both layers, the grain-etch rate does not vary linearly with the bias, but can be split into two domains. ACKNOWLEDGMENTS The authors wish to thank Jan D’Haen for providing the XRD measurements, the staff of the IMEC pilot production line for providing the test material, and the staff of the Materials and Components Analysis 共MCA兲 group of IMEC for the XPS and RBS experiments on our materials. 1
FIG. 11. Etch rate as function of the square root of the bias for ARC TiN. Pressure: 5 mTorr; rf power: 450 W.
J. Vac. Sci. Technol. B, Vol. 24, No. 5, Sep/Oct 2006
W. S. Hwang, J. Chen, and W. J. Yoo, J. Vac. Sci. Technol. A 23, 964 共2005兲. 2 S. Deshmunk, J. Choi, M. Shen, Y. Du, K.-T. Lee, S. I. Yi, J. B. Yu, and T. Lill, Proceedings of SEMICON West 2003, San Francisco, CA, July 2003 共unpublished兲. 3 E. A. Ogryzlo, D. E. Ibbotson, D. L. Flamm, and J. A. Mucha, J. Appl. Phys. 67, 3115 共1989兲. 4 J. A. Thornton, J. Vac. Sci. Technol. 11, 666 共1974兲. 5 L. E. Toth, in Transition Metal Carbides and Nitrides 共Academic, New York, 1971兲, p. 118. 6 B. Rauschenbach and J. W. Gerlach, Cryst. Res. Technol. 35, 675 共2000兲. 7 Y. Tanaka, E. Kim, J. Foster, and Z. Xu, J. Vac. Sci. Technol. B 17, 416 共1999兲. 8 J. Pelleg, L. Z. Zevin, S. Lungo, and N. Croittoru, Thin Solid Films 197, 117 共1991兲. 9 U. C. Oh and J. H. Je, J. Appl. Phys. 74, 1692 共1993兲. 10 K. Yokota, K. Nakamura, T. Kasuya, K. Mukai, and M. Ohnishi, J. Phys. D 37, 1095 共2004兲. 11 H. Wise and J. Oudar, in Material Concepts in Surface Reactivity and Catalysis 共Academic, San Diego, 1990兲, p. 162. 12 C. Steinbruchel, Appl. Phys. Lett. 55, 1960 共1989兲.