Inferring Users’ Image-Search Goals with Pseudo-images Zheng Lu1, Xiaokang Yang1, Weiyao Lin1, Xiaolin Chen1, Hongyuan Zha2 1
Institute of Image Communication and Information Processing, Department of Electronic Engineering, Shanghai Jiao Tong University, Shanghai, China
Abstract—The analysis of user search goals for a query can be very useful in improving search engine relevance and user experience. Although the research on inferring user goals or intents for text search has received much attention, little has been proposed for image search with visual information. In this paper, we propose a novel approach to capture user search goals in image search by exploring pseudo-images which are extracted by mining single sessions in user click-through logs to reflect user information needs. Moreover, we also propose a novel evaluation criterion to determine the number of user search goals for a query. Experimental results demonstrate the effectiveness of the proposed method.
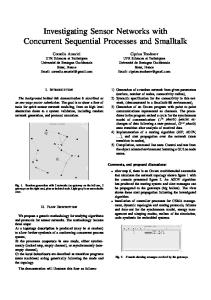
I. INTRODUCTION In web search applications, queries are submitted to search engines to represent user search goals. However, in many cases, queries may not exactly represent what users expect since these queries may be polysemous or cover a broad topic. In image search, multiple user search goals for a query can be represented by different image examples as shown in Fig. 1. For the queries ‘apple’ and ‘bank’, users may have three and two search goals, respectively. The distributions of user search goals by our experiment are also given on the right side in Fig. 1. Inferring these user search goals is very important in improving search engine relevance and user experience. The captured user search goals can be utilized in many applications, such as visual query suggestion [13] and search result organization [11,12]. In recent years, the research on inferring user goals or intents for text search has received much attention [5,6,11,12]. However, few methods were proposed in image search. Zha et al. [13] try to capture user goals to give visual suggestions for a query in image search. They first find some keywords as textual suggestions with tags. Then they select the images according to the keywords as visual suggestion. However, their method is still based on textual information and tags of the images have to be used in their methods. Since textual information is not always reliable for representing image contents, these textbased methods may not be well suited for image search applications. And it is more potential and challenging to infer users’ image-search goals with the visual information of the images. Furthermore, many text-based search-goal inference methods focus on analyzing the clicked documents in user click-through logs directly [11] or clustering the search results [12]. However, these methods have limitations since the number of the different clicked documents for a query may be small and the search results may contain many noisy documents. And the distributions of different user search goals may also become unachievable by these methods. These problems in text-based search-goal inference are also big challenges for image-based user search goal applications. Moreover, a lot of early researches define user intents as ‘Navigational’ and ‘Informational’ [5] or some specific predefined aspects such as ‘Product intent’ and ‘Job intent’ [6].
2 College of Computing Georgia Institute of Technology Atlanta, Georgia, USA
Fig. 1. Different user search goals represented by image examples and their distributions in image search by our experiment.
However, in fact, these applications belong to query classification. The inferred user search goals should be more meaningful, and the number of them should not be predefined. In this paper, we infer user search goals and give their distributions as shown in Fig. 1 by our pseudo-image-based method, which solves all the above problems simultaneously: Firstly, we introduce pseudo-images to infer users’ imagesearch goals. Thus, we do not need any textual information in our method. User search goals in image search have particular visual patterns. Our method captures these patterns from visual information. Secondly, we propose to map a single session in user clickthrough logs to a pseudo-image to represent user information need. We demonstrate that clustering single sessions is more efficient than clustering search results or clicked images directly when inferring user search goals. Moreover, when clustering single sessions, the distributions of different user search goals can be obtained conveniently. Thirdly, we propose a novel evaluation criterion to decide the number of user search goals for a query when clustering the pseudo-images. The rest of the paper is organized as follows. Section II presents how and why to map a single session in user clickthrough logs to a pseudo-image to represent user information need. Section III describes the proposed method to infer users’ image-search goals by clustering pseudo-images and the proposed evaluation criterion to decide the number of user search goals. Section IV shows the experimental results and conclusions are drawn in Section V. II. REPRESENT USER INFORMATION NEED WITH A PSEUDOIMAGE
For a query, users will usually have some vague figures or concepts in their minds. They use these figures rather than texts to decide whether an image satisfies their needs. We name these vague figures ‘goal images’ as shown in Fig. 2. However, although goal images can reflect user information needs from visual aspect, they are latent and not expressed explicitly. Therefore, we introduce pseudo-images as surrogates to approximate goal images. Thus, pseudo-images can be analyzed to infer user search goals. In this section, we first describe how
probabilities that a concept appears in different images can be averaged. Empirically, for three feature channels CMG, LBP and concept vector feature, feature fusion is implemented to get fF. For the other three channels CC, CT and EAC, image fusion is implemented to get fI. At last, we concatenate fF and fI to get the feature of pseudo-image fp to approximate the goal image. A single session
f1
Fig. 2. Goal images. For a query, different users will have different vague figures or concepts in their minds. We name these vague figures ‘goal images’, which reflect user information needs from visual aspect.
A user s clicks for the query
apple
A single session
f2
f3
= = =
f 11 f 12 f 1n
f 21 f 22 f2n f 31 f 32 f3n
Feature fusion
f F1 f f F F2 f Fn
Goal image
to extract pseudo-images from user click-through logs and then we illustrate why to infer user search goals with pseudo-images.
Feature of pseudo-image Image fusion
f
f F
P f f I1 I f fI I2 f Im Fig. 4. Map a single session to pseudo-image to approximate goal image.
(a)
(b)
Fig. 3. A single session of the query ‘apple’ in user click-through logs. (a) shows the search results returned by the search engine and the check marks mean that the images are clicked. (b) a single session.
A. Map single sessions to pseudo-images Generally, a session for web search is a series of successive queries to satisfy a single information need and some clicked search results. In this paper, we focus on inferring user search goals for a particular query. Therefore, a single session containing only one query is introduced, as shown in Fig. 3. For a query, the clicked images in a single session reflect user information need to a large extent. Therefore, although goal images in user minds are unavailable, we can map single sessions to pseudo-images to approximate goal images. There are two strategies to combine the images in a single session into a pseudo-image: feature fusion and image fusion. As shown in Fig. 4, feature fusion first extracts features for each image in the single session respectively. Then the feature vectors are averaged to generate fF. Image fusion first creates a picture collage. Then the feature of the collage fI is extracted. There are some methods to create a picture collage from a group of images [10]. In this paper, we simply put the images into one frame to get the mosaic collage. As for image features, we use both low-level and high-level features. Firstly, we extract three types of low-level features (i.e., color, texture and shape features) including Color Moments (CMG) [9], Color Correlogram (CC) [4], Cooccurrence Texture (CT) [3], Local Binary Pattern (LBP) [8] and Edge Auto-Correlogram (EAC) [7]. Then, we use the dataset of Caltech 101 object categories [2] and LIBSVM [1] to detect 101 concepts as the high-level feature (i.e., each dimension of the concept vector is the probability that the corresponding concept appears in the image). Thus, we have totally six feature channels. For different feature channels, different fusion strategies should be implemented. For example, the concept vector feature should use feature fusion, since the
B. Advantages of pseudo-images Although goal images are unavailable, the clicked images in a single session can reflect user information need to a great extent. Pseudo-images combine those images and extract particular patterns with different strategies to approximate goal images. Due to the lack of previous works on inferring user image-search goals from visual information, we compare our method with other two methods commonly used in text search.
(a) (b) Fig. 5. Clustering of all the different clicked images in user click-through logs and pseudo-images, where points represent the clicked images, ellipses in (b) represent pseudo-images and lines represent class boundaries. Supposing that the clicked images have two classes, the points in (a) are hard to be segmented directly, while the ellipses in (b) are easier to be segmented.
(1) Why not clustering all users’ clicked images directly: Many previous works discover user search goals in text search by directly analyzing the clicked documents in user clickthrough logs [11]. Compared with clustering the clicked images directly, clustering pseudo-images is more efficient since each pseudo-image is a meaningful combination of several images. In Fig. 5, the solid points represent the clicked images mapped into a two-dimensional space and we suppose that users have two search goals: the star points belong to one goal and the circle points belong to the other goal. Since the number of different clicked images could be small, if we perform clustering directly on the points, it is very difficult to segment them precisely, as in Fig. 5 (a). However, when we perform clustering based on pseudo-images, the ellipses which represent
pseudo-images are much easier to be segmented, as in Fig. 5 (b), since there can be more combinations of clicked images than clicked images themselves. Moreover, from another point of view, pseudo-images can also be viewed as a pre-clustering of images for a more efficient clustering. (2) Why not clustering search results: Pseudo-images can also be considered as a process of resampling. If we view the original images in the search results as the original samples, then pseudo-images can be viewed as the 'processed' or 'resampled' samples which reflect user information needs. There could be many noisy images, which were seldom clicked by users, in the search results. If we cluster images with these noisy ones, the performance of clustering will greatly degrade. However, since the pseudo-image only includes the clicked images, it can actually 're-sample' the images in the search results and exclude those noisy images. Furthermore, the resampling by pseudo-images brings the information of user goal distribution to the new samples. For instance, most original samples are about the fruit apple in the set of the search results of the query ‘apple’, while most samples are about apple computers and iPhones in the set of pseudo-images. We can obtain user goal distribution from the resampled set. Therefore, the introduction of pseudo-images provides a more reasonable way for clustering. III. INFER USER SEARCH GOALS BY CLUSTERING PSEUDOIMAGES
Since in our method, each pseudo-image represents one use's information need, by clustering all the pseudo-images for a query, we can get different user search goals. In this paper, we cluster pseudo-images by K-means clustering which is simple and effective. Since we do not know the exact number of user search goals of each query, we set K to be 5 different values (1,2,…,5) and perform clustering based on these five values, respectively. Then we propose a novel evaluation criterion to determine the value of K. Each pseudo-image is represented by a normalized feature vector fp. The similarity between two pseudo-images is computed as the cosine score as follows: fp fp j (1) Simi , j cos f p i , f p j i , fp i fp j
proper, all the clicked images in one single session should be categorized into one class. If it is not the case, users will “disagree” with the clustering result to some extent. This disagree criterion can be calculated by Eqn. (4): 1 U s (4) Disagree u , U u 1 su where U is the number of single sessions, su is the number of all the clicked images in the u-th single session and s u is the number of the images that do not belong to the goal-containing class. The goal-containing class is the one that includes the most clicked images in the u-th single session. Since smaller K usually reduces users’ disagreements (e.g., in the extreme case, Disagree=0 when K=1), other two distances are introduced to revise the evaluation criterion as follows: 1 M (5) Dinter min Dis f m , fck , M m 1 k 1 U (6) Dintra min Dis f p u , f c k . U u 1 k In Eqn. (5), M is the number of the clicked images in all the single sessions, k is from 1 to K, fm is the feature vector of the m-th image and fck is the k-th cluster's center. In Eqn. (6), U is the number of pseudo-images, fpu is the feature vector of the uth pseudo-images. Bigger K usually reduces Dinter and Dintra. Finally, the proposed criterion to evaluate and determine the number of clusters is the “risk” of choosing the wrong value of K. This risk is the combination of Disagree, Dinter and Dintra as follows: (7) Risk Disagree 1 Dinter Dintra .
We choose the value of K when the Risk is the smallest. In this paper, we set to be 0.375 empirically.
and the distance between two pseudo-images is
Dis f p i , f p j 1 Simi , j .
(2)
After clustering all the pseudo-images based on the distance metric by Eqn. (2), each cluster center can be considered as one user search goal as shown in Eqn. (3):
Ck
f
(3) , f p i Cluster k , Ck where fck is the k-th cluster's center and Ck is the number of the pseudo-images in the k-th cluster. fck is utilized to conclude the user search goal of the k-th cluster. We select the image closest to the center point to represent this user search goal. In order to determine the value of K in K-means clustering, we develop a user-disagree criterion to implicitly evaluate the performance of clustering by analyzing user click-through data. For a single session, we classify each clicked image into one of K classes. Usually, one user has only one particular search goal when he/she submits a query. Therefore, if the clustering is fck
i 1 p i
Fig. 6. Our image search platform for collecting user click-through logs.
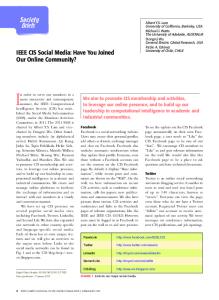
IV. EXPERIMENTS In order to get user click-through logs in image search, we established an image search platform as shown in Fig. 6. We chose 21 ambiguous queries to be used in the experiment. We submitted 11 queries to www.flickr.com and 10 to Google Image and downloaded top 100 images in the search results returned by the search engines to each query, respectively. Then we established our own platform for collecting user clickthrough logs and put it on Internet. Finally, we got 112 single sessions for each query. In the following, we will show our experimental results. Due to the limited space, only parts of the results are shown in this paper. We compare our method to other two methods: Method I and Method II. Method I clusters the top 100 search results to infer
user search goals and Method II clusters all the clicked images directly. Fig. 7 shows the intuitive results of inferring users’ image-search goals for all the 21 queries by our method. After clustering all the pseudo-images of a query, for each cluster we select the picture closest to its center as the corresponding search goal. Meanwhile, we can get the number of pseudoimages in each cluster. Thus, the distributions of user search goals can be obtained. We can see from Fig. 7 that by our method, only two queries ‘sand’ and ‘spring’ do not have the results as we expected. This is because the sands of desert and beach are hard to be distinguished and springtime has similar scene with spring water. Compared with our method, our results show that Method I or Method II can hardly get expected results for any queries, as will be discussed more in Fig. 8.
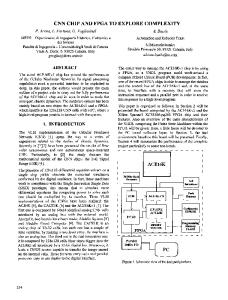
inferring users’ image-search goals with visual information only. And we analyze the advantages of inferring user search goals by clustering pseudo-images. Experimental results demonstrate that the proposed method can infer user search goals effectively. Table 1. Average Risk, Disagree and Dinter+Dintra comparisons of three methods for 21 queries.
Average Risk 0.335 0.508 0.496
Method Our Method Method I Method II
Average D inter D intra 0.298 0.473 0.441
Average Disagree 0.061 0.058 0.091
0.65
Our method Method I Method II
0.6
Dinter+Dintra
0.55 0.5 0.45 0.4 0.35 0.3 0.25 0.2 0
0.05
0.1
0.15
0.2
Disagree
0.25
0.3
0.35
0.4
Fig. 8. Each query’s Disagree and Dinter+Dintra. The X-axis of the points represents Disagree and the Y-axis of the points represents Dinter+Dintra.
VI. ACKOWLEDGEMENTS This paper was supported in part by NSFC (61025005, 60932006, 61001146), 973 Program (2010CB731401, 2010CB731406) and the 111 Project (B07022).
VII.
Fig. 7. The inferred users’ image-search goals and their distributions by our method. The images of the left 11 queries are downloaded from Flickr and the images of the right 10 queries are downloaded from Google Image.
Besides the value of K in K-means clustering, the Risk in Eqn. (7) according to the best K can also be utilized to evaluate the performance of inferring user search goals. The average Risk, Disagree and Dinter+Dintra. of 21 queries by three methods are shown in Table 1. Our method has the smallest average Risk, which is 34.1% smaller than Method I and 32.5% smaller than Method II. Fig. 8 shows each query's Disagree and Dinter+Dintra in detail. If user search goals are inferred properly, Disagree and Dinter+Dintra should be small simultaneously. From Fig. 8, we can see that the points of our method are closer to the lower left corner. This shows that our method has the best performance. Comparatively, many points in Method I and II are located on Y-axis, which means that they are considered as single-goal queries, for which users have only one search goal. Obviously, we can not infer user search goals properly by Method I and II. V. CONCLUSION In this paper, we propose a pseudo-image based method for
REFERENCES
[1] C-C. Chang and C-J. Lin, LIBSVM: a library for support vector machines, 2001. Software available at http://www.csie.ntu.edu.tw/~cjlin/libsvm. [2] L. Fei-Fei, R.Fergus and P. Perona, “Learning generative visual models from few training examples: an incremental Bayesian approach tested on 101 object categories”, CVPR 2004, Work shop on Generative-Model Based Vision. 2004. [3] R. M. Haralick, K. Shanmugam and Its'Hak Dinstein, “Texture features for image classification,” IEEE Trans. on Sys, Man, and Cyb, SMC-3(6):610-621, 1973. [4] J. Huang, S.R. Kumar, M. Mitra, W.J. Zhu and R. Zabih, “Spatial color indexing and applications,” Int’l Journal of Computer Vision, vol. 35, pp. 245268, 1999. [5] U. Lee, Z. Liu and J. Cho, “Automatic identification of user goals in web search,” WWW, pp. 391-400, 2005. [6] X. Li, Y-Y. Wang and A. Acero, “Learning query intent from regularized click graphs,” SIGIR, pp. 339-346, 2008. [7] F. Mahmoudi, J. Shanbehzadeh A. Eftekhari-Moghadam and H. SoltanianZadeh, “Image retrieval based on shape similarity by edge orientation autocorrelogram,” IEEE Trans. on Pattern Recognition, vol. 36, pp. 1725-1736, 2003. [8] T. Ojala, M. Pietikainen and T. Maenpaa, “Multiresolution gray scale and rotation invariant texture analysis with local binary patterns,” IEEE Trans. on Pattern Analysis and Machine Intelligence, vol. 24, pp. 971-987, 2002. [9] M. Stricker and M. Orengo, “Similarity of color images,” Storage and Retrieval for Image and Video Databases III, vol. 2158, pp. 381-392, 1995. [10] J. Wang, J. Sun, L. Quan, X. Tang and H. Shum, “Picture collage,” CVPR, pp. 347-354, 2006. [11] X. Wang and C-X. Zhai, “Learn from web search logs to organize search results,” SIGIR, pp. 87-94, 2007. [12] H-J. Zeng, Q-C. He, Z.Chen, W-Y. Ma and J. Ma, “Learning to cluster Web search results,” SIGIR, pp. 210-217, 2004. [13] Z-J. Zha, L-J. Yang, Z-F. Wang, T-S. Chua and X-S. Hua, “Visual query suggestion: towards capturing user intent in internet image search,” ACM Trans. On Multimedia Comput. Commu. Appl. 6, 3, Article, August 2010.