255
Individual Variation in Migration Speed of Upriver-Migrating Sockeye Salmon in the Fraser River in Relation to Their Physiological and Energetic Status at Marine Approach Kyle C. Hanson1,* Steven J. Cooke1 Scott G. Hinch2,3 Glenn T. Crossin2 David A. Patterson4 Karl K. English5 Michael R. Donaldson1 J. Mark Shrimpton6 Glen Van Der Kraak7 Anthony P. Farrell8 1 Fish Ecology and Conservation Physiology Laboratory, Ottawa-Carleton Institute for Biology, Carleton University, 1125 Colonel By Drive, Ottawa, Ontario K1S 5B6, Canada; 2 Centre for Applied Conservation Research, Department of Forest Sciences, University of British Columbia, 2424 Main Mall, Vancouver, British Columbia V6T 1Z4, Canada; 3 Institute for Resources, Environment, and Sustainability, University of British Columbia, Vancouver, British Columbia V6T 1Z4, Canada; 4Fisheries and Oceans Canada, Science Branch, Pacific Region, Cooperative Resource Management Institute, School of Resource and Environmental Management, Simon Fraser University, Burnaby, British Columbia V5A 1S6, Canada; 5LGL Environmental Research, 9768 Second Street, Sydney, British Columbia V8L 3Y8, Canada; 6Ecosystem Science and Management Program, University of Northern British Columbia, Prince George, British Columbia V2N 4Z9, Canada; 7Department of Integrative Biology, University of Guelph, Guelph, Ontario N1G 2W1, Canada; 8Department of Zoology, Faculty of Agricultural Sciences, University of British Columbia, Vancouver, British Columbia V6T 1Z4, Canada Accepted 9/28/2007; Electronically Published 2/26/2008
ological and energetic status on a large spatial scale in the wild. As a model, we used three stocks of summer-run sockeye salmon (Oncorhynchus nerka) from the Fraser River watershed, British Columbia, to test the hypothesis that individual variation in migration speed is determined by a combination of environmental factors (i.e., water temperature), intrinsic biological differences (sex and population), and physiological and energetic condition. Before the freshwater portion of the migration, sockeye salmon (Quesnel, Chilcotin, and Nechako stock complexes) were captured in Johnstone Strait (∼215 km from river entry), gastrically implanted with radio transmitters, and sampled for blood, gill tissue, and energetic status before release. Analyses focused solely on individuals that successfully reached natal subwatersheds. Migration speeds were assessed by an extensive radiotelemetry array. Individuals from the stock complex that migrated the longest distance (Nechako) traveled at speeds slower than those of other stock complexes. Females traveled slower than males. An elevated energetic status of fish in the ocean was negatively correlated with migration speed in most river segments. During the transition from the ocean to the river, migration speed was negatively correlated with mean maximum water temperature; however, for the majority of river segments, it was positively correlated with migration speed. Physiological status measured in the ocean did not explain among-individual variability in river migration speeds. Collectively, these findings suggest that there could be extensive variation in migration behavior among individuals, sexes, and populations and that physiological condition in the ocean explained little of this variation relative to in-river environmental conditions and energetic status. Interestingly, individual fish generally retained their rank in swimming speed across different segments, except when transiting a challenging canyon midway during the migration.
ABSTRACT
Introduction
Little research has examined individual variation in migration speeds of Pacific salmon (Oncorhynchus spp.) in natural river systems or attempted to link migratory behavior with physi-
Migration, defined as long-distance, directional movements made at the same time by numerous individuals of the same species (Endler 1977), occurs in many species across various taxa (Schneider and Frost 1986; Sorenson and Bianchini 1986; Carmichael et al. 1998; Perryman et al. 1999; Pu¨tz et al. 2002). Undertaking a costly migration generally confers individual benefits, such as locating a favorable habitat that enables more rapid growth or higher survivorship, congregating in breeding
* Corresponding author; e-mail:
[email protected]. Physiological and Biochemical Zoology 81(3):255–268. 2008. 䉷 2008 by The University of Chicago. All rights reserved. 1522-2152/2008/8103-70272$15.00 DOI: 10.1086/529460
256 Hanson, Cooke, Hinch, Crossin, Patterson, English, Donaldson, Shrimpton, Van Der Kraak, and Farrell areas as a mechanism to bring together disparate individuals for mating, or moving to areas that allow for the birth of young in favorable habitats (Dingle 1980, 1996; Northcote and Burwash 1991). Correspondingly, many of the most prevalent and longest migrations involve sexual reproduction (Dingle 1980, 1996; Pu¨tz et al. 2002). Some of the largest and most widely known migration events occur when Pacific salmon (Oncorhynchus spp.) return from the ocean to their natal freshwater streams to spawn (Groot and Margolis 1991; Dodson 1997; Hinch et al. 2006). Several recent laboratory studies have noted the role of individual variation in locomotory performance in various taxa, such as reptiles, mammals, and fish (Bennett et al. 1984, 1989; Garland 1984; Walsberg et al. 1986; Kolok 1992; Garenc et al. 1999). What was once regarded as statistical noise in locomotory data is now regarded as real interindividual variation in performance. Statistical approaches have been developed that embrace this variation rather than try to eliminate it (Kolok 1992). Within the laboratory setting, repeatable individual variation in locomotory performance has been noted in multiple fish species (Kolok 1992; Kolok and Farrell 1994; Martı´nez et al. 2001). Recently, there has been an interest in developing techniques focused on studying individual variation in locomotory performance in the field, largely through the use of mobile respirometry equipment at field sites (e.g., Farrell et al. 1998) or through biotelemetry and biologging devices that couple behavior and physiology (e.g., Cooke et al. 2004b; Block 2005). These techniques have been used on a variety of taxa, including fishes, with many studies on Pacific salmon (Hinch et al. 2002; Keefer et al. 2005). Unfortunately, there are two primary limitations with fieldcollected locomotory data for Pacific salmon. First, most largescale studies that incorporate entire migration routes take place on human-altered systems, such as the Columbia River, a highly impacted watershed characterized by multiple dams that serve as major impediments to natural migration behavior (Keefer et al. 2004; Johnson et al. 2005; Naughton et al. 2005; Goniea et al. 2006; High et al. 2006). Although we have learned much about salmonid migration behavior in the Columbia watershed, the behavior of migrating salmon in natural systems, where there are fewer anthropogenic selection forces, is poorly understood. Second, studies in systems with more natural discharge and temperature patterns have generally focused only on discrete spatial areas (e.g., reaches several kilometers long on the Fraser River watershed; Hinch and Rand 2000; Hinch et al. 2002; Standen et al. 2002), providing fascinating insights into swimming energetics (summarized in Cooke et al. 2004c; Hinch et al. 2006) at the scale of meters to kilometers but not across entire migration routes. The spawning migration of Pacific salmon creates severe energetic and physiological consequences for individuals (Brett 1995; Hinch et al. 2006). Energy reserve depletion and physiological stress can result in en route mortality for some individuals (Macdonald 2000; Cooke et al. 2006b; Rand et al. 2006; Young et al. 2006). Individual migration behavior and survival
vary widely (Hinch and Rand 1998; Hinch and Bratty 2000; Standen et al. 2002), and individual-specific differences in migration physiological and energetic states may be responsible (Cooke et al. 2004a, 2006a, 2006b; Young et al. 2006). However, there has been little investigation of the individual variation in swimming speed and its relationship to the physiological and energetic status of migrating Pacific salmon across entire inriver migrations. The Fraser River watershed is one of the world’s largest producers of sockeye salmon (Oncorhynchus nerka; Northcote and Burwash 1991), with millions of adults returning to spawn each year. In some populations, individuals vary considerably in physiological and energetic state at the start of their migration (Cooke et al. 2004a); thus, this study system affords researchers a unique opportunity to investigate the role of individualspecific physiology on migration behavior in a relatively natural flowing large river. We test the hypothesis that individual variation in migration speed is determined by a combination of environmental factors (i.e., water temperature), intrinsic biological differences (sex and population), and physiological and energetic condition. We accomplish this by using nonlethal physiological and energetic biopsies collected from individuals that were captured before initiation of upriver migration (Cooke et al. 2005) and that were fitted with transmitters and then released and tracked using a watershed-scale radiotelemetry array to quantify in-river migration speeds of successful migrants. Before river entry, individual migratory sockeye salmon can vary substantially in their physiological and energetic status (e.g., Crossin et al. 2004; Shrimpton et al. 2005; Cooke et al. 2006b; Hinch et al. 2006). First, we predicted that certain physiological and energetic conditions within a stock complex would promote slower swimming and hence affect migration speeds. High levels of metabolites (e.g., lactate) and low levels of gross somatic energy should cause slower swimming and thus reduce migration speeds. Second, sockeye salmon stock complexes vary considerably in migratory distances. Previous evidence indicates that sockeye that migrate the farthest are most likely to travel at optimal speeds to conserve energy required for spawning (Bernatchez and Dodson 1987; Hinch and Rand 2000). In fact, initial energy densities before migration vary according to migratory difficulty (a composite of distance traveled and elevation gained; Crossin et al. 2004). We predicted that stock complexes that are required to travel long distances will have the fastest migration speeds to reach spawning grounds so that less energy is lost to routine metabolism before energy reserves are depleted. Third, previous work has also shown that intersexual differences in energy expenditure exist as sockeye salmon migrate through the Fraser River (Hinch and Rand 1998; Hinch et al. 2002; Standen et al. 2002). Additionally, energy portioning for gametogenesis varies drastically between the sexes (Brett 1965; Gilhousen 1980; Jonsson et al. 1997). As such, we predicted that intersexual differences in migration speed may occur (Standen et al. 2002). Fourth, because field respirometry experiments have shown that indi-
Individual Variation in Migrating Salmon Biology 257 Table 1: List of study segments and corresponding river locations along the Fraser River, British Columbia Study Segment
River Location
A B C D E F G
Ocean release to Mission Mission to Harrison River junction Harrison River junction to Hope Hope to below Hell’s Gate Canyon Hell’s Gate Canyon transit Above Hell’s Gate Canyon to Thompson River junction Thompson River junction to Chilcotin River junction
vidual wild salmon from various species and stock complexes can repeat their swimming performance (Farrell et al. 1998; Lee et al. 2003; Tierney and Farrell 2004), we predicted that swimming performance of individual sockeye was repeatable throughout the entire migration, such that individuals will retain their rank with respect to migration speed (e.g., fast fish always being fast). Last, we investigated the possibility that swimming performance (i.e., migration speed) along the migration is not uniform. During the in-river migration, sockeye salmon move through river segments that differ greatly in hydrological characteristics. Sockeye expend the most energy in areas of increased flow and complex flow dynamics, especially at channel constrictions (Hinch and Rand 1998; Hinch and Bratty 2000; Hinch et al. 2002). Therefore, we predicted that migration speed should change through various segments of the river, reflecting variable environmental conditions across the migration route. Because of the manifold effects of water temperature on salmon (Hinch et al. 2006), we predicted that river segment–specific water temperatures would affect migration speed. Beyond a stock-specific thermal threshold, sockeye salmon swimming behavior is compromised, fish become extremely stressed, and many succumb to en route mortality (Lee et al. 2003; Cooke et al. 2006b). Accordingly, we predicted that different stock complexes (defined as a collection of stocks from the same run timing group that spawn in the same subnatal watershed) will respond differently to elevated water temperatures. Material and Methods Fish Capture and Study Site The data included in this article were derived from a larger project that included evaluation of biosampling techniques (Cooke et al. 2005), evaluation of stock-specific differences in mortality and behavior (Cooke et al. 2006a, 2006b), and, for this article, evaluation of the behavior of successful migrants relative to physiological status and in-river environment, in an effort to understand the migration biology of Pacific salmon. Fish were captured by a commercial purse seine vessel near the southern end of Johnstone Strait in coastal British Columbia, approximately 215 km from the mouth of the Fraser River. All fish were captured between August 11 and 28, 2003, at surface
water temperatures ranging from 10⬚ to 13⬚C. In total, 155 sockeye salmon individuals from the three largest Fraser River summer-run stock complexes (herein referred to as Quesnel, Chilcotin, and Nechako) were captured, radio-tagged, biopsied, and released before river entry. To reach spawning grounds, individuals from the Chilcotin, Quesnel, and Nechako stock complexes will travel ∼668, ∼723, and ∼965 km, respectively. Seven telemetry receiving stations were deployed along the Fraser River main stem and entrances to the natal subwatersheds to track movements of the radio-tagged individuals. The location of the receiving stations varied in distance from the ocean tagging site (Mission, 282 km; Harrison River junction, 317 km; Hope, 362 km; Hell’s Gate Canyon, 408 km; Thompson River junction, 463 km; and Chilcotin River junction, 668 km). The transit of Hell’s Gate Canyon was monitored by receiving stations at the beginning and end of the canyon (∼200 m long) because this segment of the river represents an especially difficult portion of the migration route (Hinch and Rand 1998; Hinch and Bratty 2000). For reference, areas between consecutive receiving stations will be referred to by alphabetical study segment coding (Table 1). Details on receiving station design and efficiency can be found in an article by English et al. (2005). Briefly, each receiving station consisted of up to three antennas connected to a data-logging radio receiver (SRX 400, Lotek Engineering, Newmarket, Ontario). The fish detection efficiency of these stations ranged between 88% and 100%, with increasing efficiency in shallow and narrower segments of the river, especially near natal spawning grounds. Only fish that successfully entered the river (determined by detection at the first telemetry station at Mission) were included in our analyses (i.e., 43 Quesnel, 85 Chilcotin, and 27 Nechako). Average net migration speeds (km h⫺1) of individual fish were determined by dividing the time between detection of an individual at two sequential receiving stations by the distance between those stations.
Biosampling and Tagging All biopsy techniques were performed on unanesthetized fish because there are no anesthetics approved for use in a fishery, where fish could possibly be captured for consumption. All sampling protocols were approved by the University of British
258 Hanson, Cooke, Hinch, Crossin, Patterson, English, Donaldson, Shrimpton, Van Der Kraak, and Farrell Columbia Animal Care Committee and had been validated as not causing deleterious effects on behavior and survival in other studies (Cooke et al. 2005). The purse seine capture vessel served as the tagging and sampling platform. For each seine set, the purse was gathered to the side of the boat and remained in the water as individual fish were netted out and transferred to large flow-through totes on the deck. Fish remained within the drawn purse for fewer than 5 min as they awaited transfer. When an individual was selected for sampling and tagging, it was removed from the tote and placed, ventral side up, in a V-shaped, foam-lined trough. While within the trough, fish were manually restrained and mostly submerged by a continuous flow of ambient seawater pumped across the gills through a tube placed in the mouth. The entire sampling procedure took fewer than 3 min and included measuring the fork length of the fish, taking tissue biopsies, and orally inserting a transmitter into the stomach (for details, see Cooke et al. 2005). From all fish, a 0.5-g piece of the adipose fin was removed for DNA stock identification, and a single scale was removed for aging. On a subset of fish, a Vacutainer syringe (1.5 in, 21 gauge) was inserted into the
caudal vessels, and 3 mL of blood (less than 2% of total blood volume; Smith 1966) was drawn for plasma chemistry analysis (Houston 1990). A small sample of first gill arch tissue (!4 mm from the tips of six to eight gill filaments) was collected from a subset of fish (∼71%) for the analysis of gill enzyme activity (McCormick 1993). Gill tissue and centrifuged plasma samples were stored on dry ice before transfer to a ⫺80⬚C freezer for storage until analysis. A handheld microwave energy meter (Distell Fish Fatmeter model 692, Distel, West Lothian, Scotland) was used to determine somatic energy levels on 136 of the fish, following the procedures of Crossin and Hinch (2005). Coded radio transmitters (MCFT-3A, Lotek; 16 # 51 mm, 16.1 g in air, 6.2 g in water) were orally inserted via plastic applicator into stomach of each fish. Up to 30 fish were held in the holding tote for !1 h to facilitate recovery and then released as a group to minimize predation by marine mammals. Average net migration speed was calculated by dividing the distance between successive receiving stations by the time interval from the last position logged at the downstream station and the first position logged at the upstream station. This measure is limited by the fact that it does not take into account
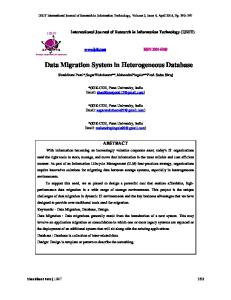
Figure 1. Map of the Fraser River watershed, British Columbia, including locations of capture point, telemetry stations (1–7), and sockeye salmon spawning grounds (circles) for the Quesnel, Chilcotin, and Nechako stock complexes. Water temperature data were sampled from a fixed station midway between telemetry stations 2 and 3.
Individual Variation in Migrating Salmon Biology 259 actual distance a fish may have traveled because it assumes fish traveled in a linear path up the middle of the river between stations, so actual migration speeds could be higher than our estimates. Moreover, in some river reaches, particularly those where encountered currents are slow, migration speeds can be equal to or higher than swimming speeds (i.e., the speed that could be achieved by propulsion in still water) of an individual due to the fact that salmon use localized differences in river currents to assist forward propulsion (Hinch and Rand 2000). As such, migration speed does not represent the exact speed at which an individual was swimming. Additionally, migration speeds from release in the ocean to Mission are probably underestimates of swimming speeds because sockeye salmon often delay river entry by milling in estuarine areas off the mouth of the Fraser River due to tidal cycles or other riverine phenomena (Hinch et al. 2006).
Environmental Variables River water temperature was measured daily in the main stem of the Fraser River at a location 165 km upstream from the ocean (Fig. 1). While there are limitations to measuring temperature at a single point in the river, all individuals were monitored while migrating only through the main stem of the Fraser River and would have been subjected to similar temperature regimes as measured at this site. The general thermal conditions an individual fish would encounter in each river segment were reconstructed by determining the maximum and mean water temperature values for the days an individual fish was present in a specific segment, based on measurements from this single location. As such, values for mean maximum and daily tem-
peratures were determined on an individual basis and used in analyses to assess the role of water temperature on swimming performance.
Laboratory Assays Detailed descriptions and discussions of interassay variability and accuracy of measurements can be found in an article by Farrell et al. (1998). Stock origin of all fish was determined by DNA analyses (Beacham et al. 1995) and confirmed by tracking telemetered individuals to the spawning grounds. DNA analysis to determine stock origin has become a common fisheries technique and has been shown to be 96% accurate for Fraser River sockeye salmon (T. Beacham, personal communication). Of the 155 sockeye salmon that were tagged, sampled, and subsequently analyzed for this study, physiological analyses were performed on plasma and tissues of 110 individuals. Reproductive hormones were used to assign sex. Specifically, we regressed plasma testosterone and 17b-estradiol to yield two specific clusters of male and female fish (Cooke et al. 2006a). Reproductive hormones were measured by radioimmunoassay (McMaster et al. 1992). Plasma ion (K⫹, Cl⫺, Na⫹), cortisol, lactate, glucose, and osmolality measurements were made following procedures described by Farrell et al. (1998). Gill tissue Na⫹/K⫹-ATPase activity (mmol ADP mg protein⫺1 h⫺1) was determined through kinetic assay (McCormick 1993). All laboratory analyses occurred within 6 mo of sample collection. Analyses of interpopulation and intersexual variation in physiological and energetic variables can be found in an article by Cooke et al. (2006a).
Table 2: List of physiological, energetic, biological, and environmental variables analyzed to determine correlates of individual variation in migration speeds of adult sockeye salmon during upstream migration in the Fraser River, British Columbia Variable Type
Measurement
Physiological
Plasma Na⫹ (mmol L⫺1) Plasma Cl⫺ (mmol L⫺1) Plasma K⫹ (mmol L⫺1) Plasma osmolality (mosmol kg⫺1) Plasma glucose (mmol L⫺1) Plasma lactate (mmol L⫺1) Gill Na⫹/K⫹ ATPase (mmol ADP mg protein⫺1 h⫺1) Plasma cortisol (ng mL⫺1) Stock complex (Quesnel, Chilcotin, Nechako) Sex (male, female) Nose fork length (cm) Gross somatic energy (MJ kg⫺1) Mean segment temperature (⬚C) Mean maximum segment temperature (⬚C)
Biological
Energetic Environmental
260 Hanson, Cooke, Hinch, Crossin, Patterson, English, Donaldson, Shrimpton, Van Der Kraak, and Farrell Table 3: Results of a three-way ANOVA comparing three stock complexes (Chilcotin, Quesnel, Nechako) of adult sockeye salmon and their individual migration speeds during upstream migration in the Fraser River, British Columbia Effects
df
Sum of Squares
F Ratio
P Value
River segment Stock complex Sex Sex # stock complex River segment # stock complex Sex # river segment River segment # sex # stock complex
6 2 1 2 12 6 12
114.846 2.005 .702 .612 .479 .328 .745
186.853 9.786 6.855 2.989 .389 .533 .606
!.0001 !.0001
Statistical Analysis For the purpose of this study, as it focuses on the migration speed of successful migrants, only individuals that were subjected to the full suite of physiological sampling and that successfully migrated across all seven radio receiving stations were included in statistical analysis. Three-way ANOVA, followed by Tukey’s HSD post hoc tests, was performed to test for differences in migration speeds among study segments, among stocks, between sexes, and for all interactions (Day and Quinn 1989; Zar 1999). For each river segment, forward-loading stepwise multiple regression was used as a parameter selection tool (probability to enter p 0.250) to determine the physiological factors most influencing migration speeds (JMP, ver. 4.0; SAS Institute 2001; Table 2). Parameter effects and measures of significance were determined by running final models through the standard least squares method regression tool. To determine the repeatability of migration speeds by individuals, Spearman’s coefficient of rank correlation tests were conducted on sequential river segments (Kolok 1992). Among-segment repeatability of migration speeds was determined by assessing correlations between the rank order of individual migration speeds between consecutive river segments. The level of significance for all tests (a) was assessed at 0.05 (Zar 1999). All values presented represent means Ⳳ SD unless otherwise noted. Results Three-way ANOVA did not find any significant interactions among study segment, stock, and sex (Table 3). Migration speeds varied throughout the study segments (three-way ANOVA: F6, 41 p 114.846, P ! 0.0001), with highest speeds in segment B (between Mission and Hope; 1.93 Ⳳ 0.05 km h⫺1) and slowest speeds in segment E (Hell’s Gate Canyon transit; 0.25 Ⳳ 0.04 km h⫺1; Table 3; Fig. 2A). Differences also existed among stock complexes (three-way ANOVA: F2, 41 p 2.005, P ! 0.0001), with Nechako fish traveling at speeds slower than those of the other two stocks (Table 3; Fig. 2B). Also, the Quesnel and Chilcotin fish did not differ significantly in their migration speeds within the various river segments (Table 3; Fig. 2B). There was no interaction between stock complex and river segment (three-way ANOVA: F12, 41 p 0.389, P p 0.967;
.0091 .051 .967 .783 .838
Table 3; Fig. 2C). Last, female fish typically traveled 5% slower than males, and these sex-specific differences in migration speed persisted across the migration (Table 3; three-way ANOVA: F1, 41 p 6.855, P p 0.0091). The results of the stepwise linear regressions indicated that several factors (i.e., water temperature, energetic state, and physiological state) were correlated with an individual’s migration speed (Table 4). The linear regressions explained up to 43.5% (segment C [Harrison River junction to Hope]) of the variance in migration speeds. The regressions explained the least amount of the variance (as low as 7.4%) for the marine environment (segment A [release to Mission]) and through segment E (Table 4). No physiological variables significantly predicted migration speeds throughout the entire migration. Only two variables, gross somatic energy density and maximum mean water temperature, explained significant interindividual variance in migration speeds—but only in certain migration segments. Fish with a lower energy reserve traveled faster than fish with higher reserves through segments C, D, F, and G (Table 4). Temperature played a varying role throughout the migration. In segment A, fish had slower migration speeds when mean maximum temperature was high, suggesting that high river temperatures may slow sockeye migration to Mission (Table 4). However, in most upstream segments, fish had faster migration speeds when mean maximum temperature was high (Table 4). By contrasting migration speeds of individuals in adjacent segments, we established that individuals ranked in a repeatable fashion through every river segment that was not adjacent to the ocean or to the Hell’s Gate Canyon (Fig. 3). Spearman’s r values of 0.788 comparing study segments B and C, 0.398 comparing study segments C and D, and 0.485 comparing study segments F and G indicate that some individuals reliably travel at migration speeds higher than those of others (Fig. 3). However, the rank order of sockeye salmon migration speeds was not correlated in study segment A (Spearman’s r p 0.268) or when comparing adjacent river segments with the transit of Hell’s Gate Canyon (Spearman’s r p 0.180 and 0.134, respectively; Fig. 3).
Individual Variation in Migrating Salmon Biology 261
Figure 2. Migration speeds of three stock complexes of adult sockeye salmon in the Fraser River watershed. In A, significant differences in migration speed between river segments are denoted by dissimilar letter groupings (Tukey’s HSD post hoc test, P ! 0.05 ). In B, significant differences in migration speed between stock complexes are denoted by dissimilar letter groupings (Tukey’s HSD post hoc test, P ! 0.05). In C, stock complexes are represented by differently shaded bars (Chilcotin p black, Nechako p dark gray, and Quesnel p light gray).
Discussion Migrations are among some of the best observed yet most enigmatic behaviors of animal species, especially fish. Recent studies and reviews have begun to unravel the role of physiology and energetics in salmon migration success (Ueda and Yamauchi 1995; Hogasen 1998; Cooke et al. 2006b; Hinch et al. 2006). Laboratory studies have noted that high levels of metabolites (i.e., plasma lactate) reduce swimming performance (Farrell et al. 1998; Jain and Farrell 2003) and can lead to swimming
cessation or mortality (Stevens and Black 1966). Field telemetry studies have demonstrated that fish that perish during migrations are characterized by having different plasma ions, metabolites, reproductive hormones, and energy levels compared to successful migrants (Cooke et al. 2006b; Young et al. 2006). We could not find any correlations between physiological variables and variation in migration speeds among individuals. Our study focused only on successful migrants—those that reached spawning regions; thus, interindividual variability in physiological condition may play less of a role in affecting swimming behavior than it does in affecting migration fate. Migrating adult Fraser River sockeye exhibit behaviors that reduce transport costs (i.e., seeking slow water pathways, using microscale countercurrents, swimming at speeds that minimize energetic costs per unit distance traveled [termed “optimal swim speeds”]; Hinch and Rand 1998, 2000; Standen et al. 2004). With underwater video, Hinch and Rand (2000) determined that adult summer-run Fraser River sockeye salmon swam at optimal speeds when encountered currents were less than 0.25 m s⫺1 and that this resulted in migration speeds ranging from 0.4 to 0.6 m s⫺1. We found that our fish traveled at average migration speeds ranging from 0.33 m s⫺1 (Nechako stock in segment D) to 0.60 m s⫺1 (Quesnel stock in segment B), suggesting that these fish may have been swimming at optimal speeds. In a theoretical sense, the minimization of transport costs can occur across a relatively wide range of swimming speeds; for example, the cost of transport for juvenile sockeye remains within 10% of the absolute minimum between 0.8 and 2.0 body lengths s⫺1 (Hinch et al. 2006). Thus, it is possible for migrants to swim at near-optimal speeds and hence conserve energy yet still exhibit relatively large differences in swimming speeds. We found that fish with low energy densities at the start of the migration traveled the fastest, so the question is what advantage these individuals gain by this behavior, because travel that is too fast could result in energy depletion and migration mortality (Gilhousen 1980; Brett 1995; Hinch and Bratty 2000). Fish with low energy stores may travel at higher speeds in order to minimize transit time and maximize time on the spawning grounds at the cost of the extra energy depleted in transit. We tested this hypothesis by using the 28 individuals that were monitored by all receiving stations and had premigration energy readings. We determined the energy loss incurred by individuals across the migration as they traveled at the migration speeds measured. One assumption we make is that migration speeds can be used as a proxy for swimming speeds, provided that encountered current speeds are relatively slow and generally less than 0.25 m s⫺1 (Hinch and Rand 2000). This assumption is probably reasonable when averaged across the large distances within our river segments. Migration speeds for each study segment (body lengths s⫺1) were converted to oxygen consumption (MO2) by using the formula (MO2 p ⫺54.44 ⫹ 68.85/[1 ⫹ e⫺(U⫺1.58)/0.087)]0.013) from laboratory trials conducted by Lee et al. (2003) for Gates Creek sockeye salmon (another summer-run stock complex from the midreaches of
Table 4: Results of standard least squares regressions on variables selected through forward stepwise multiple regression to determine the physiological correlates of migration speed in three stock complexes of migrating sockeye salmon in the Fraser River, British Columbia, divided by river segment River Segment and Parameter
Probability to Enter
Sequential R2
Parameter Estimate
df
F Ratio
Prob 1 F
A: Stock Mean temperature Mean max temperature Plasma glucose Plasma osmolality Full model
.0578 .0988 .0671 .0303 .1682
.0378 .0657 .0993 .1448 .1628 .1373
⫺.092184 3.6312253 ⫺3.473794 ⫺.067817 ⫺.004845
1 1 1 1 1 5, 107
4.3334 8.5074 7.8878 3.6242 3.7535 4.5658
.0398 .0043 .0059 .0596 .0553 .0008
Mean max temperature Gross somatic energy Plasma K⫹ Full model
.0023 .0919 .1692
.2628 .3305 .3735 .3373
.3096722 ⫺.169514 ⫺.127393
1 1 1 3, 33
15.2211 2.9641 2.2379 7.1085
.0004 .0945 .1442 .0008
Mean max temperature Gross somatic energy Plasma Cl⫺ Plasma K⫹ Full model
.0105 .0117 .0582 .2065
.2262 .4030 .4874 .5225 .4353
.1787688 ⫺.204026 ⫺.015774 ⫺.044298
1 1 1 1 4, 37
10.8641 10.2967 2.8053 .6255 6.9744
.0027 .0034 .1055 .4359 .0005
Gross somatic energy Sex Plasma Na⫹ Full model
.0415 .0273 .2252
.0633 .1336 .1541 .1519
⫺.190205 ⫺.088214 .0036716
1 1 1 3, 74
8.4492 7.1022 .9051 5.8576
.0048 .0094 .3445 .0012
Gross somatic energy Plasma Na⫹ Plasma Cl⫺ Plasma osmolality Full model
.0369 .1168 .2281 .1445
.0695 .1071 .1290 .1607 .0734
⫺.062278 ⫺.002404 .0089775 ⫺.001683
1 1 1 1 4, 70
4.6801 1.4666 3.0576 1.7864 2.4649
.0339 .2300 .0847 .1857 .0528
Gross somatic energy Mean max temperature Plasma Na⫹ Na⫹/K⫹ ATPase Plasma cortisol Plasma Cl⫺ Plasma osmolality Mean temperature Stock complex
.0002 .0497 .0563 .1450 .1595 .2367 .1399 .1100 .2421
.2198 .2721 .3192 .3457 .3699 .3868 .4127 .4422 .4742
⫺.224997 1.4854371 ⫺.008234 ⫺.071124 ⫺.000179 .0279024 ⫺.005435 ⫺1.377406 ⫺.014413 .0641878
1 1 1 1 1 1 1 1 1 1 10, 48
10.3184 3.6821 3.7994 2.8951 2.2023 6.2756 3.9648 3.0366 .1075 2.5654 4.3295
.0024 .0610 .0571 .0953 .1443 .0157 .0522 .0878 .7444 .1158 .0002
⫺.221838 .2298159 ⫺.082065 ⫺.053179 ⫺.066017 ⫺.003721 ⫺.001176
1 1 1 1 1 1 1 7, 65
12.4564 16.3113 4.5383 2.0378 3.3989 3.6623 .1120 6.6874
.0008 .0001 .0369 .1582 .0698 .0601 .7389 !.0001
B:
C:
D:
E:
F:
Full model
.2356
G: Gross somatic energy Mean max temperature Stock Plasma K⫹ Plasma osmolality Plasma osmolality Plasma Na⫹ Full model
.0024 .0037 .0064 .0061 .0887
.1440 .2590 .3794 .4579 .4860
.1142
.5094 .3561
Note. Significant parameters (P ! 0.05) are shown in bold.
Individual Variation in Migrating Salmon Biology 263 the Fraser River watershed) swimming in water at temperatures similar to those in this study (10.9⬚–22.7⬚C). MO2 was then converted to energy loss (J) via the energy equivalent for oxygen consumption for fish using lipids (Qox13.72 J mg⫺1 O2 consumed) from an article by Elliot and Davison (1975). The summation of converted energy equivalents for all river segments represented the amount of energy expended by an individual to swim at the speeds measured in the study for the duration of the migration and was thereby subtracted from the initial energy density in the ocean to determine final energy densities on entrance to subnatal watersheds. We found that the rank order of initial and final energy densities by individual was highly correlated (Fig. 4; Spearman’s r p 0.98; P ! 0.001), while the rank order of initial energy densities (Spearman’s r p ⫺0.10; P p 0.63) and final energy densities (Spearman’s r p ⫺0.25; P p 0.22) was not correlated with the energy lost through swimming activity. On the basis of this analysis, traveling at higher speeds did not mitigate energy loss due to overall length in time of migration for individuals with lower starting energy values. The only benefit for an individual starting with lower initial energy densities would be decreasing time spent in transit and earlier arrival on the spawning grounds. Stock-specific differences in sockeye salmon migration behavior are most likely due to phenotypic differences and associated underlying genotypic variation (Bernatchez and Dodson 1987; Smoker et al. 1998; Stewart et al. 2002; van Noordwijk et al. 2006). In Pacific salmon, it has been repeatedly documented that timing of the initiation of migration by individual stocks is a heritable trait and subject to extreme selective pressure, so that migrants conserve energy and avoid deleterious environmental conditions (Groot and Margolis 1991; Phelps et al. 1994; Hodgson and Quinn 2002; Keefer et al. 2004). Individuals from stocks that migrate long distances are characterized by short and torpedo-shaped bodies, and they typically have fewer or smaller eggs and higher reserve energy than do individuals from stocks that migrate short distances (Bernatchez and Dodson 1987; Crossin et al. 2004). Hinch and Rand (2000) found that individuals from stocks that migrated long distances minimized energy depletion and maximized forward propulsion through a variety of behaviors. In this study, we found that individuals from the stock that traveled the longest distance (Nechako) consistently traveled at speeds slower than those of individuals from the Quesnel or Chilcotin stocks, an observation that could represent behavior by these individuals to minimize energy depletion during transit. We found that males traveled at rates faster than those of females and thus should have reached spawning grounds earlier. Increased time spent on the spawning grounds relative to time spent migrating would allow males to have longer access to females and increased opportunity for reproduction. Because male fitness is largely constrained by the number of females that the individual spawns with, a male should remain on the spawning grounds as long as possible to maximize fitness (Trivers 1972; Gross 1984). The faster travel rates of males will be energetically costly because males undergo large morphological
changes in freshwater that include the development of a dorsal hump and kype (Brett 1965), which increase hydrodynamic drag (Weihs and Webb 1983; Videler 1993). On the other hand, females should adopt behaviors to minimize energy depletion because more energy is required for egg production relative to male milt production (Brett 1965; Gilhousen 1980; Jonsson et al. 1997). Electromyogram telemetry has demonstrated that migrating female Fraser sockeye spend less energy per unit distance traveled compared to males (Hinch and Rand 1998; Hinch et al. 2002; Standen et al. 2002). Among-individual variation in migration speed was repeatable in many segments of the river. Sockeye that traveled fast tended to always travel fast, indicating that there is the possibility of individual phenotypic differences playing a role in individual migration performance. This observation has been made in field studies of migrating sockeye salmon at the reach scale (Hinch and Rand 1998; Hinch et al. 2002) but never at the scale of the entire migration. Laboratory studies have shown that individual swimming performance is repeatable in a number of species (Kolok 1992; Martı´nez et al. 2001; Claireaux et al. 2007). Martı´nez et al. (2001) postulated that the repeatable individual variation in swimming performance of Atlantic cod (Gadus morhua) was partially due to individual genetic predispositions. Swimming performance has been noted as a heritable trait in fish (Nicoletto 1995; Garenc et al. 1998), and whole-organism performance is embedded within individual phenotypic variation in a multitude of traits (Ghalambor et al. 2003; Claireaux et al. 2007). Therefore, repeatability in swimming performance reflects variation in individuals, resulting from selection for various beneficial phenotypic traits in the previous generation (Ghalambor et al. 2003; Claireaux et al. 2007). Our data present one of the first tests of this hypothesis in a field setting over a broad scale and are generally consistent with findings from earlier laboratory studies. Environmental factors and river morphology also played a role in explaining individual variation in migration speeds. In particular, areas of difficult passage, such as Hell’s Gate Canyon, significantly altered migration behavior. Migration speeds of sockeye transiting Hell’s Gate were by far the lowest of any river segment. Previous studies have noted that areas of increasing flow and turbulent currents are impediments to migration movement and are energetically costly to traverse (Hinch and Rand 1998; Standen et al. 2004). Interestingly, the regression analyses of this study that pertained to the transit of Hell’s Gate did not account for much variation in the data. Hinch and Rand (2000) proposed that fish that encounter areas such as this would abandon swimming at optimal speeds in favor of transiting at higher speeds to avoid migration delays. Individual migration performance that was repeatable by individuals throughout the migration ceased to be repeatable when contrasting migration speeds of individuals in adjacent river segments with those of individuals transiting Hell’s Gate. Within Hell’s Gate itself, most fish traveled at similar speeds, with little individual variation, indicating that areas of increased turbulence and flow may be equally difficult for all fish and
264 Hanson, Cooke, Hinch, Crossin, Patterson, English, Donaldson, Shrimpton, Van Der Kraak, and Farrell
Figure 3. Spearman’s r values, denoting correlation of individual sockeye salmon migration speeds in adjacent river segments across the migration. Adjacent river segments with significant amounts of correlation, indicating repeatability of swimming performance, are marked with asterisks. Swimming performance is not repeatable when river segments are compared to the ocean environment or areas of complex and turbulent flow.
may require all migrants to behave similarly in order to successfully transit the area. Once through this area, fish resumed their predictable migration speeds for the remainder of the migration. River temperatures played a role in determining the migration speeds of migrating individuals. From release to Mission, water temperature was negatively correlated with increases in migration speeds, though this result may be confounded by normal migration behavior. River entry is mediated by a complex interplay of environmental and physiological parameters. Sockeye salmon are known to delay river entry and often drift in the estuarine environment until proper in-river flow and temperature regimes are matched (reviewed in Hinch et al. 2006). Also, migrants have been shown to delay river entry to wait for suitable tidal conditions that aid in forward propulsion (Levy and Cadenhead 1995). In the estuarine area, salmon undergo major physiological changes associated with shifts in osmoregulatory and ionoregulatory processes that are required for survival in the riverine environment (Hinch et al. 2006). Further, the transition between freshwater and seawater can impair the swimming ability of individuals in laboratory settings (Brauner et al. 1992). Consequently, the migration speeds of individuals in this portion of the migration may be artificially lowered due to migration delays and milling in the estuarine environment. In the in-river portion of the migration, with the exception of the transit of Hell’s Gate, a positive relationship between average maximum water temperature and migration speed was uncovered. Salmon may swim at faster speeds within the river in order to avoid succumbing to the deleterious effects of inriver water temperatures before being able to spawn. As water temperatures continue to increase above their optimal values (above 16⬚C), salmon show increased levels of stress as well as
increased parasite loads that can cause mortality (Brett 1965; Gilhousen 1990; Macdonald 2000; Macdonald et al. 2000; Wagner et al. 2005). Also, studies have found that the peak aerobic activity of sockeye salmon declined as values approached 20⬚C (Lee et al. 2003; MacNutt et al. 2006). In the in-river portions of the migration presented in this study, average water temperature across all stocks was 18.04⬚ Ⳳ 0.83⬚C, allowing individual fish to travel at higher migration speeds at the peak of aerobic activity. The benefit of traveling at a high rate of speed and avoiding en route mortality due to complications from high water temperature and securing the ability to spawn may outweigh the added energy depleted from faster travel. However, more research into the behavioral thermoregulation of migrating sockeye salmon is required. There is a need to conduct additional analyses that involve sampling fish in the lower river to assess the extent to which physiological conditions are associated with in-river migration performance, particularly with respect to the often challenging environmental conditions encountered en route. As evidenced by this study, the variability of organismal performance and environmental conditions are important factors to consider in the study of migration biology. Animal migrations represent perhaps the most complex interplay between physiology and behavior. This is particularly salient for animals undertaking intrinsically difficult migrations, such as adult sockeye salmon during their migration to natal spawning grounds. This model system has the opportunity to yield additional fascinating insights into animal behavior, physiology, and fitness.
Figure 4. Rank order correlation of individual sockeye salmon initial energy densities (MJ kg⫺1; as measured on ocean approach) and final energy densities (as determined through conversion of migration speeds to energy loss) for the 28 summer-run sockeye salmon that were detected in every study segment of the Fraser River and had initial energy density measurements. Initial and final energy densities are highly correlated (Spearman’s r p 0.98; P ! 0.001).
Individual Variation in Migrating Salmon Biology 265 Acknowledgments All procedures used in this study were developed with approvals and guidance from the Canadian Council on Animal Care, administered by the University of British Columbia and Fisheries and Oceans Canada. We thank Al Cass, Laura Richards, Jim Cave, Jim Woodey, Mike Lapointe, Carmen McConnell, and others from the Pacific Salmon Commission for facilitating this project. Tagging, biopsy, and data management support was provided by Richard Alexander, Jay Sitar, Trisha Watson, Louise Kuchel, Jayme Davidson, Jim Ferguson, Bill Koski, Nathan Blakley, and Cezary Sliwinski. We also thank the skippers and the crews of the Royal Mariner 1 and the Sunfisher. Physiological assays were conducted by Jayme Davidson, Janette Garries, Andrea Lister, and Jeff Young. Funding for the telemetry component of the study was provided by a contract to LGL Limited from Fisheries and Oceans Canada. The biosampling component of the project was funded by a Natural Sciences and Engineering Research Council (NSERC) Strategic Grant, NSERC Discovery Grants, and the Department of Fisheries and Oceans Fraser River Environmental Watch Program. Additional support for writing and analysis was provided by the University of British Columbia and Carleton University. Literature Cited Beacham T.D., R.E. Withler, and C.C. Wood. 1995. Stock identification of sockeye salmon by means of minisatellite DNA variation. N Am J Fish Manag 15:249–265. Bennett A.F., T. Garland Jr., and P.I. Else. 1989. Individual correlation of morphology, muscle mechanics, and locomotion in a salamander. Am J Physiol 256:R1200–R1208. Bennett A.F., R.B. Huey, and H. John-Alder. 1984. Physiological correlates of natural activity and locomotor capacity in two species of lacertid lizards. J Comp Physiol B 154:113–118. Bernatchez L. and J.J. Dodson. 1987. Relationship between bioenergetics and behavior in anadromous fish migrations. Can J Fish Aquat Sci 44:399–407. Block B.A. 2005. Physiological ecology in the 21st century: advancements in biologging science. Integr Comp Biol 45: 305–320. Brauner C.J., J.M. Shrimpton, and D.J. Randall. 1992. The effect of short-duration seawater exposure on plasma ion concentrations and swimming performance in coho salmon (Oncorhynchus kisutch). Can J Fish Aquat Sci 49:2399–2405. Brett J.R. 1965. The relation of size to the rate of oxygen consumption and sustained swimming speed of sockeye salmon (Oncorhynchus nerka). J Fish Res Board Can 22:1491–1501. Brett R. 1995. Energetics. Pp. 1–68 in C. Groot, L. Margolis, and W.C. Clarke, eds. Physiological Ecology of Pacific Salmon. University of British Columbia Press, Vancouver. Carmichael J.T., S.L. Haeseker, and J.E. Hightower. 1998. Spawning migration of telemetered striped bass in the Roanoke River, North Carolina. Trans Am Fish Soc 127:286– 297.
Claireaux G., C. Handelsman, E. Standen, and J.A. Nelson. 2007. Thermal and temporal stability of swimming performance in the European sea bass. Physiol Biochem Zool 80: 186–196. Cooke S.J., G.T. Crossin, D.A. Patterson, K.K. English, S.G. Hinch, J.L. Young, R.F. Alexander, M.C. Healey, G. Van Der Kraak, and A.P. Farrell. 2005. Coupling non-invasive physiological assessments with telemetry to understand interindividual variation in behavior and survivorship of sockeye salmon: development and validation of a technique. J Fish Biol 67:1342–1358. Cooke S.J., S.G. Hinch, G.T. Crossin, D.A. Patterson, K.K. English, M.C. Healey, J.M. Shrimpton, G. Van Der Kraak, and A.P. Farrell. 2006a. Mechanistic basis of individual mortality in Pacific salmon during spawning migrations. Ecology 87: 1575–1586. Cooke S.J., S.G. Hinch, G.T. Crossin, D.A. Patterson, K.K. English, J.M. Shrimpton, G. Van Der Kraak, and A.P. Farrell. 2006b. Physiology of individual late-run Fraser River sockeye salmon (Oncorhynchus nerka) sampled in the ocean correlates with fate during spawning migration. Can J Fish Aquat Sci 63:1469–1480. Cooke S.J., S.G. Hinch, A.P. Farrell, M.F. Lapointe, S.R.M. Jones, J.S. Macdonald, D.A. Patterson, M.C. Healey, and G. Van Der Kraak. 2004a. Abnormal migration and high en route mortality of sockeye salmon in the Fraser River, British Columbia. Fisheries 29:22–33. Cooke S.J., S.G. Hinch, M. Wikelski, R.D. Andrews, L.J. Kuchel, T.G. Wolcott, and P.J. Butler. 2004b. Biotelemetry: a mechanistic approach to ecology. Trends Ecol Evol 19:334–343. Cooke S.J., E.B. Thorstad, and S.G. Hinch. 2004c. Activity and energetics of free-swimming fish: insights from electromyogram telemetry. Fish Fish Ser 5:21–52. Crossin G.T. and S.G. Hinch. 2005. A non-lethal method for assessing the somatic energy content of freely migrating adult Pacific salmon. Trans Am Fish Soc 134:184–191. Crossin G.T., S.G. Hinch, A.P. Farrell, D.A. Higgs, A.G. Lotto, J.D. Oakes, and M.C. Healey. 2004. Energetics and morphology of sockeye salmon: effects of upriver migratory distance and elevation. J Fish Biol 65:788–810. Day R.W. and G.P. Quinn. 1989. Comparisons of treatments after an analysis of variance in ecology. Ecol Monogr 59:433– 463. Dingle H. 1980. Ecology and evolution of migration. Pp. 1– 101 in S.A. Gauthreaux Jr., ed. Animal Migration, Orientation, and Navigation. Academic Press, London. ———. 1996. Migration: the biology of life on the move. Oxford University Press, Cambridge. Dodson J.J. 1997. Fish migration: an evolutionary perspective. Pp. 10–36 in J.-G.J. Godin, ed. Behavioral Ecology of Teleost Fishes. Oxford University Press, Oxford. Elliott J.M. and W. Davison. 1975. Energy equivalents of oxygen consumption in animal energetics. Oecologia 19:195–201. Endler J.A. 1977. Geographical variation, speciation, and clines. Princeton University Press, Princeton, NJ.
266 Hanson, Cooke, Hinch, Crossin, Patterson, English, Donaldson, Shrimpton, Van Der Kraak, and Farrell English K.K., W.R. Koski, C. Sliwinski, A. Blakley, A. Cass, and J.C. Woodey. 2005. Migration timing and river survival of late-run Fraser River sockeye salmon estimated using radiotelemetry techniques. Trans Am Fish Soc 134:1342–1365. Farrell A.P., A.K. Gamperl, and I.K. Britwell. 1998. Prolonged swimming, recovery and repeat swimming performance of mature sockeye salmon Oncorhynchus nerka exposed to moderate hypoxia and pentachlorophenol. J Exp Biol 201:2183– 2193. Garenc C., P. Couture, M.-A. Laflame, and H. Guderley. 1999. Metabolic correlates of burst swimming capacity of juvenile and adult threespine sticklebacks (Gasterosteus aculeatus). J Comp Physiol B 169:113–122. Garenc C., F.G. Silversides, and H. Guderley. 1998. Burst swimming and its enzymatic correlates in the threespine stickleback (Gasterosteus aculeatus): full sib heritabilities. Can J Zool 76:680–688. Garland T., Jr. 1984. Physiological correlates of locomotory performance in a lizard: an allometric approach. Am J Physiol 247:R806–R815. Ghalambor C.K., J.A. Walker, and D.N. Reznick. 2003. Multitrait selection, adaptation, and constraints on the evolution of burst swimming performance. Integr Comp Biol 43:431– 438. Gilhousen P. 1980. Energy Sources and Expenditures in Fraser River Sockeye Salmon during Their Spawning Migration. International Pacific Salmon Fisheries Bulletin 22. New Westminster, British Columbia. ———. 1990. Prespawning Mortalities of Sockeye Salmon in the Fraser River System and Possible Causal Factors. International Pacific Salmon Fisheries Commission Bulletin 26. Vancouver, British Columbia. Goniea T.M., M.L. Keefer, T.C. Bjornn, C.A. Peery, D.H. Bennett, and L.C. Stuehrenberg. 2006. Behavioral thermoregulation and slowed migration by adult fall Chinook salmon in response to high Columbia River water temperatures. Trans Am Fish Soc 135:408–419. Groot C. and L. Margolis, eds. 1991. Pacific Salmon Life Histories. University of British Columbia Press, Vancouver. Gross M.R. 1984. Sunfish, salmon, and the evolution of alternative reproductive strategies and tactics in fishes. Pp. 55– 75 in R. Wootton and G. Potts, eds. Fish Reproduction: Strategies and Tactics. Academic Press, London. High B., C.A. Peery, and D.H. Bennett. 2006. Temporary staging of Columbia River summer steelhead in coolwater areas and its effect on migration rates. Trans Am Fish Soc 135:519– 528. Hinch S.G. and J. Bratty. 2000. Effects of swim speed and activity pattern on success of adult sockeye salmon migration through an area of difficult passage. Trans Am Fish Soc 129: 598–606. Hinch S.G., S.J. Cooke, M.C. Healey, and A.P. Farrell. 2006. Behavioural physiology of fish migrations: salmon as a model approach. Pp. 240–285 in K. Sloman, S. Balshine, and R.
Wilson, eds. Behaviour and Physiology of Fish. Vol. 24. Academic Press, London. Hinch S.G. and P.S. Rand. 1998. Swim speeds and energy use of upriver-migrating sockeye salmon (Oncorhynchus nerka): role of local environment and fish characteristics. Can J Fish Aquat Sci 55:1821–1831. ———. 2000. Optimal swimming speeds and forward-assisted propulsion: energy-conserving behaviors of upriver-migrating adult salmon. Can J Fish Aquat Sci 57:2470–2478. Hinch S.G., E.M. Standen, M.C. Healey, and A.P. Farrell. 2002. Swimming patterns and behavior of upriver migrating adult pink (Oncorhynchus gorbuscha) and sockeye (O. nerka) salmon as assessed by EMG telemetry in the Fraser River, British Columbia, Canada. Hydrobiologia 483:147–160. Hodgson S. and T.P. Quinn. 2002. The timing of adult sockeye salmon migration into freshwater: adaptations by populations to prevailing thermal regimes. Can J Zool 80:542–555. Hogasen H.R. 1998. Physiological changes associated with the diadromous migration of salmonids. Can Spec Publ Fish Aquat Sci 127:1–128. Houston A.H. 1990. Blood and circulation. Pp. 273–334 in C.B. Schreck and P.B. Moyle, eds. Methods for Fish Biology. American Fisheries Society, Bethesda, MD. Jain K.E. and A.P. Farrell. 2003. Influence of seasonal temperature on the repeat swimming performance of rainbow trout Oncorhynchus mykiss. J Exp Biol 206:3569–3579. Johnson E.L., T.S. Clabough, D.H. Bennett, T.C. Bjornn, C.A. Peery, C.C. Caudill, and L.C. Stuehrenberg. 2005. Migration depths of adult spring and summer chinook salmon in the Lower Columbia and Snake rivers in relation to dissolved gas supersaturation. Trans Am Fish Soc 134:1213–1227. Jonsson N., B. Jonsson, and L.P. Hansen. 1997. Changes in proximate composition and estimates of energetic costs during upstream migration and spawning in Atlantic salmon. J Anim Ecol 66:425–436. Keefer M.L., C.A. Peery, W.R. Daigle, M.A. Jepson, S.R. Lee, C.T. Boggs, K.R. Tolotti, and B.J. Burke. 2005. Escapement, harvest, and unknown loss of radio-tagged adult salmonids in the Columbia River–Snake River hydrosystem. Can J Fish Aquat Sci 62:930–949. Keefer M.L., C.A. Peery, M.A. Jepson, K.R. Tolotti, T.C. Bjornn, and L.C. Stuehrenberg. 2004. Stock-specific migration timing of adult spring-summer chinook salmon in the Columbia River basin. N Am J Fish Manag 24:1145–1162. Kolok A.S. 1992. The swimming performance of individual largemouth bass (Micropterus salmoides) is repeatable. J Exp Biol 170:265–270. Kolok A.S. and A.P. Farrell. 1994. Individual variation in the swimming performance and cardiac performance of northern squawfish, Ptychocheilus oregonensis. Physiol Zool 67: 706–722. Lee C.G., A.P. Farrell, A.G. Lotto, M.J. MacNutt, S.G. Hinch, and M.C. Healey. 2003. Effects of temperature on swimming performance and oxygen consumption in adult sockeye (On-
Individual Variation in Migrating Salmon Biology 267 corhynchus nerka) and coho (O. kisutch) salmon stocks. J Exp Biol 206:3239–3251. Levy D.A. and A.D. Cadenhead. 1995. Selective tidal stream transport of adult sockeye salmon (Oncorhynchus nerka) in the Fraser River estuary. Can J Fish Aquat Sci 52:1–12. Macdonald J.S., ed. 2000. Mortality during the Migration of Fraser River Sockeye Salmon (Oncorhynchus nerka): A Study of the Effect of Ocean and River Environmental Conditions in 1997. Can Tech Rep Fish Aquat Sci 2315:1–120. Macdonald J.S., M.G.G. Foreman, A.P. Farrell, T.I.V. Williams, J. Grout, A. Cass, J.C. Woodey, et al. 2000. The Influence of Extreme Water Temperatures on Migrating Fraser River Sockeye Salmon During the 1998 Spawning Season. Can Tech Rep Fish Aquat Sci 2326:1–117. MacNutt M.J., S.G. Hinch, C.G. Lee, J.R. Phibbs, A.G. Lotto, M.C. Healey, and A.P. Farrell. 2006. Temperature effects on swimming performance, energetics, and aerobic capacities of mature adult pink salmon (Oncorhynchus gorbuscha) compared with those of sockeye salmon (Oncorhynchus nerka). Can J Zool 84:88–97. Martı´nez M., H. Guderley, J.A. Nelson, D. Webber, and J.D. Dutil. 2001. Once a fast cod, always a fast cod: maintenance of performance hierarchies despite changing food availability in cod (Gadus morhua). Physiol Biochem Zool 75:90–100. McCormick S.D. 1993. Methods for the nonlethal gill biopsy and measurements of Na⫹,K⫹-ATPase activity. Can J Fish Aquat Sci 50:656–658. McMaster M., K. Munkittrick, and G. Van Der Kraak. 1992. Protocol for measuring circulating levels of gonadal sex steroids in fish. Can Tech Rep Fish Aquat Sci 1836:1–29. Naughton G.P., C.C. Caudill, M.L. Keefer, T.C. Bjornn, L.C. Stuehrenberg, and C.A. Peery. 2005. Late-season mortality during migration of radio-tagged adult sockeye salmon (Oncorhynchus nerka) in the Columbia River. Can J Fish Aquat Sci 62:30–47 Nicoletto P.F. 1995. Offspring quality and female choice in the guppy, Poecilia reticulata. Anim Behav 49:377–387. Northcote T.G. and M.D. Burwash. 1991. Fish and fish habitats of the Fraser River basin. Pp. 117–144 in A.H.J. Dorcey, ed. Water in Sustainable Development: Exploring Our Common Future in the Fraser River Basin. Westwater Research Center, University of British Columbia, Vancouver. Perryman W.L., M.A. Donahue, J.L. Laake, and T.E. Martin. 1999. Diel variation in migration rates of eastern Pacific gray whales measured with thermal imaging sensors. Mar Mamm Sci 15:426–445. Phelps S.R., L.L. Leclair, S. Young, and H.L. Blankenship. 1994. Genetic diversity patterns of chum salmon in the Pacificnorthwest. Can J Fish Aquat Sci 51(suppl.):65–83. Pu¨tz K., R.J. Ingham, J.G. Smith, and B.H. Lu¨thi. 2002. Winter dispersal of rockhopper penguins Eudyptes chrysocome from the Falkland Islands and its implications for conservation. Mar Ecol Prog Ser 240:273–284. Rand P.S., S.G. Hinch, J. Morrison, M.G.G. Foreman, M.J. MacNutt, J.S. Macdonald, M.C. Healey, A.P. Farrell, and D.A.
Higgs. 2006. Effects of changes to river discharge, temperature, and future climates on energetics and mortality of adult migrating Fraser River sockeye salmon. Trans Am Fish Soc 135:655–667. SAS Institute. 2001. JMP. Version 4.0. SAS Institute, Raleigh, NC. Schneider D.W. and T.M. Frost. 1986. Massive upstream migrations by a tropical freshwater neritid snail. Hydrobiologia 137:153–157. Shrimpton J.M., D.A. Patterson, J.G. Richards, S.J. Cooke, P.M. Schulte, S.G. Hinch, and A.P. Farrell. 2005. Ionoregulatory changes in different populations of maturing sockeye salmon Oncorhynchus nerka during ocean and river migration. J Exp Biol 208:4069–4078. Smith L.S. 1966. Blood volume of three salmonids. J Fish Res Board Can 23:1439–1446. Smoker W.W., A.J. Gharrett, and M.S. Stekoll. 1998. Genetic variation of return date in a population of pink salmon: a consequence of fluctuating environment and dispersive selection? Alsk Fish Res Bull 5:46–54. Sorenson P.W. and M.L. Bianchini. 1986. Environmental correlates of the freshwater migration of elvers of the American eel in a Rhode Island brook. Trans Am Fish Soc 115:258– 268. Standen E.M., S.G. Hinch, M.C. Healey, and A.P. Farrell. 2002. Energetic costs of migration through the Fraser River Canyon, British Columbia, in adult pink (Oncorhynchus gorbuscha) and sockeye (Oncorhynchus nerka) salmon as assessed by EMG telemetry. Can J Fish Aquat Sci 59:1809– 1818. Standen E.N., S.G. Hinch, and P.S. Rand. 2004. Influence of river currents on path selection and swimming efficiency of migrating adult sockeye salmon. Can J Fish Aquat Sci 61: 905–912. Stevens E.D. and E.C. Black. 1966. The effect of intermittent exercise on carbohydrate metabolism in rainbow trout, Salmo gairdneri. J Fish Res Board Can 23:471–485. Stewart D.C., G.W. Smith, and A.F. Youngson. 2002. Tributaryspecific variation in timing of return of Atlantic salmon (Salmon salar) to fresh water has a genetic component. Can J Fish Aquat Sci 59:276–281. Tierney K.B. and A.P. Farrell. 2004. The relationships between fish health, metabolic rate, swimming performance and recovery in return-run sockeye salmon, Oncorhynchus nerka (Walbaum). J Fish Dis 27:663–671. Trivers R.L. 1972. Parental investment and sexual selection. Pp. 139–179 in B. Campbell, ed. Sexual Selection and the Descent of Man. Heinemann, London. Ueda H. and K. Yamauchi. 1995. Biochemistry of fish migrating. Pp. 265–279 in P.W. Hochachka and T.P. Mommsen, eds. Environmental and Ecological Biochemistry. Elsevier, Amsterdam. van Noordwijk A.J., F. Pulido, B. Helm, T. Coppack, J. Delingat, H. Dingle, A. Hedenstrom, et al. 2006. A framework for the
268 Hanson, Cooke, Hinch, Crossin, Patterson, English, Donaldson, Shrimpton, Van Der Kraak, and Farrell study of genetic variation in migratory behavior. J Ornithol 147:221–233. Videler J.J. 1993. Fish swimming. Chapman & Hall, London. Wagner G.N., S.G. Hinch, L.J. Kuchel, A. Lotto, S.R.M. Jones, D.A. Patterson, J.S. Macdonald, et al. 2005. Metabolic rates and swimming performance of adult Fraser River sockeye salmon (Oncorhynchus nerka) after a controlled infection with Parvicapsula minibicornis. Can J Fish Aquat Sci 62:2124–2133. Walsberg G.E., M.S. Lean, and S.S. Hillman. 1986. Individual variation in maximum aerobic capacity: cardiovascular and enzymatic correlates in Rana catesbiana. J Exp Zool 239:1–5.
Weihs D. and P.W. Webb. 1983. Optimization of locomotion. Pp. 339–371 in P.W. Webb and D. Weihs, eds. Fish Biomechanics. Praeger, New York. Young J.L., S.G. Hinch, S.J. Cooke, G.T. Crossin, D.A. Patterson, A.P. Farrell, G. Van Der Kraak, et al. 2006. Physiological and energetic correlates of en route mortality for abnormally early migrating adult sockeye salmon (Oncorhynchus nerka) in the Thompson River, British Columbia. Can J Fish Aquat Sci 63:1067–1077. Zar J.H. 1999. Biostatistical Analysis. 4th ed. Prentice-Hall, Englewood Cliffs, NJ.