INSTITUTE OF PHYSICS PUBLISHING
JOURNAL OF OPTICS B: QUANTUM AND SEMICLASSICAL OPTICS
J. Opt. B: Quantum Semiclass. Opt. 6 (2004) S816–S820
PII: S1464-4266(04)72812-8
Improving quantum microscopy and lithography via Raman photon pairs: II. Analysis* Marlan O Scully1,2,3 and C H Raymond Ooi1,3 1
Department of Chemistry, Princeton University, Princeton, NJ 08544-1009, USA Department of Aerospace and Mechanical Engineering, Princeton University, Princeton, NJ 08544-1009, USA 3 Institute for Quantum Studies and Department of Physics, Texas A&M University, College Station, TX 77843-4242, USA 2
Received 1 December 2003, accepted for publication 18 May 2004 Published 27 July 2004 Online at stacks.iop.org/JOptB/6/S816 doi:10.1088/1464-4266/6/8/030
Abstract We show that by using the strongly correlated photon pairs generated in a Raman quantum erasure scheme (Scully M and Dr¨uhl K 1982 Phys. Rev. A 25 2208), it is possible to exceed the Rayleigh resolution limit of classical microscopy. The complete analysis of the underlying physics is given here. Further discussion of the physics and potential applications are presented in a companion paper (Scully M O 2004 Improving quantum microscopy and lithography via Raman photon pairs: I. Biological applications, submitted). Keywords: Raman, quantum microscopy, quantum lithography, second order
correlation (Some figures in this article are in colour only in the electronic version)
In an elegant series of experiments, Lukin and co-workers [1] and Kimble and co-workers [2] have demonstrated strong correlations between photon pairs generated in the double Raman-EIT configuration of figure 1. This represents a new kind of correlated photon state, which is of interest in itself and is likely to find applications in various fields: for example, in stellar astronomy [3], foundations of quantum mechanics [4– 6], subnatural spectroscopy [7], quantum lithography [8, 9] and now in quantum microscopy [10]. The usual source [7, 11] of photon pairs involves two photon down conversion as indicated in the cascade scheme in the inset of figure 2. We find some interesting aspects of the Raman pair correlation which are qualitatively different from those of a cascade emission doublet (CED) state. This is summarized in figure 2, which contains our main results. In the experiments of [1, 2], aspects of pulse propagation and electromagnetically induced transparency [12] are important, and have been treated via a semiclassical analysis. * We dedicate this paper to Professor Hermann Haus: Excellent Scientist,
Engineer and Teacher, a role model for us all.
1464-4266/04/080816+05$30.00 © 2004 IOP Publishing Ltd
In the present work we give a detailed calculations for the Raman two photon quantum state and the two photon correlation function [13] using the fully quantum treatment in the low density (one atom at a time) and small cell limit so the reabsorption and pulse propagation are not important. Furthermore, the present double Raman scheme is exactly the atomic configuration originally used in [14] to demonstrate quantum erasure by scattering light off two atoms. There the ‘write’ pump laser results in the emission of a (Stokes) photon from the atom at A or B. No interference is observed from the Stokes radiation because inspection of the atom could yield which path information. However, application of the second ‘read’ drive laser forces the atom back to the ground state, erasing the which path information. Interference is restored by requiring that both the original Stokes photon and the second eraser photon be detected jointly, thus ensuring that there is no which path information left in the atoms. Thus, this original Raman emission doublet (RED) state is the object of interest.
Printed in the UK
S816
Improving quantum microscopy and lithography via Raman photon pairs: II
Figure 1. (a) The RED (Raman emission doublet) scheme with three level system and double Raman transitions. The first Raman process generates the k photon through non-resonant spontaneous Raman transition from level c to b. This is followed by the emission of the q photon in the resonant Raman process. The joint probability of detecting photons by two detectors (D1 and D2 ) from a single atom is defined as G (2) (1, 2). (b) The joint probability of detecting photons by two detectors (D1 and D2 ) from two atoms (A and B) is defined G (2) (1, 1� ; 2, 2� ).
The full Hamiltonian in the interaction picture for the scheme in figure 1 producing the RED state is � h¯ gk∗ aˆ k |a��b|e−i∆k t Vˆi = h¯ �p |a��c|e−i�t + + h¯ �|a��b| +
�
k
h¯ gq∗ aˆ q |a��c|e−i∆q t + adj.
(1)
q
For large detuning |�| > �p , we make the unitary . � transformation using the operator S(t) = Tˆ iVˆp (t � ) dt � /¯h to . eliminate the pump Hamiltonian Vˆp (t) = h¯ �p |a��c|e−i�t +adj, giving the effective Hamiltonian � � Vˆeff = h¯ G k αp aˆ † |b� �c| ei(∆k −�)t + h¯ gq aˆ q† |c� �a| ei∆q t
(a)
(b)
k
k
+ h¯ �∗ |b��a| +
�
(c)
q �p �∗ † i∆k t h¯ gk aˆ k e |b��a| + h¯ |b��c|e−i�t
� k � �p gq + h¯ (2) aˆ † ei(∆q −�)t (|c��c| − |a��a|) + adj. � q qλ . where G k = gp gk /� is the usual spontaneous Raman coupling frequency (which includes the classical pump field strength . �p = gp αp ), � the Rabi frequency associated with the classical field drives the b ↔ a transition, and gk , gq are the coupling frequencies for photon emissions between levels |a� and |b�, |c�. The last line corresponds to the ac Stark shift due to the coupling between the pump laser and the anti-Stokes photon, which can be eliminated by a unitary transformation. We consider the conditions which enable us to neglect the last two terms in the second line of equation (2). First, we assume the dipole coupling strength for a ↔ c transition is much larger than a ↔ b, i.e. �, gq � gk . So, the radiation coupling term can be neglected. However, we may allow for � � gq . To eliminate the coherent Raman term �p �∗ e−i�t /�, we may not choose the dipole moments for a ←→ c and a ←→ b transitions to be orthogonal because that would also mean G k = 0. However, for large pump detuning, this term averages to zero in a timescale greater than �−1 due to the exponential factor. As the result, equation (2) gives the
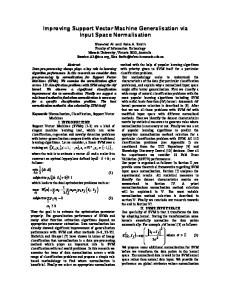
Figure 2. The photon–photon correlation function G (2) (r1 , t1 ; r2 , t2 ) = G(1, 2) for a Raman pair, as given by equation (7), is plotted as a function of the ‘retarded’ time τi = ti − ri /c for i = 1, 2. The three curves correspond to the three characteristic cases (a) � = 3γ (>γ ) (full curve), (b) � = γ /2 (dash-dot curve), and (c) � = 0.2γ (<γ /2) (dashed curve), plotted using equations (18), (19) and (20), respectively. The inset indicates how G(1, 2) depends on τ2 − τ1 in the case of cascade pairs.
Hamiltonian which describes the essential physics of the RED state, � h¯ G k αp aˆ k† |b� �c| ei(∆k −�)t + h¯ � |a� �b| Vˆ = k
+
�
h¯ gq aˆ q† |c� �a| ei∆q t + adj.
(3)
q
The corresponding atom–field state vector now has the simple but exact ansatz � � |�� = C0 |c, 0� + Bk |b, 1k � + Ak |a, 1k � +
�
k
Ckq |c, 1k , 1q �.
k
(4)
k,q
S817
M O Scully and C H Raymond Ooi
We start the atom in level c, and the k, q fields in the vacuum at the initial time. The Raman pump field of figure 1 is assumed to be weak enough and the b → a laser strong enough that when the atom is excited to level b via the emission of a k photon, it quickly makes a transition to level c followed by the emission of a q photon; and then remains in the ground state for a long time so that it makes sense to seek the state of the field at time t = ∞. The RED state for the field is defined as � |�� = Ckq |1k , 1q �. (5) kq
The Glauber two photon correlation function is G (2) (r1 , t1 ; r2 , t2 ) ≡ G (2) (1, 2) = |�(1, 2)|2
(6)
where the two photon probability amplitude is �(1, 2) = �0| Eˆ (+) (r2 , t2 ) Eˆ (+) (r1 , t1 )|��
(7)
in which Eˆ (+) (r1 , t1 ) is the positive frequency (annihilation operator) part of the electric field operator. The spatial coordinates denote the positions of the photon detectors at ri = r1 , r2 and the detection times ti are controlled by, for example, shutters. As is shown below, the two photon probability amplitude �(1, 2) is found to be ˜ 2 − τ1 ) �(1, 2) = K(τ1 , τ2 )e− τ1 (τ1 ) sin �(τ γ
(8) × e− 2 (τ2 −τ1 ) (τ2 − τ1 ) + (1 ↔ 2) � . . ˜ = �2 − γ 2 /4. The distance where τi = ti − ri /c, � between the atom and the i th detector is ri , and K(τ1 , τ2 ) is an uninteresting overall factor, but need not concern us now. The photon–photon correlation function is then given by (9)
For RED pairs, G (2) (1, 2) is very different from the corresponding CED result, as depicted in the inset of figure 2. For example, the correlation at r1 − r2 = 0 vanishes. This is ˜ to understandable since it takes a finite time, governed by �, promote the atom from level b to the level a from which it may decay to c emitting a q photon. Mathematically, the vanishing of G (2) (1, 2) is a result of quantum interference between the two paths. Physical insight into the RED state generation and correlation is provided by considering the same aspects of calculation [15] leading to equation (9). To that end we write the equations of motion for the probability amplitudes appearing in equation (4) as � G ∗k αp∗ e−i(νk −νp +ωbc )t Bk (t), (10a) C˙0 = −i k
B˙k = −iG k αp e−i(νk −νp +ωbc )t C0 (t) − i�∗ Ak (t), � gq∗ e−i(νq −ωac )t Ck,q (t), A˙k = −i�Bk (t) − i
C˙0 = −
�
� |G k |2 |αp |2
t
�
dt � e−i(νk −νp +ωbc )(t−t ) C0 (t � ). (11)
0
k
Proceeding as in the usual Weisskopf–Wigner approximation [15], we find C˙0 = − C0 (12) where = 2π|G(ν0 )|2 |αp |2 D(ν0 ) with D(ν0 ) being the usual density of states and ν0 = νp − ωbc . Several points concerning the spontaneous Raman decay process (equation (12)) should be noted. It is a direct decay process from the ground state c to the excited state b, even for weak fields. This is a direct result of the fact that the detuning, �, from level a is large. If the pump field is tuned close to resonance, a build-up time determined by the effective Rabi frequency for the pump will enter the problem. Furthermore, we ignore decay events which take us back to c, since to lowest order only decay to b will contribute to Ckq . Finally, we note that the spontaneous Raman decay rate can be written in the suggestive form = γab (�2p /�2 ), where we have used the fact that G k = gp gk /�, the pump Rabi frequency is �p = αp gp and the radiation decay rate from a → b, γab � 2π|g(ωac )|2 D(ωac ). We proceed to integrate equation (10d), substitute it into equation (10c) just as in the preceding Raman spontaneous emission (c → b) analysis, and we have the a → c decay described by � −i gq∗ e−i(νq −ωac )t Ck,q (t) = −γ Ak (t). (13a) q
˜ 2 − τ1 ) G (2) (1, 2) = |K|2 e−2 τ1 (τ1 ) sin2 �(τ × e−γ (τ2 −τ1 ) (τ2 − τ1 ) + (1 ↔ 2).
integrate equation (10b) to obtain Bk (t) and insert this into equation (10c) yielding
(10b) (10c)
Hence the equations of motion (10a)–(10d) take the simplified form C˙ 0 = − C0 (t) (13b) B˙ k = −iG k αp e[i(νk −νp +ωbc )t− t/2] − i�∗ Ak (t)
(13c)
A˙ k = −i�Bk (t) − γ Ak (t)
(13d)
C˙ kq = −igk ei(νq −ωac )t Ak (t)
(13e)
where we have used C0 (t) = e− t in order to write equation (10b) in the simpler form (13c). Equations (13b)–(13e) are more interesting than the corresponding coupled equations for the cascade problem; see, for example, equations (6.4.8–10) of [15]. In the case of the three level atom-cascade emission the solutions involve nothing more than simple quadratures. In the present four level, double Raman, problem we derive an equation for Ak (t) by differentiating equation (13d) and using equation (13c) to obtain the driven ‘oscillator’ equation A¨ k + γ A˙ k + |�|2 Ak = −�G k ei(νk −νp −ωbc )t− t ,
(14)
q
˙ = −igq e−i(νq −ωac )t Ak (t). Ck,q
(10d)
First, consider the case when the coupling laser is off; then � = 0 and we may proceed, as in the cascade case: S818
in which the driving term decays in time as exp(− t). Solving equation (14) subject to the initial conditions Ak (0) = 0, and A˙ k (0) = 0 (since A˙ k (0) is given by equation (13d) and Bk (0) = 0), we find Ak (t). Substituting
Improving quantum microscopy and lithography via Raman photon pairs: II
Ak (t) into equation (13e), carrying out the implied integration, and a bit of algebra, yields the result for the two photon state � �G k gq |��RED = � � � ˜ 2 � (ν + ν q k − νp − νd ) + iγ R kq � 1 × ˜ νq − ωac + 12 iγ − � � 1 |1k , 1q �. (15) − ˜ νq − ωac + 1 iγ + � 2
In order to understand the RED state of equation (15) we recall that the CED state is given [15] by �
qak qbq 1 |1k , 1q �. (ν + ν − ω + iγ ) (ν − ω k q ac a q bc + iγb ) kq (16) The corresponding probability amplitude for detection of photons at r1 , t1 and r2 , t2 , i.e. the two photon wavefunction for a cascade emission, is then given by ηc −(iωac +γa )τ1 �(1, 2)CED = e
(τ1 ) r 1r 2 (17) × e−(iωbc +γb )(τ2 −τ1 ) (τ2 − τ1 ) + (1 ↔ 2). |��CED =
Insight into the physics behind the RED state is gleaned by comparing equation (15) with the cascade result, equation (16). Since the RED state equation (15) is just the difference of two states of the form of equation (16), we may write the two photon RED amplitude, by inspection, as the difference of two wavefunctions of the form of equation (17). We find η R � −[i(νp +νd )+ ]τ1 e
(τ1 ) ˜ �r1 r2 × e−[iωac +γ /2](τ2 −τ1 ) (τ2 − τ1 )
�(1, 2)RED = ˜
˜
× (ei�(τ2 −τ1 ) − e−i�(τ2 −τ1 ) ) + (1 ↔ 2),
(18)
˜ is explicitly displayed and where the dependence on � and � η R is an overall factor. Equation (18) is equivalent to equation (8) by grouping of the constants and time dependent factors in equation (18) as K R (τ1 , τ2 ). This is our main result and is plotted in figure 2 for various driving field strengths. It shows a very different result from the corresponding cascade result (photon bunching, as depicted in the inset of figure 2). The sine function gives the vanishing correlation at τ1 − τ2 = 0. Physically, this is ˜ to understandable since it takes a finite time, governed by �, produce the atom in level a from which it may decay to c by emitting a q photon. There is an interesting connection to be made with the photon antibunching work in [16] for example; by Carmichael and Walls, and Walther and co-workers. Their work focused on successive emissions from a two level atom. Here, our result also shows photon antibunching but in Raman pair correlation events. The dependence of the RED correlation function equation (18) on � and γ is interesting. For � > γ /2 the dressed state picture is generally valid. In the case of � = 5γ , a decaying oscillatory behaviour is observed; see figure 2(a). This can be understood as a quantum interference effect, or as a manifestation of Rabi oscillation of the atom between b and a. The states a and b become dressed in the presence ˜ with of a strong driving field �. When (τ2 − τ1 ) = nπ/�
n = 0, 1, 2 . . ., the photon pairs interfere destructively, giving zero correlation. ˜ � 0, the factor When � � γ /2 and therefore � ˜ 2 − τ1 )]/� ˜ ⇒ τ2 − τ1 and �(1, 2) becomes [sin �(τ ˜ K(τ2 , τ1 )e− τ1 (τ1 ) → (τ2 − τ1 )� �(1, 2)��0 ˜ γ
× e− 2 (τ2 −τ1 ) (τ2 − τ1 ) + 1 ↔ 2.
(19)
The oscillations have now disappeared; see curve (b) of figure 2. In the over-damped case of � < γ /2, the Raman pair wavefunction takes the form �(1, 2)�<γ → iK(τ1 , τ2 ) (τ1 )e− τ1 1 ˜ 2 − τ1 ) (τ2 − τ1 ) + 1 ↔ 2 (20) × e− 2 γ (τ2 −τ1 ) sinh R(τ � . γ 2 /4 − |�|2 . In figure 2 we have where R˜ = used equations (18)–(20) to plot the correlation function, equation (6), for a single atom. Finally, we show how the RED amplitude can be used to increase the resolution of microscopy, hence opening up a new possibility for quantum microscopy. Consider two atoms separated by a distance d sufficiently large that dipole–dipole interaction is negligible. The joint detection probability for two atoms (see figure 1(b)) G (2) (r1 , t1 , r1� , t1� ; r2 , t2 , r2� , t2� ) ≡ G (2) (1, 1� ; 2, 2� ) = |�(1, 2) + � � (1� , 2� )|2 can be obtained from equation (18). Let the two detectors be at the same position; so r1 = r2 = r and r1� = r2� = r � . However, if ˜ 1 − τ2 ) term will vanish, we also take t1 = t2 , then the sin �(τ i.e. �RED (r, t; r, t) = 0. Hence, we arrange for a time delay of ˜ between the detection by detector 1 and detector 2 such π/2� ˜ t2� = t1� + π/2� ˜ and t1� = t1 = t. Now, the that t2 = t1 + π/2�, RED amplitudes from the two atoms are respectively
π K = e−[i(νp +νd )+ ](t−r/c) �RED r, t; r, t + ˜ ˜ 2� �
˜
× e−[iωac +γ /2](π/2�) (t − r/c)
π K � � = e−[i(νp +νd )+ ](t−r /c) r � , t; r � , t + �RED ˜ ˜ 2� �
(21)
˜
× e−[iωac +γ /2](π/2�) (t − r � /c). (22) � � � 2 2 Let � r > r , and from r = (d/2) + R + d R sin θ , 2 2 r = (d/2) + R − d R sin θ and sin θ = x/R, where x is the detector location from the normal axis, we find the joint detection probability of the RED scatterers in the far field (r � − r ≈ xd/R) as �
� π � � . � r, t; r, t + G (2) (1, 1 ; 2, 2 ) = � RED � RED ˜ 2�
�2 � π � ˜ � r � , t; r � , t + = C e−2 (t−R/c) e−γ π/2� + �RED ˜ � 2� � � (νp + νd )xd xd × cosh + cos (23) Rc Rc . 2 Equation (23) gives the two photon where C = 8( K ˜ ) . � detection probability as a function of space and time, with . spatial interference period of x1 = 2π Rc/(νp + νd )d. For optical microscopy or lithography, the typical values of x ∼ 10 µm, d ∼ 100 µm, R ∼ 1 cm, νp ∼ νd ∼ 1015 s−1 S819
M O Scully and C H Raymond Ooi
and ∼ 105 s−1 give xd/Rc � 1, so it is an excellent approximation to write equation (23) as � � (νp + νd )xd ˜ (2) � � −2 (t−R/c) −γ π/2� . 1+ cos e G RED (1,1 ;2, 2 ) = C e Rc (24) Thus, the interference pattern from the RED source (ν +ν )xd (∼ cos2 p 2Rcd ) oscillates about twice as rapidly as the usual νxd ). Young’s double slit (∼ cos2 2Rc The Rayleigh criterion inferred from equation (24) is
1 λeff 2πc 1 (25) � + = 1/dr θRRED = 1.22 dr dr (νp + νd ) λp λd where dr is the minimum distance between the two sources that can be resolved. The angular resolution here is determined not by a single wavelength but by an effective wavelength λeff < λp , λd , depending on both the pump and drive wavelengths. For λp � λd , the resolution θRayleigh is one half of that from a conventional source. That means, we may have ‘UV’ resolution using entangled optical photons. In conventional microscopy and lithography, the resolution is limited by θR = 1.22λ/dr , where λ is the wavelength of the light source. But now, the RED source provides us with a much smaller effective wavelength, corresponding to a resolution beyond Rayleigh θRRED < θR via the quantum nature of entangled photons. As we have seen, the RED wavefunction, generated by a single atom, is of interest in itself. In particular, the photon antibunching property shows its correspondence to that of resonance fluorescence. Another interesting feature is that the magnitude of the joint detection probability can be controlled ˜ by the driving field through the factor e−γ π/2� in equation (24). Moreover, the many atom extension has further fascinating features. For example, in the many atom experiments of [1] and [2], the anti-Stokes photons would be absorbed but for EIT. The coherent driving field � ‘protects’ the emitted anti-Stokes (CARS) photons from being absorbed.
Acknowledgments The authors wish to thank AFOSR (Rome), DARPA-QuIST, ONR and the Welch Foundation for support.
S820
References [1] van der Wal C H, Eisaman M D, Andre A, Walsworth R L, Philips D F, Zibrov A S and Lukin M D 2003 Science 301 196 [2] Kuzmich A, Bowen W P, Boozer A D, Boca A, Chou C W, Duan L M and Kimble H J 2003 Nature 423 731 [3] Hanbury-Brown H and Twiss R Q 1954 Phil. Mag. 45 663 [4] Ou Y and Mandel L 1988 Violation of Bell’s inequality and classical probability in a two-photon correlation experiment Phys. Rev. Lett. 61 50 [5] Shih Y H and Alley C O 1988 New type of EPRB experiment using pairs of light quanta produced by optical parametric down conversion Phys. Rev. Lett. 61 2921 [6] Franson J D 1989 Bell’s inequality for position and time Phys. Rev. Lett. 62 2205 [7] Rathe U and Scully M 1995 Theoretical basis for a new subnatural spectroscopy via correlation interferometry Lett. Math. Phys. 34 297 Scully M O, Rathe U W, Su C and Agarwal G S 1997 On enhancing spectral resolution via correlated spontaneous emission Opt. Commun. 136 39 [8] Boto A N, Kok P, Abrams D S, Braunstein S L, Williams C P and Dowling J P 2000 Quantum interferometric optical lithography: exploiting entanglement to beat diffraction limit Phys. Rev. Lett. 85 2733 [9] D’Angelo M, Chekhova M V and Shih Y 2001 Two photon diffraction and quantum lithography Phys. Rev. Lett. 87 013602 [10] Scully M O 2004 Improving quantum microscopy and lithography via Raman photon pairs: I. Biological applications, submitted [11] Kimble H J and Mezzacappa A 1985 Time dependence of photon correlations in a three-level atomic cascade Phys. Rev. A 31 3686 [12] Harris S 1997 Electromagnetically induced transparency Phys. Today 50 36 [13] Glauber R J 1963 Phys. Rev. 130 2529 Glauber R 1965 Quantum Optics and Electronics (Les Houches) ed C Dewitt, A Blandin and C Cohen-Tannoudji (New York: Gordon and Breach) [14] Scully M and Dr¨uhl K 1982 Quantum eraser: a proposed photon correlation experiment concerning observation and ‘delayed choice’ in quantum mechanics Phys. Rev. A 25 2208 [15] Scully M O and Zubairy S 1997 Quantum Optics (Cambridge: Cambridge University Press) [16] Carmichael H J and Walls D F 1976 A quantum-mechanical master equation treatment of the dynamical Stark effect J. Phys. B: At. Mol. Phys. 9 1199 Cresser J, H¨ager J, Leuchs G, Rateike M and Walther H 1982 Topics in Current Physics vol 27 p 21