Hypothetical Thinking and Information Extraction in the Laboratory By Ignacio Esponda and Emanuel Vespa∗ In several common-value environments (e.g., auctions or elections), players should make informational inferences from opponents’ strategies under certain hypothetical events (e.g., winning the auction or being pivotal). We design a voting experiment that identifies whether subjects make these inferences and distinguishes between hypothetical thinking and information extraction. Depending on feedback, between 50 and 80 percent of subjects behave nonoptimally. More importantly, these mistakes are driven by difficulty in extracting information from hypothetical, but not from actual, events. Mistakes are robust to experience and hints, and also arise in more general settings where players have no private information. JEL: D72, D81, D82 There is a long tradition in psychology and economics that addresses the limits of human cognition and how these limits affect economic decisions. One strand of the literature documents individuals’ inability to make correct statistical inferences in uncertain environments, such as overestimation of small probabilities, representativeness bias, base-rate neglect, etc. (e.g., Daniel Kahneman and Amos Tversky (2000)). Another strand suggests that individuals make mistakes in strategic situations either because they have not had enough time to learn the strategies used by other players or because they do not have enough information to learn these strategies (e.g., Drew Fudenberg and David K. Levine (1993)); however, people seem to eventually learn when given enough time and information (e.g., Pedro Dal Bo and Guillaume R Fr´echette (2011)). Finally, the literature on behavioral game theory shows that people often fail to grasp the complexity of their strategic interactions (e.g., Colin F. Camerer, Teck-Hua Ho and Juin-Kuan Chong (2004)). An important question is whether people’s failure to deal with strategic situations is driven by the statistical inference or learning problems highlighted by previous literatures or whether there is something inherently difficult about ∗ Esponda: New York University, Stern School of Business, 44 W Fourth Street KMC 7-76, New York, NY 10012,
[email protected]. Vespa: Department of Economics, University of California at Santa Barbara, 2127 North Hall University of California Santa Barbara, CA 93106,
[email protected]. Research support from the Center for Experimental Social Science (CESS) at NYU is gratefully acknowledged. We thank Marina Agranov, Katherine Baldiga, Ryan Booth, Alessandra Casella, Stephen Coate, Pedro Dal B´ o, Kfir Eliaz, Erik Eyster, Guillaume Fr´ echette, Jens Grosser, Philippe Jehiel, Navin Kartik, Alessandro Lizzeri, Rebecca Morton, Thomas Palfrey, Andrew Schotter, Isabel Trevino, Matan Tsur, Sergio Vicente, Larry White, Alistair Wilson, Jonathan Woon, Sevgi Yuksel, and several seminar participants for helpful comments, and Qingyuan Gao for research assistance.
1
2
AMERICAN ECONOMIC JOURNAL
MONTH YEAR
strategic interactions that these previous literatures have not addressed. We focus on a strategic environment where players need to extract information from the strategies of other players. The most studied example is a common-value auction environment, where a large literature has found that bidders fail to bid optimally (e.g., Richard H. Thaler (1988), John H. Kagel and Dan Levin (2002)). The explanation is that bidders fail to anticipate that winning the auction conveys (bad) news about the value of the object, simply because the losing bidders were reluctant to bid as high. In other words, bidders should estimate the value of the object conditional on the hypothetical event that their bid wins the auction. This type of strategic thinking, however, is potentially present in any environment where people make decisions based on private information that is relevant to other people; a recent bounded rationality literature has offered different ways to model the mistake (e.g., Philippe Jehiel (2005), Erik Eyster and Matthew Rabin (2005), Vincent P. Crawford and Nagore Iriberri (2007), Philippe Jehiel and Fr´ed´eric Koessler (2008), Ignacio Esponda (2008)).1 We conduct experiments in a voting environment with two alternatives and private information. This is yet another environment where players must engage in information extraction, and this type of behavior is known as strategic or pivotal voting: A strategic voter votes for the alternative that is best conditional on both her private information and the information that she infers, given her beliefs about the equilibrium strategies of others, from the hypothetical event that her vote is pivotal.2 We choose this environment because it offers us a particularly clean way to identify whether people make mistakes and to identify the causes in the laboratory. We make two main contributions to the literature. First, our experimental design controls for mistakes resulting from statistical computations or difficulties in learning the behavior of others. We do so by casting the voting game as a decision problem and having each subject play against computers. Our subjects know the rules followed by the computers. Moreover, it is a trivial statistical exercise to infer information from these rules, provided that the subject is sophisticated enough to focus on the relevant (pivotal) event. Second, we take a closer look at the reason why some subjects fail to be strategic. We make a conceptual distinction between information extraction and hypothetical thinking. One thing is whether subjects are able to extract information about the right alternative when they are told that the computers voted in a way that makes their vote pivotal. Another thing is whether they are also able to engage in hypothetical thinking: to realize that, even if they have no information about the votes of the computers, they must still make inferences under the hypothetical case that their vote is pivotal. Our experiment is designed to distinguish between these two cases by having a treatment where voting is simultaneous and another 1 See John H. Kagel and Dan Levin (1986) and Charles A Holt and Roger Sherman (1994) for early formal analyses in the context of auctions. 2 Because ‘pivotal’ voting is a shortcut that voters may (but need not) take in order to vote optimally (see Section I), we use the more general term ‘strategic’ to describe sophisticated subjects.
VOL. VOL NO. ISSUE
HYPOTHETICAL THINKING AND INFORMATION EXTRACTION
3
where voting is sequential. We find that a substantial number of subjects (78 percent) are non-strategic even after playing variations of the simultaneous-voting treatment for several rounds. However, in the sequential-voting treatment, only 24 percent of subjects are unable to extract information when they are told the realized votes of the computers. Moreover, we then ask the subjects who participated in the sequential voting treatment to participate in the simultaneous-voting version of the experiment and strikingly, we find that 78 percent of them vote non-strategically. Therefore, our data suggests that the mistake is mainly driven not from failure to make inferences from others’ actions per se, but rather from failure to make inferences from hypothetical events. Thus, we identify a type of cognitive limitation that is relevant in many strategic settings where people must think hypothetically. The mistake of failing to extract information from hypothetical events is fairly robust to experience, feedback, and hints about pivotality. We do find, however, that feedback has a significant role on strategic behavior: the percentage of nonstrategic subjects falls from 78 to 50 percent when we provide detailed outcome feedback after each round of play. This result highlights a new role of feedback (helping subjects to engage in hypothetical thinking) that is different from the standard role of helping subjects learn the primitives or the strategies of other players. In addition, we find that not all non-strategic behavior can be explained by the standard notion of sincere voting. This last finding (also obtained by Gary Charness and Dan Levin (2009) for the acquiring-a-company setup) suggests that other models of naivet´e should be considered when testing for non-strategic behavior. Finally, we expand the scope of the cognitive mistake identified in this paper by showing that, despite the emphasis of the literature on common value environments, the failure to think hypothetically is also relevant and present in private value environments. Kagel and Levin (1986), John H. Kagel, Ronald M. Harstad and Dan Levin (1987), and Dan Levin, John H. Kagel and Jean-Francois Richard (1996) report overbidding in common-value auctions, implying that bidders fall prey to the winner’s curse and providing indirect evidence for the type of mistake studied in this paper–see Kagel and Levin (2002) for a survey. More recently, Charness and Levin (2009) provide direct evidence for the mistake. They ingeniously transform a trading game into a decision problem that retains the adverse selection problem but strips the environment of strategic uncertainty. However, the nature of their environment implies that subjects must engage in non-trivial computations of expected profits and conditional expectations. To mitigate this concern, Charness and Levin (2009) study a simpler version of their experiment, where subjects essentially choose one of two prices. In this simpler version, one cannot distinguish between subjects making correct or naive inferences about value because both types choose the same low price. Charness and Levin (2009) find that about half of the subjects “overbid” by choosing the high price, therefore providing a lower bound for the number of people making the mistake and highlighting
4
AMERICAN ECONOMIC JOURNAL
MONTH YEAR
that overbidding cannot solely be explained by naive inferences. One obvious difference with our paper is that we focus on a voting context. This context has the advantage that we can cleanly identify whether subjects make the mistake without having to run additional lotteries to assess the subjects’ level of risk aversion.3 More importantly, we are the first to conceptually distinguish and test between hypothetical thinking and information extraction in order to get a better sense of where the mistake identified by Charness and Levin and others is coming from.4 At a more general level, Colin Camerer and Dan Lovallo (1999) relate the winner’s curse to overconfidence and excess entry, Camerer, Ho and Chong (2004) propose a model where people neglect the strategic complexity of the relevant environment and test it for several classes of related games, and Steffen Huck, Philippe Jehiel and Tom Rutter (2011) show that subjects in a game best respond to the aggregate play of their opponent over various games, as in Jehiel’s (2005) analogy-based expectation equilibrium.5 None of these papers focus on the distinction between hypothetical thinking and information extraction. There is also a large literature on strategic voting in common value settings. The focus of this literature is to test whether Nash equilibrium does a reasonable job of explaining the data. Serena Guarnaschelli, Richard D. McKelvey and Thomas R. Palfrey (2000), S. Nageeb. Ali, Jacob K. Goeree, Navin Kartik and Thomas R. Palfrey (2008), and Marco Battaglini, Rebecca B. Morton and Thomas R. Palfrey (2008), (2010) test experimental versions of the jury voting model (Timonthy J. Feddersen and Wolfgang Pesendorfer (1996), (1998)).6 They find that voters often vote against their private information and that uninformed voters often abstain, two features which support the assumption of strategic voting over the assumption of sincere voting. These findings, however, are often noisy, and the noise is often rationalized by random mistakes. In contrast, Eyster and Rabin (2005) find that the errors can be systematically explained by a model of boundedly-rational voting. In addition, the testing of Nash equilibrium against sincere voting might overstate the importance of the former, since a subject who votes against her signal is automatically categorized as understanding the pivotal logic, when there are in fact other reasons why she might vote against her signal. For example, Rebecca B. Morton and Jean-Robert Tyran (2011) argue that delegation (to more 3 Another benefit of our experiment is that, in more general voting settings, the comparison between the relevant lotteries would be complicated by other factors, such as failure of the independence axiom (see Kfir Eliaz, Debraj Ray and Ronny Razin (2006)) or risk preferences. 4 Asen Ivanov, Dan Levin and Muriel Niederle (2010) provide additional evidence that subjects overbid despite bidding against their own (known) past strategies. However, their design is not intended to disentangle between information extraction and hypothetical thinking. 5 For another private information environment in which subjects fail to fully extract information from others’ actions, see Emanuel Vespa and Alistair J. Wilson (2013). 6 The literature on voting in common value environments has expanded beyond the standard jury voting setting, e.g., Ernst Maug and Bilge Yilmaz (2002), Doron Levit and Nadya Malenko (2011), and Laurent Bouton, Micael Castanheira and Aniol Llorente-Saguer (2013). In the context of shareholder voting, Ernst Maug and Kristian Rydqvist (2009) show that strategic voting provides a better fit of the empirical data compared to sincere voting.
VOL. VOL NO. ISSUE
HYPOTHETICAL THINKING AND INFORMATION EXTRACTION
5
informed voters) is likely to be a voting norm rather than the result of pivotal calculations. Similarly, when voting is by unanimity rule, then voting against one’s signal might be a way to avoid affecting the ultimate decision, rather than a manifestation of strategic voting. The focus of our paper is very different from the focus of this previous literature on voting. We are not trying to evaluate whether an “as if” strategic voting model explains aggregate behavior better than some other model, such as sincere voting. Instead, our objective is to understand whether individual people are able to engage in the strategic voting logic or not. In particular, we must control for several aspects of the game (strategic uncertainty and computational requirements) that the voting literature does not control for. Moreover, the type of logic that we test is more broadly applicable to general settings with imperfect information (and, as we test in Section III.C, even applies in environments with private values). Finally, it is important to clarify that the word “strategic” is applied to voting games in other ways that are very different from our application. For example, voters are said to be strategic either when they optimally decide whether to turn out to vote given their chance of affecting the outcome (e.g., John O. Ledyard (1981)), or when they vote for a candidate who is not their first choice but who has a chance of winning in an election with more than two candidates (e.g., David P. Myatt (2007)), or when they anticipate others’ votes in the presence of peer effects. All of these other forms of strategic voting have received experimental and empirical support (e.g, David K. Levine and Thomas R. Palfrey (2007), Catherine Eckel and Charles Holt (1989), Kei Kawai and Yasutora Watanabe (forthcoming), Gregor Matvos and Michael Ostrovsky (2010)) and are, arguably, cognitively less demanding than the task of hypothetical thinking and information extraction considered in this paper. I.
Main voting problems
At the center of our main experimental design is the following setup. There is a 10-ball jar with p red balls and 10 − p blue balls, where p ∈ {1, ..., 9}. One ball is randomly selected and becomes the selected ball. The subject must cast a vote for either Red or Blue without observing the color of the selected ball. In addition, two computers observe the color of the selected ball and are programmed to follow specific rules for casting a vote in favor of Red or Blue that are contingent on the color of the selected ball. If the color chosen by a simple majority matches the color of the selected ball, the subject’s payoff is $2; otherwise, the payoff is $0. Before casting her vote, the subject receives information about the rule being followed by the computers and the number of red and blue balls in the jar. We conduct two main treatments. Simultaneous Voting Treatment: Before casting her vote, the subject does not receive information about the actual votes of the computers.
6
AMERICAN ECONOMIC JOURNAL
MONTH YEAR
Sequential Voting Treatment: Before casting her vote, the subject does receive information about the actual votes of the computers. We restrict attention to the case where both computers follow the same rule (but randomizations are independent). The rule is indexed by q ∈ {.1, .25, .5, .75, .9} and takes the following form: (1)
If selected ball is red: vote Red; If selected ball is blue: vote Blue with probability q and Red with 1 − q.
Table 1 shows the state-space representation for the problem faces by subjects in the Simultaneous Voting Treatment. Each row corresponds to one of the six different states of the world.7 Each state describes the color of the selected ball and the votes of the computers.8 For each state, Table 1 describes the probability of the state and the payoffs that the subject would get if she were to vote Red or Blue. A sophisticated subject who knows the composition of the jar (p) and the strategies of the computers (q) should be able to deduce the probability of each state. In particular, the second and third states have zero probability because both computers vote Red when the selected ball is red. Thus, the payoffs for these states are irrelevant and a comparison of the remaining payoffs reveals that the optimal strategy is to vote Blue. In other words, if the selected ball is red, then both computers will vote Red and the payoff will be $2 irrespective of the subject’s vote. But if the selected ball is blue, then the subject can influence the outcome, and it is optimal to vote Blue. Equivalently, the vote of a subject can only affect the outcome if the selected ball is blue (i.e., conditional on being pivotal, the selected ball must be blue), and, therefore, it is optimal to vote Blue.9 In particular, a strategic subject must ignore her private information (i.e., the number of red balls in the jar), a result that is typical of voting games with private information (e.g., Timothy J. Feddersen and Wolfgang Pesendorfer (1997)). Two features of the setup allow us to isolate whether voters are strategic from whether voters have incorrect beliefs about others’ strategies or make computational mistakes. First, subjects have no uncertainty about the primitives of the game (i.e., the composition of the jar) or about the strategies of the computers. 7 For simplicity, states (2) and (5) aggregate the cases where either the first computer votes Red and the second Blue or vice versa. 8 In applications, the state of the world is often considered to include only the color of the selected ball, but, as shown by the Private Values Treatment in Section III.C, this narrow reading of the state space obscures the generality of the mistake studied in this paper. 9 The last argument, known as pivotal voting, is the standard explanation in the literature, and follows from the fact that the difference in expected utility from voting Red versus Blue is given by the probability of being pivotal (which is positive) times the expected difference in payoff from voting Red versus Blue conditional on being pivotal. However, as shown by the initial argument, there are other, equivalent ways to extract information. Our experiment does not seek to distinguish which of these equivalent arguments are followed by a sophisticated subject, which is why we generically refer to this behavior as being strategic rather than pivotal.
VOL. VOL NO. ISSUE
HYPOTHETICAL THINKING AND INFORMATION EXTRACTION
7
Table 1—State-space representation for the voting problems. State
Subject’s Payoff
Selected Ball
Computers’ Votes
Probability
Vote R
Vote B
(1)
red
Red/Red
p/10
2
2
(2)
red
Red/Blue
0
2
0
(3)
red
Blue/Blue
0
0
0
(4)
blue
Red/Red
(1 − p/10) × (1 − q)2
0
0
(5)
blue
Red/Blue
(1 − p/10) × 2q(1 − q)
0
2
(6)
blue
Blue/Blue
(1 − p/10) × q 2
2
2
Second, the rules followed by the computers make it unnecessary for strategic subjects to engage in non-trivial Bayesian updating computations or, more generally, to compare the probabilities of each of the states (beyond knowing that some are positive and some are zero). The Sequential Voting Treatment is identical to the Simultaneous Voting Treatment, except that the subject now learns the realized votes of the computers before having to cast her vote. If the realized votes are {RR} or {BB}, then the subject cannot affect the outcome and is therefore indifferent between voting for Red or Blue. In these cases, we cannot infer much from the subject’s behavior. If the realized votes are {RB}, however, then a sophisticated subject learns that either the second or fifth states in Table 1 have been realized, and, from knowledge of the computers’ strategies, infers that the fifth state was realized and, therefore, votes Blue. In words, a sophisticated subject votes Blue because she infers that computers can vote differently only if the selected ball is blue. The difference with the Simultaneous Voting Treatment is that the subject no longer needs to make inferences from all hypothetical states, but she can now simply focus on the event that computers vote differently. II.
Experimental design and results
In this section, we discuss the experimental design and results for the Simultaneous and Sequential Voting Treatments. Each subject participated in only one of these treatments: 60 subjects in the first treatment and 58 subjects in the second treatment. Information about the participants and the incentives they faced are provided in the Appendix. The instructions are provided in the Online Appendix. A.
Simultaneous Voting Treatment
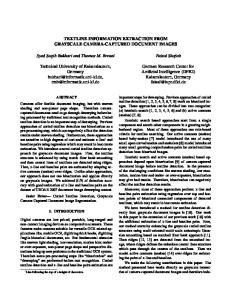
The Simultaneous Voting Treatment consists of three parts. In Part 1, we vary the jar composition and the voting rule, (p, q), over the values p ∈ {1, ..., 9} and q ∈ {.1, .25, .5, .75, .9}, for a total of 9 × 5 = 45 rounds. A screenshot of the
8
AMERICAN ECONOMIC JOURNAL
MONTH YEAR
interface displaying the case {p = 6, q = 0.9} is presented in Figure 1.10 The order in which subjects go through these 45 rounds is selected randomly for each subject. In addition, for values of q ∈ {.1, .75}, we inverted the computers’ voting rules: “If the selected ball is red, vote Red with probability q and Blue with probability 1 − q; If the selected ball is blue, vote Blue.” In such cases, the roles of Blue and Red are interchanged and the optimal strategy is to vote for Red. For simplicity in the exposition, we adopt the convention that every round (p, q) is associated with the voting rule described above in (1), where it is optimal to vote for Blue.11
Figure 1. Screen shot for the experiment.
There are several reasons why we wanted to have variation by inverting the computers’ voting rules and changing the parameters (p, q), where p captures private information and q captures strategic behavior of other voters. First, previous voting experiments do have variation in private information, here captured by p, and one of the questions these experiments ask is whether people respond “sincerely” to this information or vote against it. Moreover, having variation in p but not in q might asymmetrically bias some subjects to correlate their vote with one type of information but not with another. Variation in (p, q) allows us to identify to what extent voters respond to either source of information or both, 10 We
conducted the experiment with z-Tree; see Urs Fischbacher (2007). example, a round with p0 = 3 red balls and the inverted computer rules with q 0 = .75 will appear in the text as round (p, q) = (7, .75) under computers’ voting rule (1). 11 For
VOL. VOL NO. ISSUE
HYPOTHETICAL THINKING AND INFORMATION EXTRACTION
9
and we exploit this variation in Section 1.1 of the Online Appendix to explore the behavior of non-strategic voters. Second, without variation, we would not be able to distinguish a strategic voter from someone who has some strange reason for always voting Blue (e.g., Blue is her favorite color). Finally, for robustness purposes, in Section 1.2 of the Online Appendix, we conduct the same experiment without any of the above variations and find very similar results. In Part 2 of the experiment, each subject is given incentives to provide written advice to another subject regarding how to vote in each of two different situations: round 46 is p = 7, q = .9 and round 47 is p = 3, q = .1.12 We used the written advice task both to encourage further reflection about the problem and to confirm our classification of strategic behavior. Finally, Part 3 of the experiment is divided intro three short stages: a, b, and c. At the beginning of the first two stages, we ask each subject a question that provides a hint of the notion of pivotality. Question 3a below is asked at the first stage and question 3b below is asked at the second stage. For both questions, subjects are told that each computer follows the strategy in (1) with q = .5.13 Question 3a: What is the probability that the selected ball is blue if one computer votes Red and the other computer votes Blue? Question 3b: Suppose that the selected ball is red. Can your vote change the color chosen by the majority? At the beginning of stage 3c, subjects are presented on the screen with an explanation (see the Online Appendix) of why voting for Blue is optimal when computers follow the rule in (1). In each of the 3 stages of Part 3, the question or explanation is followed by four additional rounds of the voting problem, where (p, q) ∈ {(8, .5), (8, .75), (8, .25), (2, .5)}. Hence, subjects play the voting game for a total of 12 other rounds, in addition to the 47 rounds of Parts 1 and 2.14 Subjects receive no feedback about the outcome of each round until the end of the experiment.15 Simultaneous Voting Results: Figure 2 depicts four typical patterns of behavior for Part 1 of the Simultaneous Voting Treatment. For each subject, the figure plots the vote for each of the first 45 (p, q) rounds, where p is plotted on the x-axis and q on the y-axis. A triangle indicates that the subject voted Blue, while a cross indicates that she voted Red. The number displayed to the right of the triangle or cross indicates the round number in which the subject encountered 12 For all treatments in this paper, written feedback is incentivized as follows (see the instructions for details). At the end of the experiment, four subjects are randomly selected and their identities not revealed. One subject, called the advisee, is given the advice of the 3 other subjects. The advisee is asked to choose the best advice and to play the additional rounds for which she received advice. Both the advisee and the subject whose advice she selected earn the payoffs from these extra rounds played by the advisee. 13 We tell them nothing about the number of red balls, since this information is not needed to answer the questions. 14 The 20 subjects in the first session that we run did not face the fourth round, (p, q) = (2, .5), hence playing a total of 9 other rounds. 15 To study the effect of feedback we also conducted a Simultaneous Voting Treatment with Feedback, which we discuss in Section III.A.
10
AMERICAN ECONOMIC JOURNAL
MONTH YEAR
11
26
1
42
10
44
32
33
29
.5
27
25
28
6
14
24
31
2
4
30
7
38
36
17
16
21
8
37
34
19
9
23
45
20
22
39
18
1
2
3 4 5 6 7 8 Number of red balls (p)
9
.75 .9
8
22
36
30
6
7
15
9
25
26
32
5
14
39
19
40
42
.5
Subject 35 16
21
10
35
38
37
18
29
4
44
31
11
23
45
24
13
43
17
33
28
20
1
27
41
3
2
34
12
1
2
3 4 5 6 7 8 Number of red balls (p)
9
Subject 46 .75 .9
43
3
7
24
30
19
35
17
38
16
33
42
36
21
4
20
9
10
15
.5
13
8
14
23
25
2
27
13
37
39
.1 .25
3
Prob. of no computer mistake when blue ball selected (q)
41
32
6
5
41
1
22
43
26
29
18
11
34
31
45
44
28
40
1
2
3 4 5 6 7 8 Number of red balls (p)
12
9
Subject 58 .75 .9
5
39
16
17
14
6
27
5
19
24
43
41
30
34
9
36
4
42
10
.5
35
25
35
37
21
20
29
15
7
3
.1 .25
15
Prob. of no computer mistake when blue ball selected (q)
.75 .9
12
.1 .25
Subject 24 40
.1 .25
Prob. of no computer mistake when blue ball selected (q)
Prob. of no computer mistake when blue ball selected (q)
such (p, q) pair.
11
2
13
38
8
26
44
18
45
23
22
33
28
12
31
40
1
1
2
3 4 5 6 7 8 Number of red balls (p)
32
9
Figure 2. Simultaneous Voting Treatment: Representative types in the population. Note: A triangle represents a vote for Blue, a cross a vote for Red. The accompanying number denotes the round.
Subject 24 always votes Blue and is therefore strategic from the first round. Subject 46 votes Blue in all rounds after round 16; so we will say that subject 46 becomes strategic at t = 17. Subjects 35 and 58 are not strategic. All of subject 35’s votes are “sincere”, in the sense that this subject votes for the color that has the majority of balls in the urn. On the other hand, subject 58 is responding both to p and q in a way that puts his or her behavior even further from strategic behavior. In what follows, we focus on our main objective, which is to separate subjects into those that are strategic and those that are not. We defer the analysis of the types of non-strategic behavior we encounter to Section 1.1 of the Online Appendix.16 As shown below, the experimental design makes it easy to classify subjects as strategic vs. non-strategic because strategic subjects make essentially no mistakes (once they become strategic). In particular, we do not need to rely on a noisy statistical model to classify subjects within a treatment. Of course, 16 We find evidence of both sincere voting and a type of comforming behavior also found by Jacob K. Goeree and Leeat Yariv (2007) in a different context.
VOL. VOL NO. ISSUE HYPOTHETICAL THINKING AND INFORMATION EXTRACTION 11
we do account for sample randomness when testing whether strategic behavior differs across treatments.17 As illustrated by Subject 46 in Figure 2, we must account for the fact that subjects may become strategic only after several rounds of play. In addition, we must account for the fact that even strategic subjects may occasionally make a mistake and vote non-optimally. DEFINITION 1: A subject becomes z-strategic at round t in Part 1 if t is the first round in which her vote is optimal (i.e. Blue) in round t as well as in z percent of the cases from round t until round 45.18 A subject is strategic in Part 2 if her vote is optimal in both rounds 46 and 47. A subject is strategic in Part 3k, where k ∈ {a, b, c}, if her vote is optimal in all of the 4 rounds of that stage. Figure 3 reports the main findings of the experiment. For Part 1 the figure shows the cumulative percentage of subjects that become z-strategic for each of the 45 rounds, for z ∈ {85, 100}. We only plot results until round t = 40, since for rounds t > 40 there are less than 5 remaining rounds that can be used to check whether the subject becomes strategic. In the first rounds, only about 10 percent of subjects play optimally every remaining period (100-strategic), while this number increases to 19 percent by round t = 40. Figure 3 also shows that more permissive definitions of strategic behavior that allow for a large fraction of mistakes (z = 85) also result in about 19 percent of subjects becoming strategic by round t = 40. This convergence by round t = 40 captures the fact that strategic subjects make almost no mistakes once they become strategic.19 Figure 3 also shows the percentage of strategic subjects in Parts 2 and 3 of the Simultaneous Voting Treatment. There is a small jump in strategic behavior in Part 2, from 18 to 22 percent, which is explained by subjects who either become strategic in the last 5 rounds of Part 1 or when providing written advice.20 In addition, very few subjects become strategic as a result of answering questions Q3a and Q3b in Parts 3a and 3b, respectively and the effect of these hints is not statistically significant.21 In contrast, the written explanation of pivotality in Part 3c has a larger effect, increasing the percentage of strategic behavior from 28 to 57 percent (p-value 0.002). Curiously, the percentage of strategic subjects increases to 80 percent if we only look at the first round of Part 3c, which is 17 We
report the p-value of one-sided z-tests between parentheses. definition of strategic behavior, which implicitly requires that a subject who becomes sophisticated in a round remains sophisticated in all later rounds, is justified by the fact that, once sophisticated, our subjects make essentially no mistakes: For z = 95, there are only 2 strategic subjects who do not satisfy the z-requirement at a later round. 19 The difference between z = 100 and z = 85 observed in the initial periods is explained by the fact that several subjects become strategic in later rounds. 20 Under the assumption that subjects who are not strategic by round 45 would not have become strategic if they had played the additional rounds in Part 2 without having to write down their advice, then the jump due to writing down the advice is not statistically significant (p-value 0.65). We make a similar assumption when testing the effect of feedback in Part 3. 21 The p-values are 0.829 for Q3a and 0.536 for Q3b. 18 Our
AMERICAN ECONOMIC JOURNAL
Percentage of strategic subjects 5 10 15 20 25 30 35 40 45 50 55 60 65 70
12
Z=85
0
Z=100
MONTH YEAR
1
5
10
15
20
25 30 Round (P1)
35
40 P2 P3a P3b P3c
Figure 3. Strategic behavior in Simultaneous Voting Treatment (60 participants).
identical to the example that we use to explain the idea behind pivotal voting. But many subjects subsequently fail to extrapolate the logic to the second round, where the computers’ rules are inverted and it becomes optimal to vote for Red.22 Finally, Table 2 provides further details by classifying subjects into strategic and not strategic at every part of the experiment and shows the transition from non-strategic to strategic behavior. There are four main findings: First, almost without exception, subjects classified as strategic in earlier parts continue to be classified as strategic in later parts. Second, all subjects classified as strategic previous to answering Q3a and Q3b answer those questions correctly. Contrarily, subjects classified as non-strategic are less likely to answer those questions correctly, though a majority of them do provide the correct response (26 of 47 subjects for Q3a and 39 of 46 for Q3b). Third, very few non-strategic subjects become strategic after answering Q3a (1 of 47) and Q3b (4 of 46). Fourth, all of the non-strategic subjects that become strategic after answering Q3a or Q3b gave the correct answers to these questions.
22 One possible reason why we obtain 80 and not 100 percent strategic behavior is that the explanation comes late into the experiment and, unlike the previous questions, subjects receive no direct monetary reward for carefully reading the explanation.
VOL. VOL NO. ISSUE HYPOTHETICAL THINKING AND INFORMATION EXTRACTION 13
Table 2—Transitions from non-strategic to strategic behavior in Simultaneous Voting Treatment.
Part 2 Strat.
Part 3a
Not
Strat.
Strat. Part 1: Strat.
Part 3b
Not
Strat.
Strat.
Part 3c
Not
Strat.
Strat.
Not Strat.
11
0
11
0
11
0
11
0
Not Strat.
2
47
3
46
6
43
23
26
Part 2: Strat. - Q3a corr.
-
-
13
0
13
0
12
1
-
-
0
0
0
0
0
0
-
-
1
25
3
23
17
9
-
-
0
21
1
20
5
16
-
-
-
-
14
0
13
1
-
-
-
-
0
0
0
0
-
-
-
-
3
36
19
20
-
-
-
-
0
7
2
5
-
-
-
-
-
-
16
1
-
-
-
-
-
-
18
25
- Q3a incorr. Not Strat. - Q3a corr. - Q3a incorr. Part 3a: Strat. - Q3b corr. - Q3b incorr. Not Strat. - Q3b corr. - Q3b incorr. Part 3b: Strat. Not Strat.
Total 13 47 14 46 17 43 34 26 Note: The table shows the transition from non-strategic to strategic behavior in Simultaneous Voting Treatment, in which the total number of subjects was 60 and subjects are classified as strategic following Definition 1, with z=100. For example, row 1 and column 1 indicate how subjects classified as either 100-strategic or not in Part 1 (the row) are then classified according to Part 2 (the column). The second and third rows disaggregate results depending on the answers to questions Q3a and Q3b asked at the beginning of Parts 3a and 3b, respectively. For example, the numbers in row 2 and column 2 indicate: (i) whether subjects correctly answered question Q3a depending on how they were classified in Part 2, and (ii) how subjects transition into being classified as strategic or not according to behavior in the 4 rounds of Part 3a.
B.
Sequential Voting Treatment
There are two main challenges that imply that the design of the Sequential Voting Treatment must differ from the design of the Simultaneous Voting Treatment. First, there are less data to use in the sequential treatment because we can only make inferences from rounds in which subjects are pivotal. Because the probability of being pivotal in practical applications (hence, also in these experiments) is small, we would need to have an unrealistic number of rounds for each subject. Second, a subject will face greater incentives to perform well in a context where she is told that her vote will be pivotal. Our designs tackles these issues while making sure that the results of the simultaneous and sequential treatments are comparable. The Sequential Voting Treatment consists of five parts, and, as in the Simultaneous Voting Treatment, subjects are not given any feedback until the end of the experiment. Part 1 coincides with Part 1 of the simultaneous treatment, except that voting is sequential and the subject observes the realized votes of the com-
14
AMERICAN ECONOMIC JOURNAL
MONTH YEAR
puters before casting her vote. As before, we vary (p, q) for a total of 45 rounds. In Part 2, each subject is given incentives to provide useful advice to another randomly chosen subject regarding how to vote in each of three different situations: In round 46, subjects are told that their vote is pivotal, and strategic and sincere behavior do not coincide (p = 7, q = .9); in round 47, subjects are told that their vote is pivotal, and strategic and sincere behavior coincide (p = 3, q = .1); and, in round 48, subjects are told that their vote is not pivotal (p = 4, q = .25 and both computers voted for Red). Part 3 is designed to test the robustness of results from Parts 1 and 2 by collecting more information from pivotal cases. In Part 3 (rounds 49 through 93), subjects face another set of 45 rounds of the voting game, as in Part 1. The difference is that subjects now have to provide a voting recommendation, rather than an actual vote, to a randomly matched partner who will later face, at the end of the experiment, the same 45 rounds. Subjects will also earn the money that their partner makes, so they have incentives to provide good recommendations. Subjects are asked to provide a voting recommendation for only one of the following three scenarios: (i) one computer voted Red and the other Blue, (ii) both computers voted Blue, and (iii) both computers voted Red. For each of the 45 rounds, one of these three scenarios is randomly selected, and subjects can only recommend to their partner how to vote in that particular scenario. For each round in Part 3, we select an scenario in the following way: with probability .9, the pivotal scenario is chosen; with probability .1, the scenario is chosen according to the primitives of that round. Thus, subjects will face several pivotal rounds. We explained to subjects that, when facing each of these rounds at the end of the experiment, in Part 5, their partners would face each of these scenarios as determined by the primitives of each round and that it would be possible that their partner observes a different scenario than they did, in which case their advice would not be directly relevant.23 Parts 1, 2, and 3 achieve the desired objective of comparing the simultaneous and sequential treatments while tackling the challenges mentioned above. Parts 1 and 2 from the simultaneous and sequential treatments are directly comparable in terms of number of rounds and format; the only difference, as desired, is that voting is simultaneous in the first case and sequential in the second case. While observed behavior in Part 2 is also directly comparable in both treatments, one potential concern, however, is that we can only use rounds where subjects were pivotal to classify behavior in Part 1 of the sequential treatment. Therefore, we will have less observations to classify subjects in Part 1 of the sequential compared to the simultaneous treatment. This is probably a minor concern, especially given the finding from the simultaneous treatment that subjects make almost no mistakes once they understand the pivotal logic. Nevertheless, for robustness 23 We do not follow the strategy method (which asks for a recommendation for all contingent scenarios in each round) because it may help subjects to think hypothetically, thus biasing our results from Part 4.
VOL. VOL NO. ISSUE HYPOTHETICAL THINKING AND INFORMATION EXTRACTION 15
purposes, Part 3 is designed to obtain a large number of pivotal observations. We conclude the Sequential Voting Treatment by asking subjects to participate in the simultaneous-voting version of the experiment. In Part 4, subjects are asked to submit incentivized written advice for the same three cases of Part 2, except that now they play the simultaneous version of the experiment. In other words, they must provide advice that is not contingent on the votes of computers to another subject who will have to vote without observing the computers’ votes, exactly as in Part 2 of the Simultaneous Voting Treatment. This part allows us to test if experience with extracting information under sequential voting facilitates hypothetical thinking under simultaneous voting. Finally, in Part 5 subjects play the 45 rounds for which their partners provided advice during Part 3. Sequential Voting Results: We adjust Definition 1 to account for the fact that conclusions can only be drawn when a subject’s vote is pivotal. That is, if computers voted for different colors, a vote is optimal given (p, q) if it is a vote for Blue. DEFINITION 2: A subject becomes z-strategic at round t in Part 1 (respectively, Part 3) if t is the first round in Part 1 (respectively, Part 3) in which her vote is both pivotal and optimal (i.e. Blue) in round t as well as in z percent of the pivotal cases from round t until the end of Part 1 (respectively, Part 3). A subject is strategic in Part 2 (respectively, Part 4) if her advice is optimal in all rounds of Part 2 (respectively, Part 4). Figure 4 shows the findings for the Sequential Voting Treatment. The left-hand side shows the cumulative percentage of subjects that become z-strategic for each of the 45 rounds in Part 1, for z ∈ {85, 100}. We only plot results until round t = 40, since for rounds t > 40 there are less than 5 remaining rounds that can be used to check whether the subject becomes strategic. The percentage of strategic subjects increases to 86 percent by round t = 40, in contrast to the Simultaneous Voting Treatment (18 percent, also plotted in Figure 4; pvalue 0.00). As mentioned above, we have to be careful when interpreting these numbers because only an average of 7 pivotal cases are used to classify behavior in the sequential treatment. A more conservative comparison between the simultaneous and sequential treatments is provided by Part 2. As shown in Figure 4, 76 percent of the subjects are classified as strategic in Part 2 of the sequential treatment, a number that is substantially higher compared to the simultaneous treatment (22 percent; p-value 0.00). Figure 4 also reports findings for Part 3 (rounds 49 through 93), where subjects faced an average of 41 pivotal cases.24 The starting value of 53 percent shows a drop with respect to the percentage of strategic subjects in Part 2 (76 percent). This drop is explained by a few mistakes made in Part 3 by a small group of 24 As usual, to avoid noise coming from the last rounds, we only classify subjects until round Round 88: five rounds before Part 3 is over.
AMERICAN ECONOMIC JOURNAL
MONTH YEAR
Percentage of strategic subjects 20 30 40 50 60 70 80
90 100
16
0
10
Seq. Z=100 Seq. Z=85 Simult. Z=100
1 5
15
25
35
P2 55 Round
65
75
85
P4
Figure 4. Strategic behavior in Sequential Voting Treatment (58 participants). Note: Note: As a reference, the graph also displays results for the simultaneous treatment (60 participants)
subjects, as shown by the z = 85 dashed line. In fact, the set of subjects classified as becoming strategic by the end of Part 3 for the z = 100 and z = 85 criteria differ only in two subjects who made a mistake in only one round.25 Figure 4 also shows that most subjects have already become strategic before Part 3, and that the percentage of subjects that have become strategic by the end of Part 3 remains constant between 65 and 75 percent. In addition, we can contrast the 67 percent of strategic subjects in the first 8 rounds of Part 3 of the sequential treatment to the first 8 rounds of Part 3 of the simultaneous treatment (before subjects receive the explanation in stage 3c), where the percentage of strategic subjects is around 28percent (p-value 0.00). Overall, the results from Part 3 confirm the large differences between the simultaneous and sequential treatments already observed from Parts 1 and 2. These differences in Part 3 are even more striking when we take into account that subjects received hints in these rounds for the simultaneous treatment and that subjects had lower incentives in the sequential treatment because they were giving advice that might not necessarily be followed by their partners. The previous evidence shows that a large majority of our subjects are able 25 These
two subjects made a mistake in rounds 88 and 93, respectively.
VOL. VOL NO. ISSUE HYPOTHETICAL THINKING AND INFORMATION EXTRACTION 17
to extract the right information from the votes of the computers and that the differences with respect to the Simultaneous Voting Treatment are quite large. Moreover, the result that subjects can behave strategically despite low stakes is of independent interest for the voting literature, where a realistic feature of the environment is that people have a very small chance of affecting the outcome of an election. An additional way to assess the difference between the sequential and simultaneous treatments is to examine Part 4 of the Sequential Voting Treatment, where subjects submit written advice for three simultaneous rounds after having faced 93 sequential rounds. A reasonable hypothesis is that subjects who participated in the sequential treatment are more likely to behave strategically when immediately encountering the simultaneous version of the experiment because they have experience thinking about different scenarios (e.g., your vote is pivotal). Strikingly, however, Figure 4 shows that only 22 percent of subjects are classified as strategic in Part 4. Thus, even in the case where subjects have experience with the sequential version of the experiment, the proportion of strategic subjects falls by approximately 54 percentage points when voting becomes simultaneous.26 Consequently, while most subjects correctly extract information when voting is sequential, only a small percentage (comparable to the percentage of strategic subjects in the Simultaneous Voting Treatment) correctly extract information when voting is simultaneous.27 III.
Additional results and robustness checks
In this section we discuss additional results, some of which serve as robustness checks for the main results that were reported in Section II. Further results are provided in the Online Appendix. We refer to the Simultaneous Voting Treatment in Section II as the baseline treatment. A.
Feedback in the Simultaneous Voting Treatment
While the experimental literature emphasizes the role of feedback in reducing strategic uncertainty (e.g., Olivier Armantier (2004)), we have eliminated uncertainty about both the primitives and the strategies of the computers in our setting. Rather, our motivation in this section is to test whether feedback facilitates hypothetical thinking. In the Simultaneous Voting Treatment with Feedback, after the conclusion of each round, each subject receives information about the color of the selected ball, her own vote, the votes of the two computers, the vote of the 26 The difference is statistically significant (p-value < 0.001). Not surprisingly, all of these subjects were also classified as strategic in Part 3. 27 Although the results of Part 5 (where subjects receive advice before some rounds) are not reported in Figure 4, it is interesting to note that all subjects classified as becoming 100-strategic by the end of Part 3 would still be in the same category if we used Definition 2 for Part 5. In fact, the percentage of 100-strategic subjects increases to 90 percent towards the end of Part 5.
18
AMERICAN ECONOMIC JOURNAL
MONTH YEAR
majority, and her payoff for that round. A total of 58 subjects participated in this treatment. Figure 5 contrasts the results of the Feedback treatment to the baseline treatment of Section II. In both treatments, the percentage of strategic subjects is close to 10 percent in the initial rounds. However, in the Feedback treatment, the fraction rapidly increases to reach 48 percent by round t = 40 compared to only 18 percent in the baseline treatment with no feedback. There is a significant effect of feedback on the proportion of strategic subjects by round t = 40 (p-value ¡ 0.001). In addition, while learning to be strategic flattens out in both treatments, learning stops much earlier in the baseline treatment.28 The results for Parts 2 and 3 of the Feedback treatment are similar to the results of the baseline discussed in Section II. Asking subjects to give advice to another subject and providing several hints has no significant effect on strategic behavior. The percentage of strategic subjects increases to 62 percent after reading an explanation of pivotal voting, which is statistically indistinguishable (p-value 0.554) from the 57 percent under the baseline treatment.
70
Subjects by treatment
0
Percentage of strategic subjects 10 20 30 40 50 60
Simultaneous with Feedback Simultaneous
1
5
10
15
20
25 30 Round (P1)
35
40 P2 P3a P3b P3c
Figure 5. Strategic behavior: Feedback in Simultaneous Voting Treatment (58 participants) Note: Note: z=100 for all treatments; as a reference, the graph also displays behavior in the simultaneous treatment (60 participants)
28 Unfortunately, we do not have enough variation in the data to identify the events that trigger learning, so a full learning analysis is outside the scope of this experiment.
VOL. VOL NO. ISSUE HYPOTHETICAL THINKING AND INFORMATION EXTRACTION 19
B.
Written advice
Previously, we used the voting choices during the advice rounds to conclude that it was rarely the case that encouraging further reflection about the problem led to more strategic behavior. We now also use the specific written advice to infer whether people provide the correct logic.29 In the Simultaneous and Sequential Voting Treatments, all subjects classified as strategic in previous sections (where only voting choices were used to classify subjects) provided a correct explanation of optimal behavior when giving written advice to a potential partner. Therefore, the written advice confirms the findings in previous sections. C.
Private Values Treatment
In this section, we highlight that the logic applied above to find the optimal vote still holds in settings where the rules of the computers are not correlated with the color of the selected ball. Thus, if the phenomenon we found before is robust, we should also find mistakes in this other context. Accordingly, the treatment coincides with the Simultaneous Voting Treatment (in particular, voting is simultaneous), except that the payoffs and the rules of the computers are modified as follows. The payoff is now $2 if there is at least one vote for the color of the selected ball, and $0 otherwise. Computer 1 votes Red with probability q. Computer 2 observes the realized vote of Computer 1 and votes Red with probability q if Computer 1 voted Red and votes Red with probability 1 if Computer 1 voted Blue. Thus, computers’ votes are correlated with each other, but they are not correlated with the color of the selected ball. Table 3 shows the state-space representation for this problem. Table 3—State-space representation for Private Values Treatment. State
Subject’s Payoff
Selected Ball
Computers’ Votes
Probability
Vote R
Vote B
(1)
red
Red/Red
(p/10) × q 2
2
2
(2)
red
Red/Blue
(p/10) × (1 − q) × (1 + q)
2
2
(3)
red
Blue/Blue
0
2
0
(4)
blue
Red/Red
(1 − p/10) × q2
0
2
(5)
blue
Red/Blue
(1 − p/10) × (1 − q) × (1 + q)
2
2
(6)
blue
Blue/Blue
0
2
2
Despite the fact that computers’ strategies are not correlated with the color of the selected ball, the strategies do contain information about the likelihood 29 For details on different ways to use advice see Andrew Schotter (2003) and references therein. Our advice data were classified by us first and then by an independent research assistant. We verified that both accounts agree. The protocol that was given to the research assistant to process the data is available from the authors upon request.
20
AMERICAN ECONOMIC JOURNAL
MONTH YEAR
of each state, and the reasoning is similar to that applied in the Simultaneous Voting Treatment. In particular, it is never the case that both computers vote Blue, and, therefore, the third and sixth states have probability zero. But, then, a sophisticated subject should vote Blue. This example illustrates that the relevant state space includes both the primitive uncertainty (i.e., the color of the selected ball) and the actions of the computers, and, therefore, extracting information from others’ strategies is a very general phenomenon that can be relevant even if other players have no information about the primitive.30 As explained earlier, the Private Values Treatment coincides with the Simultaneous Voting Treatment, except for the payoffs and the rules of the computers. In particular, there are 45 rounds in Part 1, advice in Part 2 (rounds 46 and 47), and another 12 rounds in Part 3. The hints provided in Part 3 are, of course, tailored to this treatment. For both questions 3a and 3b, subjects are told that each computer follows the strategy in (1) with q = .5. Question 3a: What is the probability that both computers vote Blue? Question 3b: Suppose that the selected ball is red. Can you get a payoff of $0 if you vote Blue? Finally, in stage 3c, subjects are presented on the screen with an explanation of the optimal vote and play another four rounds. Subjects are only provided with feedback at the end of the experiment. Our findings for the Private Values Treatment are qualitatively similar to those for the Simultaneous Voting Treatment. A total of 61 subjects participated in this treatment. Figure 6 presents the data for all parts and to help comparisons also reproduces results for the Simultaneous Voting Treatment. Only 8 percent of subjects are classified as 100−strategic at round t = 1. By round t = 40, the percentage increases to 36 (22 out of 61 subjects). Allowing for a larger fraction of mistakes (z = 85) results in about 44 percent of subjects becoming strategic by round t = 40. Although the proportion of strategic subjects by round t = 40 is statistically higher compared to the baseline treatment of the Simultaneous Voting Treatment (p-value 0.03), the main qualitative finding remains: there is a relatively large number of subjects (approximately 64 percent) who are classified as non-strategic. In Part 2 of the Private Values Treatment, the proportion of strategic subjects jumps from 36 to 47 percent (p-value 0.20). Recall that a subject is classified as strategic in Part 2 whenever her vote is optimal in cases 46 and 47, regardless of the quality of their advice. Indeed, when we inquire into the causes for the difference, the jump is largely due to a few subjects whose advice is optimal for the wrong reasons. Hints and the explanation have a similar effect as in the Simultaneous Voting Treatment. All but one of the subjects classified as strategic in Part 2 answer Q3a correctly and, while 69 percent of non-strategic subjects also succeed in giving 30 The same conceptual point holds even if the computers’ strategies are independent of each other; we focus on the case where strategies are correlated in order to make Bayesian updating trivial.
VOL. VOL NO. ISSUE HYPOTHETICAL THINKING AND INFORMATION EXTRACTION 21
70
Subjects by treatment
0
Percentage of strategic subjects 10 20 30 40 50 60
No Private Information Simultaneous Simultaneous with Feedback
1
5
10
15
20
25 30 Round (P1)
35
40 P2 P3a P3b P3c
Figure 6. Strategic behavior in Private Values Treatment (61 participants) Note: Note: z=100 for all treatments; as a reference, the graph also displays behavior in the simultaneous treatment (60 participants) and the simultaneous treatment with feedback (58 participants)
a correct answer, the percentage of strategic subjects reaches only 38 and is not statistically different than the reported figure for round 40 of Part 1 (p-value 0.28). Similarly, almost half of our subjects who are classified as non-strategic in Part 3a answer Q3b correctly, but there is no significant effect from this hint (p-value 0.58). Finally, providing an explanation has a positive effect on the percentage of strategic subjects. According to the four rounds faced after the explanation, 31 of our 61 subjects (51 percent) are classified as strategic, with a higher percentage (67 percent) that answer the first round correctly, but the increase is not statistically significant (p-value 0.37).31 IV.
Conclusion
We design an experiment that can identify whether subjects are being strategic in a common-value voting environment while controlling for statistical or learning mistakes. In addition, the experiment distinguishes whether mistakes are due to the failure to think hypothetically or to the failure to extract information from 31 Recall that the first case of the final four rounds is identical to the one provided in the explanation. Although slightly lower, the percentage of overall success in the first case of the Private Values Treatment (67 percent) is not statistically different than that of the Simultaneous Voting Treatment (80 percent).
22
AMERICAN ECONOMIC JOURNAL
MONTH YEAR
others’ strategies. We find direct evidence that a substantial amount of people make mistakes. Depending on the amount of feedback received, between 50 and 80 percent of subjects behave non-strategically when voting is simultaneous. More importantly, these mistakes are mainly driven by difficulty in extracting information from hypothetical events, since most subjects are indeed able to extract information when they have knowledge of others’ actual votes. Finally, we show that the failure to extract hypothetical information from others’ strategies is a more general phenomenon that is also present in settings without private information. Overall, our findings suggest that information extraction from hypothetical events is a challenging task, and that, despite facing a simple voting problem and obtaining feedback, hints, an explanation of optimal behavior, and even experience with the sequential version of the experiment, a substantial percentage of people still remain unable to apply the right logic. REFERENCES
Ali, S. Nageeb., Jacob K. Goeree, Navin Kartik, and Thomas R. Palfrey. 2008. “Information aggregation in standing and ad hoc committees.” The American Economic Review, 98(2): 181–186. Armantier, Olivier. 2004. “Does observation influence learning?” Games and Economic Behavior, 46(2): 221–239. Battaglini, Marco, Rebecca B. Morton, and Thomas R. Palfrey. 2008. “Information aggregation and strategic abstention in large laboratory elections.” The American Economic Review, 98(2): 194–200. Battaglini, Marco, Rebecca B. Morton, and Thomas R. Palfrey. 2010. “The Swing Voter’s Curse in the Laboratory.” Review of Economic Studies, 77(1): 61–89. Bouton, Laurent, Micael Castanheira, and Aniol Llorente-Saguer. 2013. “Divided Majority and Information Aggregation: Theory and Experiment.” working paper. Camerer, Colin, and Dan Lovallo. 1999. “Overconfidence and excess entry: An experimental approach.” The American Economic Review, 89(1): 306–318. Camerer, Colin F., Teck-Hua Ho, and Juin-Kuan Chong. 2004. “A cognitive hierarchy model of games.” The Quarterly Journal of Economics, 119(3): 861–898. Charness, Gary, and Dan Levin. 2009. “The origin of the winner’s curse: a laboratory study.” American Economic Journal: Microeconomics, 1(1): 207–236. Crawford, Vincent P., and Nagore Iriberri. 2007. “Level-k Auctions: Can a Nonequilibrium Model of Strategic Thinking Explain the Winner’s Curse and Overbidding in Private-Value Auctions?” Econometrica, 75(6): 1721–1770.
VOL. VOL NO. ISSUE HYPOTHETICAL THINKING AND INFORMATION EXTRACTION 23
Dal Bo, Pedro, and Guillaume R Fr´ echette. 2011. “The evolution of cooperation in infinitely repeated games: Experimental evidence.” The American Economic Review, 101(1): 411–429. Eckel, Catherine, and Charles Holt. 1989. “Strategic voting in agendacontrolled committee experiments.” American Economic Review, Vol. 79, No. 4, p. 763, 1989. Eliaz, Kfir, Debraj Ray, and Ronny Razin. 2006. “Choice shifts in groups: A decision-theoretic basis.” The American economic review, 96(4): 1321–1332. Esponda, Ignacio. 2008. “Behavioral equilibrium in economies with adverse selection.” The American Economic Review, 98(4): 1269–1291. Eyster, Erik, and Matthew Rabin. 2005. “Cursed equilibrium.” Econometrica, 73(5): 1623–1672. Feddersen, Timothy J., and Wolfgang Pesendorfer. 1996. “The swing voter’s curse.” The American economic review, 408–424. Feddersen, Timothy J., and Wolfgang Pesendorfer. 1997. “Voting behavior and information aggregation in elections with private information.” Econometrica, 1029–1058. Feddersen, Timothy J., and Wolfgang Pesendorfer. 1998. “Convicting the innocent: The inferiority of unanimous jury verdicts under strategic voting.” American Political Science Review, 23–35. Fischbacher, Urs. 2007. “z-Tree: Zurich toolbox for ready-made economic experiments.” Experimental Economics, 10(2): 171–178. Fudenberg, Drew, and David K. Levine. 1993. “Self-confirming equilibrium.” Econometrica, 523–545. Goeree, Jacob K., and Leeat Yariv. 2007. “Conformity in the Lab.” working paper. Guarnaschelli, Serena, Richard D. McKelvey, and Thomas R. Palfrey. 2000. “An experimental study of jury decision rules.” American Political Science Review, 407–423. Holt, Charles A, and Roger Sherman. 1994. “The loser’s curse.” The American Economic Review, 84(3): 642–652. Huck, Steffen, Philippe Jehiel, and Tom Rutter. 2011. “Feedback spillover and analogy-based expectations: A multi-game experiment.” Games and Economic Behavior, 71(2): 351–365. Ivanov, Asen, Dan Levin, and Muriel Niederle. 2010. “Can relaxation of beliefs rationalize the winner’s curse?: an experimental study.” Econometrica, 78(4): 1435–1452. Jehiel, Philippe. 2005. “Analogy-based expectation equilibrium.” Journal of Economic theory, 123(2): 81–104. Jehiel, Philippe, and Fr´ ed´ eric Koessler. 2008. “Revisiting games of incomplete information with analogy-based expectations.” Games and Economic Be-
24
AMERICAN ECONOMIC JOURNAL
MONTH YEAR
havior, 62(2): 533–557. Kagel, John H., and Dan Levin. 1986. “The winner’s curse and public information in common value auctions.” The American Economic Review, 894–920. Kagel, John H., and Dan Levin. 2002. Common value auctions and the winner’s curse. Princeton Univ Pr. Kagel, John H., Ronald M. Harstad, and Dan Levin. 1987. “Information impact and allocation rules in auctions with affiliated private values: A laboratory study.” Econometrica, 1275–1304. Kahneman, Daniel, and Amos Tversky. 2000. Choices, values, and frames. Cambridge University Press. Kawai, Kei, and Yasutora Watanabe. forthcoming. “Inferring Strategic Voting.” The American Economic Review. Ledyard, John O. 1981. “The Paradox of Voting and Candidate Competition: A General Equilibrium Analysis.” Essays in Contemporary Fields of Economics: In Honor of Emanuel T. Weiler (1914-1979), 54. Levin, Dan, John H. Kagel, and Jean-Francois Richard. 1996. “Revenue effects and information processing in English common value auctions.” The American Economic Review, 442–460. Levine, David K., and Thomas R. Palfrey. 2007. “The paradox of voter participation? A laboratory study.” American Political Science Review, 101(1): 143. Levit, Doron, and Nadya Malenko. 2011. “Nonbinding Voting for Shareholder Proposals.” The Journal of Finance, 66(5): 1579–1614. Matvos, Gregor, and Michael Ostrovsky. 2010. “Heterogeneity and peer effects in mutual fund proxy voting.” Journal of Financial Economics, 98(1): 90– 112. Maug, Ernst, and Bilge Yilmaz. 2002. “Two-class voting: a mechanism for conflict resolution.” The American Economic Review, 92(5): 1448–1471. Maug, Ernst, and Kristian Rydqvist. 2009. “Do Shareholders Vote Strategically? Voting Behavior, Proposal Screening, and Majority Rules.” Review of Finance, 13(1): 47–79. Morton, Rebecca B., and Jean-Robert Tyran. 2011. “Let the experts decide? Asymmetric information, abstention, and coordination in standing committees.” Games and Economic Behavior, 72(2): 485–509. Myatt, David P. 2007. “On the theory of strategic voting.” The Review of Economic Studies, 74(1): 255. Schotter, Andrew. 2003. “Decision making with naive advice.” American Economic Review, 196–201. Thaler, Richard H. 1988. “Anomalies: The winner’s curse.” The Journal of Economic Perspectives, 2(1): 191–202. Vespa, Emanuel, and Alistair J. Wilson. 2013. “Communication with Multiple Senders: An Experiment.” working paper.
VOL. VOL NO. ISSUE HYPOTHETICAL THINKING AND INFORMATION EXTRACTION 25
Appendix: Subjects and payments
All sessions were run at NYU’s Center for Experimental Social Science (CESS), where each of our 296 subjects only participated in one of the treatments. In each session, before the experiment began, subjects were asked incentivized questions to test their understanding of the instructions. On average, sessions had 20 subjects, and the total number of subjects was 60 for the Simultaneous Voting Treatment, 58 for the Simultaneous Voting Treatment with Feedback, 58 for the Sequential Voting Treatment, 61 for the Private Values Treatment, and 59 for the Simultaneous Voting Treatment with fixed (p,q). For treatments where voting was simultaneous, payoffs were calculated by randomly selecting 7 out of 45 rounds from Part 1 and 3 out of 12 rounds from Part 3, and adding these payoffs to the payoffs obtained from answering the questions after the instructions and in Part 3.32 For the Sequential Voting Treatment, payoffs were calculated by randomly selecting 7 out of 45 rounds from Part 1 and 7 out of 45 rounds from Part 5 (adding both the subject and the partner payoffs).33 On average, subjects received $25 in both treatments of the Simultaneous Voting Treatment, $34 in the Sequential Voting Treatment, $28 in the Private Values Treatment, and $15 in the Simultaneous Voting Treatment with fixed (p,q). Sessions took on average 50 minutes in the Simultaneous Voting, Simultaneous Voting with Feedback and Private Values treatments, around 90 minutes in the Sequential Voting Treatment,34 and 30 minutes in the Simultaneous Voting Treatment with fixed (p,q). The instructions and additional details about how the experiment was conducted are provided in the Online Appendix.
32 Two
subjects also received additional payoffs from Part 2, as explained in the Online Appendix. subjects received additional payoffs from Parts 2 and 4. We incentivized subjects in the same manner as in Part 2 of the simultaneous treatment. 34 Parts 1 through 3 of the Sequential Voting Experiment took on average 60 minutes; the main source of delay came at the end of the experiment when subjects had to wait for everyone to be done with Parts 1 through 4 before starting with Part 5, where subjects now receive the advice given by their partner in Part 3. 33 Some