Human Perception in Segmentation of Sketches Pedro Company, Peter A.C. Varley, Ana Piquer, Margarita Vergara, and Jaime Sánchez-Rubio Department of Mechanical Engineering and Construction, Universitat Jaume I, 12071 Castellon, Spain {pcompany,varley,Ana.Piquer,vergara,al013546}@uji.es
Abstract. In this paper, we study the segmentation of sketched engineering drawings into a set of straight and curved segments. Our immediate objective is to produce a benchmarking method for segmentation algorithms. The criterion is to minimise the differences between what the algorithm detects and what human beings perceive. We have created a set of sketched drawings and have asked people to segment them. By analysis of the produced segmentations, we have obtained the number and locations of the segmentation points which people perceive. Evidence collected during our experiments supports useful hypotheses, for example that not all kinds of segmentation points are equally difficult to perceive. The resulting methodology can be repeated with other drawings to obtain a set of sketches and segmentation data which could be used as a benchmark for segmentation algorithms, to evaluate their capability to emulate human perception of sketches. Keywords: Sketch recognition, Low level ink processing and pen stroke segmentation, Engineering Graphics, Segmentation Ability.
1 Presentation Our interest is computer-based recognition of sketched engineering drawings, such as would allow automated conversion of engineering sketches into CAD representations. Segmentation of the drawing is a critical stage, and one which has received much attention over the years. Some important aspects of segmentation still remain unsolved, perhaps because (as [1] shows), segmentation is not, in fact, a single problem, but a set of similar problems. In this paper, we consider one such unsolved aspect: the benchmarking of computer-based segmentation of sketches. Recognition of the object portrayed in engineering drawings is a topical subfield of graphics recognition, which deals more generally with how computers can interpret semi-structured drawings which contain both freeform elements and symbols defined by convention. In the case of creating 2D or 3D CAD models of engineering objects from single or multiple drawings, it is the freeform elements, lines and curves, which portray the surfaces of the object, and it is these which we wish to identify. At this stage of processing, the conventional symbols (like dimensions and hatching) are clutter, and should be removed (and perhaps stored for later use). Our objective is thus to segment engineering drawings into lines, curves and clutter. J.-M. Ogier, W. Liu, and J. Lladós (Eds.): GREC 2009, LNCS 6020, pp. 106–117, 2010. © Springer-Verlag Berlin Heidelberg 2010
Human Perception in Segmentation of Sketches
107
When evaluating new segmentation approaches, one common strategy is simply comparing the number of segmentation points obtained by the new approach with the number of segmentation points which the “theoretical” shape possesses (by “theoretical” we mean the ideal primitives obtained from a line drawing by applying a welldefined set of topological and geometrical constraints). This strategy assumes that the new approach should detect those properties which the theoretical shape should possess, regardless of whether or not the actual drawing used as input really does possess them. In reality, we cannot assume that a sketched line drawing on paper will always contain exactly the same number and type of segments as the “perfect” line drawing which existed only in the mind’s eye of the drawing’s creator. The total number of segments may vary, both because of imperfections in the sketch itself and because of differences between geometrical and perceptual interpretation of sketches (such as the well-known perceptual illusions described by Hoffmann [2] or Palmer [3]). The types of perceived segments may also vary: for example, a sketched arc of large radius may be perceived as a straight line. Another common strategic deficiency is not paying attention to the locations of the segmentation points. As a result, a new approach may be considered good simply because it finds the ideal number of segmentation points, even though their actual locations are far from ideal (see, for example, [4]). If we are to evaluate a sketch recognition algorithm realistically, we should compare the differences between what the algorithm detects and what human beings perceive when parsing the same sketch. The comparison should consider not merely “how many?” but also “how close?”. We must also bear in mind that perhaps not all segmentation points are equally difficult to find. In such case, recognising many "easy" segmentation points should not be considered as a measure of success. To this end, we have performed experiments aimed at discovering: which segmentation points people perceive; where the segmentation points are located; and what geometrical flexibility in the locations of segmentation points can be tolerated. The paper is organised as follows. We first explain our motivation and hypothesis. Then we describe the design of the experiment so that the procedure we have developed may be used by other researchers to obtain segmentations of different sketches. In the subsequent section, we analyse our results and how they validate, modify or refute our hypothesis. The paper finishes with lessons learned and main conclusions.
2 Motivation Most sketch-based modelling approaches need line drawings as input for the model reconstruction stage. Freehand sketches must be converted into “tidy” line drawings [5]. The two main problems of this process are segmentation and overtracing. Overtracing is the use of multiple strokes to represent a single line. Readers interested in this topic can find a recent contribution by Ku et al. [6]. Segmentation is the process of dividing a complex stroke into its geometrical primitives. Segmentation of sketches is an open problem in the process of sketch recognition. One recent contribution can be found in [4].
108
P. Company et al.
We can note, in passing, that even segmentation of line drawings remains an unsolved problem. For example, arc segmentation is a classical process related to vectorisation and line drawing interpretation. Starting in 2001, the GREC workshops (organized by IAPR) have included contests focused on arc segmentation. Those contests test the abilities of participating algorithms to detect arcs from raster images. Segmentation of freehand sketches presents further difficulties due to the inherent imperfections of such sketches. E.g., it is often difficult to determine whether small variations from perfect geometry in the sketch are intentional, and should be detected during segmentation, or are simply the accidental consequence of hasty drawing. Most of the approaches described in the literature ([5], [7], [8], [9]) attempt to solve this problem by requiring the user to provide additional information. However, humans are able to segment sketches without requiring such extra information. It is reasonable to foresee, and prepare for, the day when advances in cognitive science result in automated approaches which come close to matching human performance. When they do, we shall require benchmarking criteria to evaluate such approaches. 2.1 Hypothesis Our initial hypothesis was that four different aspects affect the segmentation process done by humans: • Input quality. We hypothesise that sketches can be roughly graded as good, average or bad. Given good sketches, everybody will find the same segmentations (with, perhaps, meaningless differences). Given bad drawings, humans will not reach a consensus on how to interpret them. Thus neither good drawings nor bad drawings are appropriate for benchmarking. Only in average drawings will there be some obvious segmentation points upon which everyone will agree, but other segmentation points upon which opinions diverge. • Other lines. We hypothesise that some auxiliary lines (e.g. axes and dimensions) will help people to find the best segmentation, while others (e.g. grids) will disturb them. Perhaps, some lines will be neutral (e.g. hatching). • Clutter. We hypothesise that clutter (including auxiliary lines) will disturb people much less than it currently disturbs computer segmentation algorithms. • 2D versus 3D. We hypothesise that drawings of two dimensional shapes are easier to segment, as segmentation is not mixed with other problems. People perceive the image as “flat” and try to find its segmentation points without first trying to create a mind’s eye 3D model of the object portrayed in the image. However, the segmentations they produce after perceiving 3D shapes are more constrained, as they may never contradict their mind’s eye model. Another aspect of this problem is whether we should use natural or wireframe drawings. From the strict point of view of segmentation, this should make no difference, but if we assume that perception of 3D and perception of segmentation affect one another, then we should test the two modes separately. Ideally, we should produce test drawings in both styles. However, in fixing the limits of our current research, we decided that this initial investigation will consider neither wireframe drawings nor drawings containing
Human Perception in Segmentation of Sketches
109
representations of “scenes” (assemblies of several parts designed to function together). We limit our study to natural drawings depicting single parts.
3 Design of the Experiment Since our experiments are aimed at finding how humans segment sketched drawings, the core of our experiment is of necessity to produce a set of drawings and to ask people to segment them. In order to investigate our hypothesis given above, we distinguish three types of drawings: • Single orthographic views. These are not used as input in any existing sketch-based modeling application, but they nevertheless constitute a segmentation problem. They have the advantage of simplicity, and are useful for detecting very bad segmentation strategies and/ or approaches. • Multiple orthographic views. This is the input format used in some existing Sketch-Based Interfaces and Modelling (SBIM) systems. For example, we can hypothesise that segmentation strategies which combine the views and analyse the resulting 3D shape will be more successful than those which simply scrutinise the separate views. • Axonometric or perspective views. This is the input format used in most existing SBIM systems and includes several segmentations point types which can not be found in single orthographic views. Consequently, three different experiments are required. Each experiment consists of three main stages: (a) production of sketches, (b) segmentation and (c) measurement. 3.1 Production of Sketches As discussed above, we require sketches which meet the following criteria: • the sketch must not be too simple: if segmentation is easy, any reasonable approach will process it correctly, and the benchmark is meaningless, • the sketch must not be too complex: if the majority of humans cannot agree on an interpretation, there is no “human performance” to be duplicated, • the sketch must not be perfect: we are interested in the human ability to interpret freehand sketches, not in the application of simple geometrical rules, • the sketch must not be too imperfect: we must be able to reach a consensus as to whether an imperfection is deliberate or accidental, • the sketches must, as a set, contain examples of all of the common cases where curves meet planar faces (see, for example chapter 7 of Cooper’s book [10]) • the sketches must be representative of real engineering drawings: to avoid the problem of “gaming the system”, where an approach obtains high benchmark scores but does not perform well with a larger set of real drawings. The production process was divided into two steps: (a) choosing the suitable drawings; and (b) obtaining versions of different quality.
110
P. Company et al.
To choose suitable drawings, we first reviewed figures from the literature and created our own large initial set of figures, using our experience as teachers of engineering graphics and researchers in the field of SBIM to select figures which met our criteria. By circulating them to all of the members of the research team for comment we obtained a reduced but diverse set. After some iterations of this step, we finally reduced the test set to five CAD drawings (see figures 1, 2 and 3). To obtain versions of different quality, we asked other people from the research team to draw sketches reproducing the CAD drawings obtained in the previous step. All the sketches were drawn in standard sheets marked with a 15 x 15 cm square frame, in order to encourage the sketchers to draw sketches with similar sizes and proportions. The same frame was later useful as a reference system to measure the location of segmentation points. In order to evaluate the effects of input quality, the members of the research team evaluated the quality of the sketches and scored them from bad to good (fig. 1- 2). From the resulting set of drawings, we selected those we needed for the three experiments. Each volunteer segmenter was given only one of the three chain plate sketches and only one of the three pipe flange sketches. For comparison purposes, the segmenters were also asked to segment line drawings of both the chain plate and the pipe flange. The line drawings were given to the segmenters only after they had finished segmenting the sketches, to avoid those images influencing their perception of the sketches. In order to evaluate the influence of other lines, we compared the differences in perception of a drawing containing only edges, and the same drawing containing auxiliary lines (axis, hatching, dimensions, etc). For this test, we chose an average quality sketch of multiple orthographic views, and deleted auxiliary lines to obtain a "clean" version (fig 3, top). Half of the segmenters were asked to segment the original sketch, while the other half were asked to segment the "clean" version. In order to evaluate understanding of axonometric views, average quality versions of the two selected drawings were given to the segmenters (fig. 3, bottom). 3.2 Segmentation During the segmentation of the final set of sketches, each segmenter was asked to segment a small subset of the full set of sketches, in order to avoid wearying the subject. The figures assigned to each particular subject were chosen randomly, to avoid subjective grouping of similar or dissimilar figures. We asked the segmenters to segment the sketches by marking the exact position of each segmentation points and indicating the type of each resulting segment. These instructions were refined in each experiment. More information about the instructions given to answer the test can be found in [11]. 3.3 Measurements For the first experiment, segmenters were chosen from different profiles: from 11 to 69 years old, males and females, and a variety of technical drawing knowledge acquired in different formal education levels, ranging from primary school to university professors.
Human Perception in Segmentation of Sketches
111
The information contained in the tests was collated and recorded in: identification of the subject (sex and age), level of technical drawing knowledge, number of segmentation points marked, and (x,y) coordinate pairs of each segmentation point. The process we followed to obtain the coordinates was: a) scan the image as a bitmap; b) import the image into a CAD application and align its origin and the horizontal axis with those of the coordinates of the CAD application; c) mark the locations of the segmentation points and save their coordinates. Before storing the coordinates, we first had to decide which segmentation points they belonged to. To do this, we first analysed all the answers and produced templates containing the different segmentation points, using frequency and position as our two criteria. More details on measurements can be found in [11].
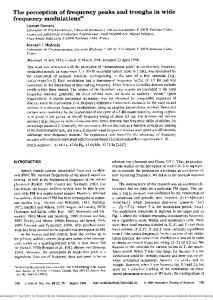
4 Analysis Qualitative results for the “chain plate” experiment are shown in figure 1, where every segmentation point of the chain plate marked by any of the segmenters has been superimposed. Analysing the results of the experiment 1, we can conclude that our first hypothesis is valid, as quality of sketches has clearly influenced the perception of segmentation points.
(a)
(b)
(c)
(d)
Fig. 1. Superimpositon of every segmentation point marked by any segmenter in the four classified drawings: (a) line drawing, (b) poor, (c) average and (d)good quality sketch
However, our results suggest that the grading (poor, average or good) which we gave to the three selected sketches does not always fit with the dispersion in the segmentation points found by the segmenters. The chain plate sketch considered as average (upper right in figure 1) was marked with more erroneous segmentation points that the sketch graded as poor (lower left). We conclude that some of the grading criteria we followed were wrong. For example, we assumed that overtracing makes a sketch more difficult to perceive, but this seems not to be so. On the other hand, greater the topology and geometry distortions appear to be distracting for the
112
P. Company et al.
segmenters. More studies are needed to determine a method of grading the quality of sketches aimed particularly at the segmentation process. We can note in passing that the exact line drawing (Figure 1 a) also led to in some erroneous segmentation points. This result appears to contradict our hypothesis that in good drawings everyone should perceive the same segmentation points. However, most of these erroneous points come from a misunderstanding: some segmenters said that they had thought that full circles were not arcs, and should thus be segmented, and decided to break the circles into two halves or four quadrants. It is interesting to note that, having segmented full circles, some of them propagated their segmentation points to the surrounding concentric external arcs, perhaps because these too encompassed more than 180°. The same results can be confirmed through qualitative analysis of “pipe flange” segmentation as shown in figure 2.
(a)
(c)
(b)
(d)
Fig. 2. Superimpositon of every segmentation point for the pipe flange drawing in the four classified drawings of it: (a) line drawing, (b) poor, (c) average and (d) good quality sketch
As can be seen in figure 3 (on the top), the second experiment clearly validates one aspect of our second and third hypotheses: no significant differences can be found between segmentations of the rocker arm with and without auxiliary lines. Only a few segmenters marked some intersections between edges and dimensions (e.g. the upper arrow of the diameter 45 dimension in the left side). However, one main question which remains unanswered is whether or not the prior perception of the 3D shape depicted in the drawing is important when uncoupling edges from the remaining lines. Another factor which could have contributed to the result is previous knowledge of the meaning of those symbols—all of the segmenters for this experiment had some exposure to technical drawing. Finally, more experiments should be required to determine the exact impact of noise in the segmentation process. The results of our third experiment, fork and hinge segmentations shown in figure 3 (bottom), cannot be used to validate our fourth hypothesis. It certainly seems that segmentation points are as dispersed (and possibly more dispersed) in the flat
Human Perception in Segmentation of Sketches
113
Fig. 3. Superimpositon of every segmentation point for the second (up) and the third (low) experiment
drawings of the first experiment as in the 3D shapes depicted in the second and third experiments. This would be what we would expect. However, there are methodological problems with the third experiment which could “pollute” our results. Firstly, the instructions explicitly asked the segmenters to perceive a three dimensional shape for the second and third experiment. Secondly, while many of the segmenters in the first experiment had no technological background, all of the segmenters in the second and third experiments had had previous exposure to technical drawings. We believe that training and practice are more important for interpreting multi-view drawings than for axonometric drawings. Thus, although we believe that, left to themselves, people would first perceive the 3D shape and then produce a segmentation influenced by this perception, we cannot as yet claim any experimental evidence to validate this belief. We can, however, confirm one result which was partially observed in the previous experiments. Segmentation points located on those junctions where two or more straight segments meet are perceived by almost all segmenters, and the location of those points is very precise (dispersion is very low). Segmentation points located on junctions where more than two lines meet are also readily perceived, irrespective of
114
P. Company et al.
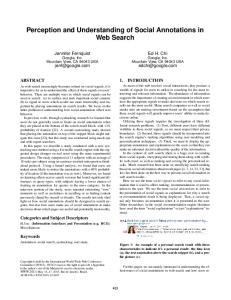
whether the lines are straight segments or arcs. We regard this result as conclusive— no further studies are required about segmentation points located on junctions where three or more lines meet, or two straight lines meet. Segmentation points located at tangential junctions of two arcs or one straight segment and one arc seem to be more difficult to perceive, as a significant part of the segmenters failed to mark them. The dispersion in the location of those points is high. We have calculated the average positions of all the segmentation points (figure 4 left), and the average position of those points that are perceived by most than 50% of the interviewed subjects (figure 4 right). These images are indicative of the results we will obtain after processing a full set of sketches to be used as benchmarks for segmentation algorithms.
5 Lessons Learned We have discovered small distortions in size and orientation between the paper sheets that we gave to the interviewed subjects and the electronic copies that we used to process the data after scanning the paper sheets. Although they have had no influence in the current qualitative analysis of results, this problem should be resolved before proceeding to a fine measurement of average location and tolerable deviations for those segmentation points where significant dispersion appears. Although we detected some misunderstanding of the task due to ambiguities in the explanatory text of the first experiment and tried to correct them in the explanatory texts of the subsequent experiments, some misunderstandings nevertheless occurred. We have to detect the origin of the misunderstandings and produce a clearer set of instructions in order to ensure that future segmenters understand clearly the task they are supposed to do. For example, some segmenters included an excessive number of segmentation points. Although their answers are not statistically significant, one of their repeated comments is valuable. When they were asked why they had done so, their replies were as follows: I perceive what you intend to represent in the drawing, but, as you have asked me to segment what I can see, I have had to mark what I know that are actual imperfections due to mistakes in the sketching process, or even due to the printing process (i.e. serrations). The comment raises the important distinction between what can be seen but should be ignored, and what is really important because it corresponds to the perceived purpose or message of the image. Obviously, humans are able to perceive the latter, and it is this complex ability which should be emulated by computer applications. The procedure we followed for measuring the coordinates of the segmentation points is tedious and should be automated. Even more importantly, measuring Cartesian coordinates with reference to an external origin is not an ideal strategy. Firstly, they are statistically awkward to process. Secondly, (x,y) coordinates are particularly bad choice as they are paper-relative, not drawing-relative. If the results are scanned obliquely or at an offset, the (x,y) coordinates of the drawing itself change. What is needed is a single-parameter parameterisation of locations where a hand-drawn annotation intersects a pre-existing hand-drawn sketch.
Human Perception in Segmentation of Sketches
115
Fig. 4. Average locations of all segmentation points (left) and those perceived by more than 50% of the segmenters (right)
116
P. Company et al.
Fig. 4(cont). Average locations of all segmentation points (left) and those perceived by more than 50% of the segmenters (right)
The main requirement of the single-parameter parameterisation is that it must be object-relative: the coordinates must be relative to fixed features of the object. In future, we intend to fit the sketches to parametric curves (for example, by applying some variant of the approach described in [4]), and use natural coordinates for coordinates and statistical values.
6 Conclusion We have defined and evaluated a procedure for obtaining a set of benchmark sketches that will be useful for evaluating the quality of segmentation approaches, with regard to their capability to emulate human perception of sketches. The procedure includes criteria for selecting the drawings, and an approach for extracting and analysing the information. In spite of its apparent simplicity, even examples like the fork have proved to be challenging, as they contain many segmentation points whose locations are difficult to fix. This indicates that the procedure followed when choosing the benchmarking
Human Perception in Segmentation of Sketches
117
drawings was appropriate. The evidence collected during our experiments supports the hypothesis that not all kinds of segmentation points are equally difficult to perceive. As a consequence, we should ensure that the final set of benchmarking sketches will contain a balanced set of different kinds of segmentation points, as it is important to consider levels of difficulty of segmentation points rather than merely their number. The procedure should be refined to avoid the inconveniences described in Section 5 and a large set of drawings should be processed to obtain a benchmarking set with segmentation points statistically validated as being those which people perceive. Acknowledgments. The Spanish Ministry of Science and Education and the European Union partially supported this work: DPI2007-66755-C02-01 (CUESKETCH: multi-agents based recognition of ideation sketches). The support of the Ramon y Cajal Scholarship Programme is also acknowledged with gratitude. We are also grateful to Jorge Domingo who helped us in processing the tests information.
References 1. Tombre, K.: Analysis of Engineering Drawings: State of the Art and Challenges. In: Chhabra, A.K., Tombre, K. (eds.) GREC 1997. LNCS, vol. 1389, pp. 257–264. Springer, Heidelberg (1998) 2. Hoffmann, D.: Visual Intelligence. How we create what we see. Norton Publishing, New York (1998) 3. Palmer, S.E.: Vision science. Photons to phenomenology. The MIT Press, Cambridge (1999) 4. Pu, J., Gur, D.: Automated Freehand Sketch Segmentation Using Radial Basis Functions. Computer-Aided Design (2009) (in Press) 5. Jenkins, D.L., Martin, R.R.: Applying constraints to enforce users’ intentions in free-hand 2-D sketches. Intelligent System Engineering 1(1), 31–49 (1992) 6. Ku, D.C., Qin, S.F., Wright, D.K.: Interpretation of Overtracing Freehand Sketching for Geometric Shapes. In: WSCG 2006 (2006) 7. Stahovich, T.F.: Segmentation of pen-strokes using pen speed. In: AAAI Fall Symposium - Technical Report FS-04-06, pp. 152–158 (2006) 8. Gennari, L., Kara, L.B., Stahovich, T.F., Shimada, K.: Combining geometry and domain knowledge to interpret hand-drawn diagrams. Computers and Graphics 29(4), 547–562 (2005) 9. Pu, J., Ramani, K.: Implicit geometric constraint detection in freehand sketches using relative shape histogram. In: Sketch-Based Interfaces and Modeling 2007 - ACM SIGGRAPH/Eurographics Symposium Proceedings, pp. 107–114 (2007) 10. Cooper, M.: Line Drawing Interpretation. Springer, Heidelberg (2008) 11. Company, P., Varley, P.A.C., Piquer, A.: Benchmarking for Computer-based Segmentation of Sketches. Technical Report Ref. 06/2010 Regeo. Geometric Reconstruction Group, http://www.regeo.uji.es