How User Experience Design Can Affect Motivation: A Study on a Real World Sport Application Paolo Pilloni
Fabrizio Mulas
Luisella Piredda
Salvatore Carta
Dept. Computer Science University of Cagliari via Ospedale 72 09124 Cagliari, Italy
[email protected]
Dept. Computer Science University of Cagliari via Ospedale 72 09124 Cagliari, Italy
[email protected]
Everywhere Sport srl via Cornalias 24 09121 Cagliari, Italy
[email protected]
Dept. Computer Science University of Cagliari via Ospedale 72 09124 Cagliari, Italy
[email protected]
Abstract— Many researchers from different scientific fields are developing new strategies to foster individuals toward a physically more active lifestyle. In most cases, these strategies exploit new generation mobile devices together with social networks to augment their persuasive power. In our research work we focus on the study of the effects of these technologies on people’s sport habits. To better study this phenomenon, we are developing a software platform that aims at encouraging people to pursue a more active lifestyle. This work presents an experimentation conducted on Everywhere Run!, a mobile application part of the platform, that aims at helping people to stay active behaving like a virtual personal trainer. Very preliminary tests on the impact of the application on users’ motivations, show that it is perceived as a valuable motivational tool. These tests have been the starting point for this work that presents an interesting result that is closely related to recent radical changes we made to the graphical design and usability of the software. During a six months period, we observed a considerable increment of the total number of daily trainings. To statistically prove the effectiveness of the redesign, we decided to compare the two versions of the application. The results confirm the effectiveness of the new design and bring us to another important intuition that we will better investigate over a longer period of time in our forthcoming researches: user experience may positively influence users’ motivations and their perception of the offered features especially in the long term. Keywords—Persuasive Computing; User Experience Design; Human Computer Interaction; Healthy Lifestyle; Running.
I.
I NTRODUCTION
Several studies demonstrate the importance of a regular physical activity for people well-being (see for example, [2][3][4][5]). Low levels of physical activity are a major risk factor for lower life expectancy, cardiovascular diseases and many other chronic diseases. Former studies put in evidence the benefits of a healthy lifestyle, nevertheless, it does not seem to be enough to encourage people to conduct a healthier lifestyle. This alarming trend is clearly shown by several researches as, for example, by the report of the World Health Organization (WHO) for the years 2008-2010 [6]. The report, along with other similar studies (see, for example, [7]), lists some advices for a better lifestyle. For example: •
Engage in regular physical activity
•
Limit the intake of free sugars
•
Limit energy intake from total fats and shift fat consumption away from saturated fats to unsaturated fats
and towards the elimination of trans-fatty acids •
Increase consumption of fruits, vegetables, legumes, whole grains and nuts
Scientists from different backgrounds and several industrial entities are proposing new persuasive techniques to encourage people in everyday physical activity. These methodologies tend to leverage a fun oriented approach together with new mobile devices to motivate individuals towards healthy habits. Buttussi et al. [12] propose a classification for this kind of persuasive tools: •
Computer-supported physical games
•
Virtual trainers
•
Mobile applications and devices
Our researches are focused on the last category since it seems to be the most promising one in terms of the high number of related researches, proposed solutions and encouraging results obtained so far. Mobile device usage is growing fast and it is somehow affecting people’s everyday life. They are relatively inexpensive, versatile, highly portable and are potentially usable at anytime, anywhere. As an example, Mulas et al. [13] propose a mobile application, called Everywhere Race!, that allows users from all over the world to interact and to compete in virtual real time races in different speed-based sports. Everywhere Run! (EWRun), as well as Everywhere Race!, fosters social interactions. However, its interaction model is different from other similar applications. It focuses on relationships between users and real personal trainers in addition to that, more common, between similar users. In this way, it favours beginner runners to get a tailored workout plan and to start running avoiding common first-time mistakes. A user can request his custom-tailored running plan to a real trainer and he can receive it seamlessly inside the application. At this point, the user as just to start running letting himself be guided by the virtual trainer to run the selected distance at the right pace. Many researches [9] [10] put in evidence the benefits and the influence of social interactions in sport. The constant support of a real trainer, in addition to make workouts safer, can be much more motivating in the long term too. Our application is designed to help people to get rid
of some common deterrents to physical activity like, for example, time constraints rather than gym membership fees. The application allows users to get in touch with a real trainer to get a tailored workout plan they can follow at anytime, anywhere. This results both in more time flexibility and in lower costs for users given that it is not mandatory for them to meet with a real coach. Other solutions, however, try to attract users focusing mainly on their past performance rather than the social and ludic aspects of sport. For many people, this can be a limiting factor especially when the aim is both to attract non-habitual runners and to motivate them in the long term. With respect to other proposals our approach promotes interactions between users and real trainers through a community of runners. Very preliminary results confirm that users appreciate EWRun functionalities [24] meaning that our work is on the good track. Nevertheless, the data collected from recent application usage statistics suggest that many innovative features are not enough if the whole design has not been realized with a special attention to user experience. Our assertion follows from a recent radical redesign of the application. We moved from a relatively simple and not very user centered design to a better one following usability best practices and the Android design recommendations [8]. These changes resulted in a remarkable application’s user growth even if there were no notable functional improvements. This is why we decided to mathematically prove the goodness of the new design with respect to the old one. We performed an A/B test on 40 users through two standard System Usability Scale (SUS) questionnaires [11] (one questionnaire for each design under evaluation [37]). The encouraging results obtained so far suggest us that the offered functionalities without the proper design are not enough to attract people especially for a long time period. To the best of our knowledge we are the first, in the field of mobile persuasive technologies, to show similar results for a real world application used by hundreds of users everyday. This interesting result bring us to another intuition that we will investigate in the near future over a longer time period: user experience can be crucial to alter individuals’ motivation and can deeply influence their perception of the offered functionalities. The rest of this paper is organized as follows: Section II surveys the state of the art in the field of mobile persuasive computing. Section III briefly describes the application and shows how its design has been changed whereas, Section IV reports the results of the experimentation. Section V concludes the paper. II.
R ELATED W ORK
In this section, we report some studies and some technological systems designed to help people during daily physical activity. In [18], IJsselsteijn et al. investigate on intrinsic motivation enhancement. For their studies, they realized a virtual coach system to help users while cycling on a stationary bike. They report a good users reaction to the stimuli provided by the coach and derived some important results about the way the users perceived the informations provided by the virtual coach during the trainings. Mulas et. al. [13] propose an innovative mobile application called Everywhere Race!. The application is designed to moti-
vate people in a wide range of speed-based sport activities. It is the first system that allows users from all over the world to compete against each other in different speed-based sports. The software, in a completely different way than others, allows real time races among participants and makes available a significant set of social functionalities by means of the social network Facebook. In [19], is presented a game called Your Shape Fitness Evolved designed to help users during indoor workouts. The game, among other features, allows users to design a custom workout, to keep track of training statistics and to challenge other users by means of a virtual community. Toscos et al. [20] propose an application, called Chick Clique, to help teenage girls to adopt a healthier lifestyle. The software stores informations about the caloric content of popular foods and the amount of steps necessary to burn them. Chick Clique aims at fostering social interactions by means of SMS in order to boost a positive competition among users. Hoysniemi et al. [17] illustrate the results regarding the experimentation of a famous dance video game called Dance Dance Revolution. The results stress the positive influence of gaming with respect to motivational, physical and social factors. Chittaro et al. [15] propose a location-based exergame based on the classic Snake mobile game in which the snake is guided by users’ movements. The work aims at encouraging users to walk more frequently and at demonstrating the effectiveness of the proposed solution through the adoption of standard questionnaires. Obtained results put in evidence how users’ behavior can be influenced by the fun resulting from the game. Oliveira et al. [22] present a mobile phone application called TripleBeat. The application uses both an accelerometer and an ECG to push runners to achieve predefined goals expressed in terms of heart rates. Their experimentation revealed the importance of a well-designed graphical user interface in order to enforce users’ motivations. Consolvo et al. [21] present a mobile application called Houston. The application makes use of a pedometer to count, to record and to share the results achieved by the user. The authors derived some interesting key design guidelines to be used in this class of mobile applications: •
Users expect to have thorough measures and long term statistical reports of their activities
•
Support for social features to improve users’ motivation through a friendly competition
•
Take into account the comfort of proposed solutions
Consolvo et al. [16] present UbiFit Garden, a mobile system that uses on-body sensing, activity inference and mobile display to encourage people to stay active. Preliminary results, derived from a three-week field trial, show that users were positively surprised by the novelties the application introduced and their responses help authors to derive some guidelines to be observed to improve their system. Nike+ [23] is one of the most popular applications to help people during sport activities. Some of its main strengths are: the advanced vocal cues and music system management, the deep use of social networks and the support of a web community where users can create their workouts plans and
Fig. 1.
Application’s dashboard.
Fig. 2.
Old design workout creation menu.
Fig. 3.
New design workout creation menu.
interact with other sportsmen. Along with Nike+, there exist several other commercial examples of such a kind of applications. Just to name a few: Adidas miCoach, Endomondo, MapMyFitness, RunKeeper, Runtastic and many others. All these systems provide more or less the same core functionalities: •
Route and workout data tracking
•
Statistical reports
•
Results sharing through ad hoc communities or social networks
As previously stated, our work is focused on the relationship between user experience and mobile persuasive technologies. In the next sections we are going to describe how EWRun has been redesigned, the procedure we used to evaluate both the new and old design and the obtained results so far. From our researches on this topic, we have not found similar case studies. This is probably because academic proposals are typically prototypes and do not have a considerable amount of users to conduct comprehensive tests. Commercial products, on the contrary, usually have a huge amount of users and refined designs but, to the best of our knowledge, there are no publicly available studies and results on this subject. III.
E VERYWHERE RUN ! R EDESIGN
EverywhereRun! [24] is a mobile application designed to support people during their running routines. By means of the application users can design their own regimes or get tailored ones directly from a real personal trainer seamlessly inside the application. EWRun redesign has been inspired by the guidelines proposed in [21] and for this reason, we introduced a new home screen (see Figure 1) that reports all the statistics of user’s past trainings such as: the total distance covered, the total number of workouts, the average speeds and so on. Figure 2 and Figure 3 show the workout creation screen respectively for the old and the new design. Through this screen users can plan relatively complex regimes like the one, called “Monday”, showed by the two figures: each training is composed of several “sessions”, called “traits”, defined in terms of distance and pace (or speed) to keep. The “trait 1” in Figure 3 means the user wants to run 2km at a pace of 5 minutes per kilometer (note: runners generally express speed
as the time to run one kilometer or mile). The first trait is followed by “trait 2” where the runner expects to run 10km at a higher pace than before. Hence, EWRun permits to define quite complex regimes in order to satisfy even the most demanding runners. Both designs offer the same features in terms of training design complexity, although the new one is completely different in terms of usability (note that the following consideration holds for all of the screens of the new design): global application’s settings have been made available in this screen whereas many other options, local to the screen, have been moved from the bottom of the screen to the topmost bar as suggested by the new Android design guidelines. This allows us to give more homogeneity to the navigation between screens and to keep many locally available functionalities grouped in the top bar rather than scattered all over the screen. As previously stated, the virtual personal trainer is the core feature of EWRun. By means of this functionality the application is able both to guide and to motivate the runner during the whole workout in order for him to reach predefined goals (i.e., the goals set by means of the workout creation screen, see Figure 2 or Figure 3). In Figure 4 and Figure 5, it is possible to observe, again for the old and the new design, two ongoing workouts and how the virtual personal trainer feature works. Figure 4 shows the virtual trainer represented by the orange icon in the left center of the screen. He acts like
Fig. 4.
Fig. 5.
Old design personal trainer screen.
New design personal trainer screen.
pacemaker (note: a pacemaker has the task to keep the pace for other runners) so that the runner, virtually represented by the green icon in the center of the screen, has just to follow him focusing only on the run. In both designs, the topmost part of the screen contains an horizontal bar to give user an overview of the whole workout (note that the workout length is known a priori since it has been defined in the workout creation screen) with the actual position of the runner with respect to the virtual trainer. Just below the bar there is a dashboard that reports current speeds, distances and times regarding both the current trait and the whole training session. The two buttons in the bottommost of the screen (only for the old releases) allow to zoom in/out the part of the whole workout depicted in the central part of the screen. This was supposed to make it easier for the user to estimate the current distance to the trainer (see below). In the old design the two big arrows in the right side of the screen suggested to the user if he has respectively to slow down or to speed up. In between the arrows the current distance of the runner to the trainer is clearly indicated. Furthermore, the two arrows will be alternatively filled proportionally to the need of slowing down or speeding up. Hence, the user knows at any moment his current performance level with just a quick glance at the screen. All that can be observed in Figure 4. The figure depicts a runner just 3 meters behind the virtual coach, thus none of the arrows is filled to signal that the user is keeping the proper pace.
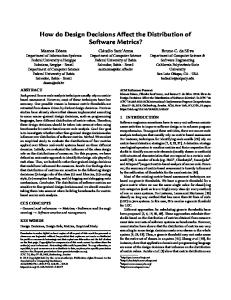
Fig. 6. Number of trainings with old (Nov 2012. to Jan 2013) and new design (Feb. to Apr. 2013).
Now, we are going to further explore the differences between the two designs: in addition to the aforementioned bar at the topmost of the screen (see Figure 5), used both to improve the navigability and to more evenly group both global and local options, we focused our efforts to redesign the portion of the screen that depicts the user and the virtual coach during a training session (i.e., the “personal trainer” area in the lower half of Figure 5). Some advices from EWRun beta testers pushed us to simplify the various components originally present. At first, in addition to a general graphic improvement, we switched the “personal trainer” area from a vertical to an horizontal orientation to be consistent with the whole workout perspective at the topmost of the screen. Secondly, the zoom in/out buttons have been removed since they seem to be useless when used during a training and finally, we removed one of the two arrows. Indeed, now there is only one arrow that changes its orientation accordingly to the current position of the user with respect to the virtual personal trainer. The distance gap between the user and the trainer has been moved near the icon representing the user, in its left. In this way, we try to keep training data as compact as possible by decreasing the total number of graphic elements for a better user experience. IV.
E XPERIMENTAL R ESULTS
The new design of Everywhere Run!, as previously introduced in Section III, caused a statistically significant user base growth. For this reason, we decided to compare the two designs by means of a standard testing methodology known as A/B testing (see for example, [33]). The description of the experimentation will start by showing the application’s usage statistics that inspired us to conduct this study and, afterwards, we will describe in more detail the A/B testing methodology and the mathematical tools we used for the experimentation. Figure 6 reports the number of weekly workouts (by all users) performed with both application designs. The statistics have been collected over a three months period, from November 2012 to January 2013 for the old design and from February to April 2013 for the new design. In the graphic is clearly shown the number of trainings growing from about 1500 of the 1st of November 2012 to about 2300 (+53%) at the end of January 2013. In general, there is a positive growth rate but much lower
when compared to usage statistics for the new design. With the introduction of the new design in February 2013 (again there were no new features offered) the number of trainings passed from about 2300 to about 4000 (+74%). Now, we are going to explain the A/B test we conducted. A/B testing, also known as split testing, is a widely adopted technique typically used to compare two design variants (A and B) of the same system. Amazon was probably the first industrial entity to adopt this procedure to evaluate the user experience of its marketplace. Differences between version A and version B can range from completely different layout structures to, for example, the font type, the different disposition of a button and so on. The goal of the evaluation is to identify some changes that can increase a certain metric of interest. To conduct the test, we adopted the System Usability Scale (SUS) questionnaire [11]. SUS is a well known tool (it counts more than 600 citations [35]) used both by industries and by academics. SUS is technology independent and it has been used to test web sites, hardware, consumer software and much more. The questionnaire is composed of 10 questions with 5 response options. Each question is rated using a Likert scale ranging from 0 (“strongly disagree”) to 5 (“strongly agree”). We conducted our experiment with a sample of 40 participants that regularly used both application versions. The sample was composed of 34 males and 6 females with an average age of 35.8 years (standard deviation was 10.4 years). All the users regularly practiced sport at an amateur level and they all have had at least a previous experience with applications to support physical activity. Table I reports the SUS scores for all the testers and the mean of difference scores. The experimentation has followed the method proposed by Sauro et al. [33] to prove what the usage statistics suggest (see Figure 6). Often, in many research fields (HCI is no exception), the population mean and standard deviation are not known so it is not possible to use the Empirical Rule and z-scores [34][33]. Under those circumstances, it is used a paired t-test [30] to compare how a limited number of testers perform in two different test conditions. In particular, we use a paired t-test to determine if the difference between SUS score means for the two designs is significant or not. To determine the test statistic t the following formula is used:
t=
D Sd √ n
(1)
where: D is the mean of the difference scores, Sd is the standard deviation of the difference scores and n is the sample size. In our case (see Table I) D is equal to 26.8, Sd is equal to 15.621 and the sample size (n) is 40. Plugging in all the values in Formula 1 we obtain a value for t equal to 18.85. Is this value statistically significant? To answer to this question we have to look up the p-value [36] using the Student’s distribution table with n-1 (39) degrees of freedom. The table give us 2.415 × 10⁻¹³ . This very small value tell us that the SUS scores for the two designs is different with a probability very close to 100%. This result confirms us that the difference is statistically significant but, is it significant enough for users so that they will notice it? The confidence interval around the difference will answer to this question. The formula 2 is used
TABLE I.
SUS S CORES
User 1 2 3 4 5 6 7 8 9 10 11 12 13 14 15 16 17 18 19 20 21 22 23 24 25 26 27 28 29 30 31 32 33 34 35 36 37 38 39 40
New 80 92.5 97.5 82.5 100 100 100 85 77.5 97.5 97.5 95 95 80 85 97.5 92.5 55 55 87.5 82.5 70 82.5 95 85 85 79 90.5 82.5 82.5 92.5 77.5 75 97.5 85 87.5 75 97.5 90 87.5
Old 50 62.5 52.5 42.5 65 100 100 42.5 50 77.5 65 40 45 75 72.5 65 85 52.5 52.5 45 42.5 45 40 45 60 65.5 47.5 57.5 55 74 67.5 52.5 75 65 47.5 50.5 75 70 57.5 47.5
Difference 30 30 45 40 35 0 0 42.5 27.5 20 32.5 55 50 5 12.5 32.5 7.5 2.5 2.5 42.5 40 25 42.5 50 25 19.5 31.5 33 27.5 8.5 25 25 0 32.5 37.5 37 0 27.5 32.5 40
Mean
86.3
59.5
26.8
to determine the confidence interval: Sd D ± tα √ n
(2)
where: D is the mean of the difference scores, n is the sample size, Sd is the standard deviation of the difference scores and tα is the critical value for n-1 degrees of freedom. For a 95% confidence interval and 39 degrees of freedom tα is equal to 2.07. Plugging in all the values in Formula 2 we get 26.8±5.006. To put it simply, we can be 95% confident the actual difference of scores is between 21.8 and 31.8. These results confirm our initial intuition and demonstrate that the new design usability is better both statistically and in terms of users’ perception. In conclusion, we can affirm that our case study demonstrates how a good user experience can be crucial for users engagement. V.
C ONCLUSION AND F UTURE W ORK
A remarkable number of studies and mobile solutions have been proposed to push people to a more active and healthy lifestyle. Our work illustrates the results of an experimentation we conducted on 40 real users of Everywhere Run!. EWRun has been designed to guide runners step by step during their workouts giving them the possibility to plan quite complex regimes on their own, or to receive a custom-tailored ones
from a real trainer by means of the application. As proven by previous studies [24], users appreciate the features of the application, although, a recent radical redesign we made to the application’s and the related users’ reactions, led us to consider not only the implementation of innovative functionalities but also to keep into great account the user experience design. During a six months period, we observed a remarkable user growth even if the application offers roughly the same features offered in the past. As a consequence, we decided to compare the two designs. The test has been conducted on 40 real users by means of a standard and well known methodology, which uses a SUS questionnaire. Obtained results partially confirmed our intuition: innovative features may not be enough effective to motivate users’ without a special attention to user experience design. We are probably the first, in the field of mobile persuasive technologies, to report similar results for a real world application used by hundreds of users everyday. These results will be the very first step of our future research activity to better investigate and possibly to verify over a longer time period another fact that seems to be related to this work and deeply linked to the supplied user experience: how user experience design can alter long term users’ motivations.
[12]
[13]
[14] [15]
[16]
[17] [18]
[19] [20]
ACKNOWLEDGMENT This work is partially funded by Regione Sardegna under project SocialGlue, through PIA - Pacchetti Integrati di Agevolazione “Industria Artigianato e Servizi” (annualit`a 2010).
[21]
[22]
R EFERENCES [1] [2]
[3]
[4]
[5]
[6]
[7] [8] [9] [10]
[11]
“Android,” www.android.com, accessed: 2013-05-29. D. E. Warburton, C. W. Nicol, and S. S. Bredin, “Health benefits of physical activity: the evidence,” Canadian medical association journal, vol. 174, no. 6, pp. 801–809, 2006. R. R. Pate, M. Pratt, S. N. Blair, W. L. Haskell, C. A. Macera, C. Bouchard, D. Buchner, W. Ettinger, G. W. Heath, A. C. King et al., “Physical activity and public health,” JAMA: the journal of the American Medical Association, vol. 273, no. 5, pp. 402–407, 1995. J. J. Varo, M. A. Mart´ınez-Gonz´alez, J. de Irala-Est´evez, J. Kearney, M. Gibney, and J. A. Mart´ınez, “Distribution and determinants of sedentary lifestyles in the european union,” International journal of epidemiology, vol. 32, no. 1, pp. 138–146, 2003. A. L. Dunn, B. H. Marcus, J. B. Kampert, M. E. Garcia, H. W. Kohl III, and S. N. Blair, “Comparison of lifestyle and structured interventions to increase physical activity and cardiorespiratory fitness,” JAMA: the journal of the American Medical Association, vol. 281, no. 4, pp. 327– 334, 1999. WorldHealthOrganization, “Obesity and overweight,” www.who.int/mediacentre/factsheets/fs311/en, accessed: 2013-0529. ——, “Who-diet,” www.who.int/dietphysicalactivity/diet/en, accessed: 2013-05-29. “Android design guidelines,” developer.android.com/design/index.html, accessed: 2013-05-29. J. Allen, “Social motivation in youth sport,” Journal of Sport and Exercise Psychology, vol. 25, no. 4, pp. 551–567, 2003. A. L. Smith, “Peer relationships in physical activity contexts: A road less traveled in youth sport and exercise psychology research,” Psychology of sport and Exercise, vol. 4, no. 1, pp. 25–39, 2003. J. Brooke, “Sus-a quick and dirty usability scale,” Usability evaluation in industry, vol. 189, p. 194, 1996.
[23] [24]
[25] [26] [27] [28] [29] [30] [31] [32] [33] [34] [35] [36] [37]
F. Buttussi, L. Chittaro, and D. Nadalutti, “Bringing mobile guides and fitness activities together: a solution based on an embodied virtual trainer,” in Proceedings of the 8th conference on Human-computer interaction with mobile devices and services. ACM, 2006, pp. 29– 36. F. Mulas, P. Pilloni, and S. Carta, “Everywhere race!: A social mobile platform for sport engagement and motivation,” in SOTICS 2012, The Second International Conference on Social Eco-Informatics, 2012, pp. 63–69. Facebook, “Facebook,” http://www.facebook.com, accessed: 2013-0529. L. Chittaro and R. Sioni, “Turning the classic snake mobile game into a location–based exergame that encourages walking,” in Persuasive Technology. Design for Health and Safety. Springer, 2012, pp. 43–54. S. Consolvo, D. W. McDonald, T. Toscos, M. Y. Chen, J. Froehlich, B. Harrison, P. Klasnja, A. LaMarca, L. LeGrand, R. Libby et al., “Activity sensing in the wild: a field trial of ubifit garden,” in Proceedings of the SIGCHI Conference on Human Factors in Computing Systems. ACM, 2008, pp. 1797–1806. J. Hoysniemi, “International survey on the dance dance revolution game,” Computers in Entertainment (CIE), vol. 4, no. 2, p. 8, 2006. W. IJsselsteijn, Y. de Kort, J. Westerink, M. de Jager, and R. Bonants, “Fun and sports: Enhancing the home fitness experience,” in Entertainment Computing–ICEC 2004. Springer, 2004, pp. 46–56. “Your shape fitness evolved,” your-shape-fitness-evolved.ubi.com/2012, accessed: 2013-05-29. T. Toscos, A. Faber, S. An, and M. P. Gandhi, “Chick clique: persuasive technology to motivate teenage girls to exercise,” in CHI’06 extended abstracts on Human factors in computing systems. ACM, 2006, pp. 1873–1878. S. Consolvo, K. Everitt, I. Smith, and J. A. Landay, “Design requirements for technologies that encourage physical activity,” in Proceedings of the SIGCHI conference on Human Factors in computing systems. ACM, 2006, pp. 457–466. R. de Oliveira and N. Oliver, “Triplebeat: enhancing exercise performance with persuasion,” in Proceedings of the 10th international conference on Human computer interaction with mobile devices and services. ACM, 2008, pp. 255–264. Nike, “Nike+ gps,” nikerunning.nike.com, accessed: 2013-05-29. F. Mulas, S. Carta, P. Pilloni, and L. Boratto, “Everywhere run!: a virtual personal trainer for supporting people in their running activity,” International Journal of Advanced Computer Science, vol. 3, no. 2, 2013. “Runtastic,” www.runtastic.com, accessed: 2013-05-29. “Endomondo,” www.endomondo.com, accessed: 2013-05-29. “Runkeeper,” runkeeper.com, accessed: 2013-05-29. “Mapmyfitness,” www.mapmyfitness.com, accessed: 2013-05-29. “micoach,” www.adidas.com/fi/micoach, accessed: 2013-05-29. Wikipedia, “Student’s t-test,” https://en.wikipedia.org/wiki/Student’s ttest, accessed: 2013-05-29. “Everywhere race!” www.everywhererace.com, accessed: 2013-05-29. “Everywhere run!” www.everywhererun.com, accessed: 2013-05-29. J. Sauro and J. R. Lewis, Quantifying the user experience: Practical statistics for user research. Morgan Kaufmann, 2012. Wikipedia, “Normal distribution,” https://en.wikipedia.org/wiki/Normal distribution, accessed: 2013-05-29. J. Sauro, “Measuring usability with the system usability scale (sus),” www.measuringusability.com/sus.php, accessed: 2013-05-29. Wikipedia, “P-value,” http://en.wikipedia.org/wiki/P-value, accessed: 2013-05-29. “Evwrywhere run!’s sus questionnaire,” bit.ly/ewrunsus, accessed: 2013-05-29.