Hierarchical shape modeling of the cochlea and surrounding risk structures for minimally invasive cochlear implant surgery Juan J. Cerrolaza1, Sergio Vera2, Alexis Bagué3, Mario Ceresa3, Pablo Migliorelli2, Marius George Linguraru1, Miguel Ángel González Ballester3 1
Sheikh Zayed Institute for Pediatric Surgical Innovation, Children´s National Health System, Washington DC, USA !"#$%%&’()*+,*-&%./0 2 Alma IT Systems, Barcelona, Spain 3 Pompeu Fabra University, Barcelona, Spain
Abstract. Knowing the anatomical shape and position of structures surrounding the cochlea is essential in planning minimally invasive cochlear implant surgery. In this work, a Multiobject Hierarchical Statistical Shape Model (MOSSM) based of wavelet decomposition is created from clinical cone-beam CT datasets of the inner, middle and outer auditory system and surrounding structures. The methodology incorporates an algorithm that automatically segregates structures as the level of detail is increased, leading to a global description of the whole surgical site at the lowest resolution and detailed anatomic models at the highest resolution. This model is the basis for the automatic segmentation of patient data, allowing to quantify the relative position of risk structures in planning the intervention. Keywords: Statistical shape models, cochlear implants, auditory system.
1
Introduction
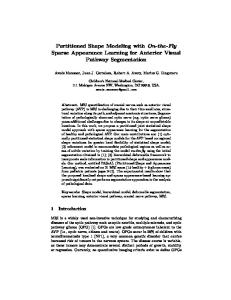
According to the World Health Organization [1], hearing loss or impairment is one of the most common reasons for disability. About one-quarter of men and women over 45 year old suffers from hearing loss of 26dB and more. Hearing loss is caused by deficits in any of the links of the hearing chain, either inner, middle or outer ear structures. When external hearing aids do not sufficiently mitigate hearing loss caused by hearing deficits in the sensorineural cochlea, which is the auditory organ inside the inner ear, patients could benefit from cochlear implants (CI). Imaging techniques used in clinical routine, such as Cone-beam CT (CBCT), provide enough resolution and context to allow us to capture the structures of interest during the surgical approach to the inner ear, that is the temporal bone, external auditory canal, facial nerve, chorda tympani, ossicles, round window membrane, sigmoid sinus and middle fossa dura (Fig.1). Knowing the anatomical shape and position of structures surrounding the cochlea is needed to plan the best minimally invasive surgical procedure in the mastoid region of the patient (Fig.1.a). In this sense, surgeons can reduce the co-morbidity adfa, p. 1, 2011. © Springer-Verlag Berlin Heidelberg 2011
in patients using direct cochlear access through guided drilling to the inner ear. In this procedure, the most feasible entry path for accurate drill/insertion trajectory is through the facial recess, as shown in Fig.1.b. Safely preserving these structures surrounding the cochlea is of paramount importance for the success of the surgery. For example, damage to the facial nerve would cause temporal or permanent paralysis of half of the face and braching the external auditory canal could cause ear infection [5].
Fig. 1. The inner ear: (a) CBCT of the temporal bone. External ear canal (1), ossicles (2), cochlea (3), and temporal bone (4). (b) Example of preoperative planning including direct cochlear access trajectory through the facial recess.
Since its inception in the early 1990s, point distribution models (PDMs) have proven effective for modeling and analyzing the variability of anatomical structures in medical imaging data, allowing to describe the underlying population statistics from a set of training cases. Based on PDMs, two statistical model of the cochlea were recently proposed by Nobel et al. [10], and Poznyakovskiy et al. [11]. However, none of the surrounding organs from the external and middle ear was included in the models, which limits their utility for preoperative planning. One of the most recent extensions of PDMs has been the development of multiobject statistical shape models, where the characterization of the relations between subparts provide valuable additional information compared to the single-object modeling approach (i.e., ignoring the interaction between adjacent objects). When modeling the cochlea and the surrounding structures, the accurate modeling of the interactions between objects can help to not only adequately deal with undefined intermediate regions but also extract the relevant anatomic relationship between inner structures of potential relevance in planning surgery. However, the classical PDM approach considering a multiobject structure globally (i.e., as a single object) becomes inefficient when a large training set is not available, as is usually the case when working with 3D multiobject structures. This problem is known as the High Dimension Low Sample Size (HDLSS) reduction problem. For our purpose, good model instance accuracy is essential, due to the narrow space between anatomical structures and anatomic shape differences between individuals. Based on the recent work of Cerrolaza et al. [4, 6], we present a multiresolution hierarchical PDM as an alternative to the classical PDM. This new framework, named generalized multiresolution hierarchical PDM (GMRH-PDM) [6], allows to efficiently characterize the different inter-object relationships, as well as the particular locality of each structure separately. In particular, the model presented here includes the cochlea at the inner ear and three surrounding risk structures: the ear canal at the external ear, the ossicles at the middle ear, and the facial nerve. Finally, the performance of the
new model is evaluated in terms of its capability to represent real cases form our database, as well as its potential to generate new valid instances from the underlying population.
2 2.1
Materials and Methods Dataset and Manual Segmentation
Cone-beam CT (CBCT) images of the temporal bone region, acquired from 7 specimens using ProMax 3D Max System (Planmeca, Finland) were used for this study. The images have an isotropic voxel size of 0.15mm, sufficient to capture the details of the anatomical structures of interest (Fig.1). The manual delineation of the structures included in the study is essential for creating a reliable and accurate statistical model. For this purpose, the surrounding structures of the cochlea were segmented using the Otoplan software tool [5]. The ossicles (incus and malleus) were segmented as a single structure, due to their small size, using an intensity-based region growing algorithm after initial seed selection. The external auditory canal (EAC) wall surface was computed from 3 points in the axial view. These points form a plane which moves radially from the ear canal axis. Points were labeled as EAC if their intensity values reached the mastoid bone threshold. For surgical purposes, only the piece of wall located in the facial recess trajectory is segmented. To segment the facial nerve, 10 points were manually selected following its centerline. Finally, the cochlea structure was segmented using the software Seg3D [9]. In particular, a threshold between -300 and +100HU was found useful to separate the cochlea and background/air from the bone. Connected components analysis of the resulting binary mask volume allowed to differentiate the cochlea and labyrinth from the background/air areas of the temporal bone. Once the structures of interest were segmented, the definition of landmarks was performed by means of an iterative cubic B-spline non-rigid registration, defining one of the cases as the initial reference, and using the average shape as reference in subsequent iterations. 2.2
Generalized Multiresolution Hierarchical PDM
The original framework proposed by Cerrolaza et al. [6] integrates multiresolution shape analysis into the classical PDMs. By decomposing the multiobject structure into levels with different degree of detail, it is possible to establish different degrees of association between objects, and thus efficiently model both the statistical inter-object relationship and the particular local variations of each single object. Unlike the original framework proposed in [4], where the capability to model variability in subparts of a single object was limited, as they considered the single objects as the simplest structure to model at the finest resolution levels, the new GMRH-PDM relaxes this condition allowing any possible grouping of landmarks. Next, we present a general overview of the GMRH-PDM. The reader is referred to [4, 6] for a more detailed description of the framework.
Let ࢞ be the vector form of a 3D shape defined by א ܭԳ landmarks. In the general case of a multiobject shape composed of א ܯ ( ܯԳ ) single-object structures, ࢞ (ͳ ݆ )ܯ, ࢞ is defined by the concatenation of the 3 coordinates of the ܭ אԳ landmarks ൫ ܭൌ � σ ܭ ൯ that define each object, i.e. ࢞ ൌ ሺ࢞ଵ Ǣ ǥ Ǣ ࢞ெ ሻࢀ . Using the matrix notation initially proposed by Lounsbery et al. [7], the multiresolution analysis of ࢞ can be formulated as : ܠ୰ ൌ ࢞ିଵ and ࢠ ൌ ࢞ିଵ , where א ݎԳ indicates the level of resolution (in particular ݎൌ Ͳ defines the finest level of resolution, and thus, ࢞ ൌ ࢞), and and represent the analysis filters. The first equation implements the filtering and downsampling of ࢞ିଵ , providing a lower resolution version of it (i.e., ܭିଵ ܭ , where ܭ אԳ represents the number of landmarks at the resolution level )ݎ, while ࢠ captures the lost detail between ࢞ and ࢞ିଵ. An optimal selection of these analysis filters guarantees that no information is lost during the process, being possible to reverse the analysis process with the synthesis equation: ࢞࢘ି ൌ ࡲ ࢞ ࡳ ࢠ . With this method, it is possible to decompose any multiobject structure into different levels of resolution. At each level of resolution ݎ, we define a particular division of the ܭ landmarks into ܯ separate clusters, ൫ࡿଵ ǡ ǥ ǡ ࡿெೝ ൯ , where ࡿ௦ ( ݏൌ ͳǡ ǥ ǡ ܯ ) is formed by the indices of the landmarks contained in this subset, and ெೝ ெೝ therefore, ځ௦ୀଵ ࡿ௦ ൌ and ڂ௦ୀଵ ࡿ௦ ൌ ሺͳǡ ǥ ǡ ܯሻ . The automatic division of the landmarks into separate clusters at each resolution is based on the agglomerative hierarchical clustering method proposed in [6], where the criterion for choosing the pair of clusters to merge at each step is controlled by the minimum value of the tailored objective function: �
ܬሺߗሻ ൌ � ߙଵ ఆ ቀ
ȁࢂ ൈࢂ ȁ ଶ ೌೣ ቁ ȁࢂ ȁ ݀݅ ȁࢂ ȁ
ߙଶ ൬ͳ െ
�
ௗ �
ࡿௗ
൰ ߙଷ ܪሺߗሻ
(1)
where ߙଵ ǡ ߙଶ �and ߙଷ are real values such that σ ߙ ൌ ͳ. ߗ ࡿ كrepresents a region or subdomain within the set of landmarks ࡿ we want to divide into an optimal set of clusters. The first component of (1) takes into account the colinearity between deformation vectors, ࢂ , and the predominant vector direction ࢂఆ in ߗ . ܮ௫ ൌ ݉ܽ ࡿݔሼԡࢂ ԡሽ, and ࢂఆ is defined as the highest eigenvalue of the matrix ܯሺߗሻ ൌ � ఆ ࢂ � ࢂ ௧ ݀݅. The second term in (1) acts as a maximal area constraint, and the third term, ܪሺߗሻ, defined as the Hausdorff distance between the objects that compose ߗ, promotes the grouping of objects that are spatially close. Finally, the optimal landmark partition is based on the following tailored definition of the Silhouette coefficient for each landmark ݈ ݏ =�
ிቀቄ�ቀఆೕశ ቁିሺఆೕ ሻቅቁିிቀሺఆ ሻିሺఆ̳ ሻቁ
௫ቄቄ�ቀఆೕశ ቁିሺఆೕ ሻቅǡ���ிቀሺఆ ሻିሺఆ̳ ሻቁቅ
(4)
where ߗ̳ represents the cluster ߗ after removing ݈ , and ܨܮሺήሻ is the logistic function. Since a value of ݏ close to ͳ means that ݈ is appropriately clustered in ߗ , the optimal clustering of ࡿ will be the one that maximizes the average ݏ . Let now ࢞ be the vector form of the auditory system we are modeling, whose multiresolution decomposition ሼ࢞ ൌ ࢞ ǡ ࢞ଵ ǡ ǥ ǡ ࢞ோ ǡ���ࢠଵ ǡ ǥ ǡ ࢠோ ሽ, is obtained using the analysis equations.
Imposing the initial condition that ܯோ ൌ ͳ (i.e., a global statistical shape model of the whole set is built at the coarsest resolution in order to guarantee the coherent disposition of the elements), a new landmark subdivision scheme is calculated at resolution ݎ-1 for each of the ܯ subsets (ࡿ௦ ǡ ݏൌ ͳǡ ǥ ǡ ܯ ) obtained at ݎ. Finally, the statistical തതത௦ ǡ ࡼ௦ ǡ ߣ௦ǡ ൟ , model of the shape is created building a different PDM for every ࡿ௦ : ൛࢞ തതത௦ represents the mean shape, ࡼ௦ the set of T eigenvectors, and ߣ௦ǡ , the correwhere ࢞ sponding eigenvalues (݅ ൌ ͳǡ ǥ ǡ ܶ). One of the main purposes of the statistical shape model of the auditory system we are presenting, is to ensure the legitimacy of the segmentation of the inner ear obtained from a new patient, ࢟ (e.g., using Active Shape Models [2]). Suppose that we want to use the new GMRH-PDM to describe a new case, ࢟, i.e., finding the best approximation of ࢟ in the subspace of allowed shapes described by the statistical model. Starting from the finest resolution, ࢟ is divided into the ܯ subsets previously defined, each of them corrected by the corresponding PDM. This process is repeated at each resolution until ݎൌ ܴ. In the transition of each resolution, the high frequency component of the new constrained shape, ࢠොଵ , will be used to recover the original resolution at the end of the process using the synthesis equation presented above. An interesting application of a robust statistical shape model is the possibility of generating new valid instances of the structure under study, providing useful anatomical information of the organs involved, and the interaction between them. In the classical approaches where a single PDM is created this generative process is relatively simple since new instances ࢞ can be generated by varying the values of the shape ഥ ࡼ ή ࢈, vector, ࢈¸ within the limits defined by the eigenvalues (ȁܾ ȁ ߚඥߣ ): ࢞ ൌ ࢞ where generally ߚ אሾͳǡ͵ሿ. However, despite the higher potential of GMRH-PDM to generate new instances, the procedure is also more complex. Suppose we are using a fine-to-coarse approach. Thus, at each resolution, r , we should proceed as follows. i) Generate new instances for each cluster: ࢞௦ ൌ തതത ࢞௦ ࡼ௦ ή ࢈௦ . ii) Map ࢞௦ to the shape ഥ (i.e., the decomposition of ࢞ ഥ at resolution r). This can be done by space defined by ࢞ തതത௦ and the set of landmarks from ࢞ ഥ included in simple Procrustes analysis between ࢞ ࡿ௦ . The union of all the mapped clusters defines ࢞ , i.e., the provisional estimation of the new instance at this resolution. iii) Obtain ࢠାଵ �from ࢞ . iv) Rebuild the final version of the new instance using the synthesis equation. 2.3
Multiresolution decomposition of the auditory system
Even when working with a limited number of organs, the auditory system is a very complex structure, and the typical landmark-based parameterization may be inefficient. In this work, we use an alternative parameterization for some structures, whose geometry can be described more efficiently by means of control points. In particular, the tubular structure of the facial nerve and the three semicircular canals of the cochlea (i.e., the superior, posterior and horizontal canal), are described as a B-spline curve with 17 equidistant control points located in the central axis, using B-spline wavelets to create the multiresolution decomposition. Similarly, the surface described by the auditory canal is parameterized by means of a 4×4 grid of control points. For the ossicles, and the cochlea, the multiresolution domain is defined using the octahe-
dron as the reference mesh, with a 4-to-1 splitting step, and a lifter butterfly scheme for triangular meshes [7], using 258 landmarks at the finest resolution.
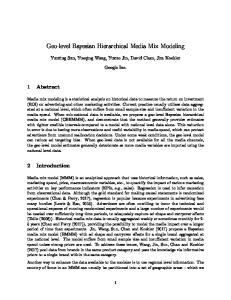
Fig. 2. (a) Multiresolution hierarchical configuration of the auditory system obtained via GMRH-PDM. At each level of resolution, each color represents a different cluster of landmarks modeled jointly via PDM. At resolution ࢞ଵ , the cochlea is in navy, the ossicles in cyan, the facial nerve in yellow, and the auditory canal in dark red. (b) Detail of the clusterization of the ossicles and the cochlea obtained at the finest resolution, (࢞ ).
Finally, we create a 3-levels multiresolution statistical shape model of the auditory system (ܴ ൌ ʹ), using 0.8, 0.1 and 0.1 as configuration parameters in (3), i.e., ߙଵ ǡ ߙଶ and ߙଷ , respectively. These values were defined empirically, based on the general guidelines provided by [6]. The resulting automatic configuration is shown in Fig.2. To guarantee overall structural coherence of the elements, all objects are modeled together at the coarsest resolution (࢞ଶ ). As we move towards finer resolutions, the structure is divided into smaller sets, modeling each anatomical object separately at ݎൌ ͳ (࢞ଵ ). At ݎൌ Ͳ, smaller clusters of landmarks are defined on each anatomical object, allowing the model to represent small variances more accurately. At the finest resolution, it is possible to observe an anatomical correspondence between the clusters obtained and the different anatomical subregions of the ossicles: malleus (light blue), handle of malleus (red), long process of incus (light orange); and the cochlea: semicircular canals (yellow, green and dark blue), cochlear duct (dark blue), tympanic duct (light green) (see. Fig. 1.b).
3
Results and Discussion
The ability of the new statistical shape model to represent new instances of the underlying population is evaluated in terms of the average landmark-to-landmark distance (L2L), the landmark-to-surface distance (L2S), and the Dice coefficient (DC), using leave-one-out cross-validation. Table 1 shows the results obtained for each one of the organs included in this study. The average L2L error for each landmark is shown in
Fig. 3(a). As it can be observed in Table 1, a better accuracy is obtained for the cochlea (including the cochlear canals) and the ossicles, with an error below 0.45 mm (L2L and L2S), and a DC greater than 0.78. On the other hand, the facial nerve and the auditory canal have an average L2S error of 1.16 mm and 1.17 mm, respectively. In the context of surgical planning of cochlear implants, the narrow space between risk structures results in a need of systems with high accuracy, preferably below 1mm [8]. The promising results obtained for the cochlea and ossicles shows the potential of the statistical model presented here for such demanding applications, though further work is needed in order to improve the accuracy in the remaining structures, the facial nerve and the auditory canal. Finally, as Section 2.2 indicates, the new statistical model generated via GMRH-PDM is able to generate a wide variety of new valid instances thanks to the multiresolution shape decomposition and the creation of small clusters of landmarks, of great utility in the anatomical study of the auditory system, and the spatial relationship between the organs. Fig. 3(b) shows a set of new cases randomly generated by the model (ߚ ൌ ʹ). These instances were evaluated by an expert radiologist who verified satisfactorily the anatomical validity of the structures. Table 1. Accuracy Evaluation of the statistical shape model. Landmark-to-landmark (L2L) distance, landmark-to-surface (L2S) distance, and Dice coefficient (DC) for the seven objects considered here: cochlea, superior canal (Sup. C.), posterior canal (Pos. C), horizontal canal (Hor. C), ossicles (Oss.), facial nerve (Facial N.) and auditory canal (Audit. C). The Audit. C is represented by an open surface, so no DC can be calculated. Cochlea
Sup. C.
Pos. C.
Hor. C
Oss.
Facial. N.
Audit. C.
L2L (mm)
0.32±0.06
0.64±0.12
0.60±0.12
0.75±0.24
0.45±0.11
1.15±0.19
1.30±0.41
L2S (mm)
0.25±0.04
0.64±0.11
0.55±0.12
0.72±0.20
0.38±0.10
1.16±0.31
1.17±0.35
DC
0.89±0.02
0.75±0.03
0.76±0.07
0.70±0.14
0.78±0.04
0.60±0.10
-
4
Conclusion
Cochlear implantation requires accurate planning of the surgical intervention in order to reduce co-morbidity in patients when using direct cochlear access through guided drilling to the inner ear. Therefore, knowledge of the anatomical shape and location of the surrounding structures is essential. Based on the new GMRH-PDM framework, this paper presents a new statistical shape model of the auditory system consisting of the cochlea, the ossicles, the facial nerve, and the auditory canal. This new approach allows to describe efficiently the variability of the structures under study at different levels of resolution, guaranteeing that only valid instances are generated. In this paper we show the potential of the new statistical model of the auditory system to model new instances (average L2S error = 0.70±0.36mm), even when a limited number of training cases is available. We plan to continue exploiting the capacity of the multiresolution hierarchical modeling to create a more complete anatomical model of the auditory system, including other important organs like the temporal bone, and the chorda tympani.
Fig. 3. Performance characterization of the statistical shape model of the auditory system. (a) Average L2L error for each landmark. (b) Example of the ability of the GMRH-PDM to generate new valid instances of the auditory system (ߚ ൌ ʹ).
Acknowledgment. This project was supported by a philanthropic gift from the GovHUQPHQW� RI� $EX� 'KDEL� WR� &KLOGUHQ¶V� 1DWLRQDO� +HDOWK� 6\VWHP�� DQG� E\� WKH� (XURSean Union FP7 project HEAR-EU (grant agreement 304857).
5
References
1. ³7KH�JOREDO�EXUGHQ�RI�GLVHDVH�´�:RUOG�+HDOWK�2UJDQL]DWLRQ������� 2. Cootes,T.F. et al..: Active Shape ModelsTheir Training and Application. Comput. Vis. Image Underst. 61(1), 38-59 (1995) 3. N. Duta and M. Sonka, Segmentation and interpretation of MR brain images an improved active shape model. IEEE Trans. Med. Imag., 17(6), 1049±1062.(1998) 4. Cerrolaza, J.J., et al.: Hierarchical Statistical Shape Models of Multiobject Anatomical Structures: Application to Brain MRI. IEEE Trans. Med. Imaging 31(3), 71±724 (2012). 5. Gerber, Net al.. (2014). Surgical planning tool for robotically assisted hearing aid implantation. Int. Jour. of Comp. Ass. Rad. and Sur, 9(1), 11±20. (2013) 6. Cerrolaza, J., et al.. Generalized Multiresolution Hierarchical Shape Models via Automatic Landmark Clusterization. MICCAI 2014 (2014) (in press) 7. Dyn, N. et al.: A Butterfly Subdivision Scheme for Surface Interpolation with Tension Control. ACM Trans. Graph. 9(2), 160±169, (1990) 8. Noble, J. H., et al.: Automatic Determination of Optimal Linear Drilling Trajectories for Cochlear Access Accounting for Drill Positioning Error. Int. J. Med. Robot. 6(3), 281-290, (2011) 9. Center for Integrative Biomedical Computing (CIBC), University of Utah Scientific Computing and Imaging (SCI) Institute, "Seg3D: Volumetric Image Segmentation and Visualization," 2013. [Online]. Available: http://www.seg3d.org. 10. Noble, J. H., et al.: Statistical shape model segmentation and frequency mapping of cochlear implant simulation targets in CT. MICCAI 2012. 15(Pt 2):421-428 (2012) 11. Poznyakovskiy, A.A., et al. Statistical shape modeling of human cochlea: Alignment and principal component analysis. In proc. SPIE 8670 Medical Imaging (2013).