Cet article est disponible en ligne à l’adresse : http://www.cairn.info/article.php?ID_REVUE=REL&ID_NUMPUBLIE=REL_734&ID_ARTICLE=REL_734_0369
Heterogeneous anchoring in dichotomous choice valuation framework par Emmanuel FLACHAIRE, Guillaume HOLLARD, et Stéphane LUCHINI | De Boeck Université | Recherches économiques de Louvain 2007/4 - Volume 73 ISSN 0770-4518 | ISBN 2-8041-5454-7 | pages 369 à 385
Pour citer cet article : — Flachaire E., Hollard, G. et Luchini S., Heterogeneous anchoring in dichotomous choice valuation framework, Recherches économiques de Louvain 2007/4, Volume 73, p. 369-385.
Distribution électronique Cairn pour De Boeck Université. © De Boeck Université. Tous droits réservés pour tous pays. La reproduction ou représentation de cet article, notamment par photocopie, n'est autorisée que dans les limites des conditions générales d'utilisation du site ou, le cas échéant, des conditions générales de la licence souscrite par votre établissement. Toute autre reproduction ou représentation, en tout ou partie, sous quelque forme et de quelque manière que ce soit, est interdite sauf accord préalable et écrit de l'éditeur, en dehors des cas prévus par la législation en vigueur en France. Il est précisé que son stockage dans une base de données est également interdit.
Heterogeneous anchoring in dichotomous choice valuation framework Emmanuel Flachaire *, Guillaume Hollard **, Stéphane Luchini ***
1
Introduction
Anchoring is a general phenomenon put forward by Tversky and Kahneman (1974): “In many situations, people make estimates by starting from an initial value that is adjusted to yield the final answer. The initial value, or starting point, may be suggested by the formulation of the problem, or it may be the result of a partial computation. In either case, adjustments are typically insufficient. That is, different starting points yield different estimates, which are biased toward the initial values. We call that anchoring”. This anchoring problem affects, in particular, survey methods, designed to elicit individual willingness to pay (WTP) for a specific good. Among such surveys, by far the most popular one is the contingent valuation (CV) method. Roughly speaking, this method consists of a specific survey that proposes respondents to consider a hypothetical scenario that mimics a market situation. A long discussion has taken place that analyzes the validity of the contingent valuation method in eliciting individual willingness to pay 1. In the dichotomous choice CV method, the presence of anchoring bias implies that, “confronted with a dollar figure in a situation where he is uncertain about an amenity’s value, a respondent may regard the proposed amount as conveying an approximate value of the amenity’s true value and anchor his WTP amount on the proposed amount” (Mitchell and Carson 1989). Herriges and Shogren (1996) propose a model that takes into account the effect of anchoring. It turns out that there is an important loss of efficiency in the presence of substantial anchoring. The purpose of this paper is to address this issue. * ** ***
1
Paris School of Economics, University of Paris I Paris School of Economics, University of Paris I, CNRS GREQAM-IDEP-CNRS September 2006 Corresponding author: Emmanuel Flachaire, EUREQUA, Maison des Sciences Economiques, 106-112 bd de l’Hopital, 75647 Paris Cedex 13, France. tel: +33-144078214, fax: +33-144078231, e-mail:
[email protected] See Mitchell and Carson 1989, Hausman 1993, Arrow et al. 1993, Bateman and Willis 1999
369
370 ____________ Recherches Économiques de Louvain – Louvain Economic Review 73(4), 2007
To the best of our knowledge, anchoring has always been considered as a phenomenon affecting the population as a whole. Little attention has been paid to the fact that some individuals may anchor their answers while others may not 2. The assumption of homogeneous anchoring may be hazardous as it may lead to econometric problems. Indeed, it is well known in standard regression analysis that individual heterogeneity can be a dramatic source of misspecification and, if it is not taken into account, its results can be seriously misleading. In the context of this paper, the presence of two groups or types of people (those who are subject to anchoring and those who are not), is a type of individual heterogeneity that could affect empirical results in CV surveys. The major issue is how to conceive a measurement of individual heterogeneity with respect to anchoring. In other words, if we assume that individuals are of two types, then the question is how can we identify these two distinct groups of people in practice? In this paper, we propose to develop a methodology that borrows tools from social psychology that will allow us to identify the two groups of people. Using the dichotomous choice model developed by Herriges and Shogren (1996), we control for anchoring for each group separately. A noticeable empirical result of our methodology is that when we allow the degree of anchoring to differ between those two groups, the efficiency of the doublebounded model improves considerably. This contrasts with previous research that finds that the efficiency gains from the double-bounded model are lost when anchoring is controlled for. The paper is organized as follows. In section 2, we review some possible sources of heterogeneity in the context of anchoring. Then, we concentrate on a particular form of heterogeneity and we present the methodology that we use to identify it in practice. In section 3, we extend the model proposed by Herriges and Shogren (1996) in order to develop a specific econometric model with heterogeneous anchoring. Finally, in section 4, we apply our methodology and econometric model to a French dedicated CV survey. Conclusions are drawn in section 5.
2
Conformism as a source of heterogeneity
Heterogeneity can be defined in many different ways. In this section, we are interested in a form of heterogeneity linked to the problem of anchoring, 2
Grether (1980) studies decisions under uncertainty and shows that, although the representativeness heuristic explains some of the individuals’ behaviors, Bayesian updating is still accurate for other individuals. He suggests that, being familiar with the evaluation of a specific event (in his case, acquired through repeating evaluations in the experiment) leads to more firmly held opinions and, consequently, to a behavior more in line with standard economic assumptions. This is also what John List suggests when he compares the behavior of experienced subjects (through previous professional trade experiences) and unexperienced subjects (List 2004)
Emmanuel Flachaire, Guillaume Hollard, Stéphane Luchini ________________________371
that is to say involving the behavior of survey respondents induced by the survey itself. More precisely, we would like to investigate whether there is heterogeneity with respect to the degree of anchoring on the bid in the initial valuation question. Thus, a clear distinction should be made between heterogeneity that leads to different anchoring behaviors and heterogeneity that relates to WTP directly. The latter sort of heterogeneity can be treated, as in standard linear regression models, by the use of regressor variables in specific econometric models and is not related at all to the problem of anchoring. The type of heterogeneity we are interested in here, however, calls for a treatment of a different nature. The economic literature on contingent valuation in particular, and on survey data in general, often mentions a particular source of heterogeneity. This source concerns the fact that some individuals may hold a “steadier point of view” than others. Alternatives versions are “more precise beliefs”, “higher level of self-confidence”, “well defined preferences”, etc. A good example of such a notion is “one might expect the strongest anchoring effects when primitive beliefs are weak or absent, and the weakest anchoring effects when primitive beliefs are sharply defined” (Green et al. 1998). It is quite clear that all these statements share some common feature. However it seems that economic theory lacks a precise definition of this, even if the notions mentioned are very intuitive. Thus, many authors are confronted with a “missing notion” since economic theory does not propose a clear definition of this type of human characteristic. Psychology proposes a notion of “conformism to the social representation” that could fill this gap. In order to test if an individual representation is a rather conformist one, we compare it to the so called “social representation”. Individuals whose representation differs from the social representation could be considered as “non-conformists”. The basic idea, supported by social psychology, is that individuals who differ from the social representation are less prone to be influenced 3. It leads us naturally to wonder if individuals that are less prone to be influenced are also less prone to anchoring. Before testing this last hypothesis with an econometric model, we develop a method to isolate “non-conformist” individuals.
2.1
Method
Individuals have, for each particular subject, a representation (i.e. a point of view). Representations are defined in a broad sense by social psychologists 4, since an individual representation is defined as a form of knowledge that can serve as a basis for perceiving and interpreting reality, as well as for orienting
3 4
Moscovici (1998a, 1998b) Moscovici (1961, 1998a), Farr (1998), Viaud and Roland-Levy (2000)
372 ____________ Recherches Économiques de Louvain – Louvain Economic Review 73(4), 2007
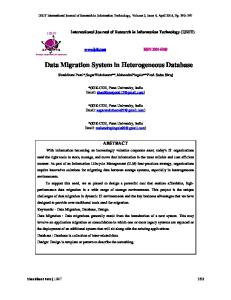
one’s behavior. This representation may either be composed of stereotypes or of more personal views. The general principle that underlies the above methodology consists of detecting individuals who hold a representation of the object to be evaluated that differs from that of the majority. The methodology allows us to identify an individual who holds a representation which differs from the majority one. We restrict our attention here to a quantitative approach using an open-ended question. This is the usual way to gather quantitative information on an individual representation at low cost (Vergès 1994). After cleaning the data, we use an aggregation principle in order to establish the majority point of view (which is a proxy for the so called social representation). Then it is possible to compare individual and social representations. Using a simple criterion, we sort individuals into two sub-samples. Those who do not differ from the majority point of view are said to be in conformity with the majority while the others are said to be different from the majority. The methodology consists of four steps summarized in figure 1 and described in detail in what follows. Step 1: A representation question At a formal level, an individual representation of a given object is an ordered list of terms that one freely associates with the object. Such a list is obtained through open-ended questions such as “what does this evoke to you?”. Step 2: Classification As mentioned above, an individual representation is captured through an ordered list of words. A general result is that the total number of different words used by the sample of individuals considered is quite high (say 100 to 500 depending on the complexity of the object). This imposes a categorization that puts together words that are close enough in meaning. This step is the only one which leaves the researcher with some degrees of freedom. After the categorization, each individual’s answer is transformed into an ordered list of categories. It is then possible to express an individual representation as an ordered list of categories, rather than words. However, at the end of this categorization, we are left with individual representations containing doubles, i.e. individual representations with several attributes which belong to the same category. To obtain transitive individual representations, we need to suppress the less ranked citations belonging to the same category. Those individual representations, namely ordered lists of words, could at a formal level be considered as an ordinal preference over the set X of possible categories. As the question that is used to elicit individual representation is open-ended, individual lists could be of various length. So, preferences could be incomplete. Those individual representations will in turn aggregate to form the social representation.
Emmanuel Flachaire, Guillaume Hollard, Stéphane Luchini ________________________373
Figure 1: Methodology
Step 3: Aggregating representations Using a majoritarian device 5, it is possible to proceed in a non ambiguous manner in order to identify the social representation on the basis of individual ones. A social representation, whenever it exists, will then be a complete and transitive order over the set X. An important property of the majority principle is that it may lead to non transitive social preferences, the so called Condorcet paradox. Indeed, X may be ranked before Y at the social level and Y ranked before another attribute Z with X not ranked before Z 6. Further results even show that 5
6
The majority principle will then consist of a pairwise comparison of each of the attributes. For each pair ( X, Y ) , the number of individuals who rank X before Y is compared to the number of individuals who rank Y before X . The individuals who do not cite either X or Y since incomplete individual representation may exist do not contribute to the choice between X and Y . Adding to this, when an individual cites X and not Y , X is considered as superior to Y . See Laslier (1997) for details.
374 ____________ Recherches Économiques de Louvain – Louvain Economic Review 73(4), 2007
the probability of getting a transitive social preference becomes very small as the number of elements in X grows. We will then consider the use of the majority principle as a test for the existence of a social representation: if a set of data leads to a transitive social representation, the social representation is coherent. Step 4: Segmentation Thanks to our previous results, it is possible to sort individuals according to the way they build their representations. In order to do so, we consider individuals who do not refer to the Condorcet winner (i.e. the top element of the social representation). Recall that preferences are incomplete, so that a typical individual preference does not display all of the elements of X , otherwise all individuals include the Condorcet winner in their preference. In practice, the Condorcet winner refers to elements obviously associated to the object, i.e among the very first words that come to mind when talking about the object. We are then left with two categories of individuals. This leads to a breakdown of individuals into two sub-samples: the ones who did mention the Condorcet winner (conformists) and the ones who did not (non-conformists). Finally, one has a dummy variable that sorts individuals into two categories and that identifies individual heterogeneity. It remains for us to test if such a variable can indeed play a role in anchoring bias, based on a specific econometric model. We develop such a model in the next section.
3
Econometric Models
There exist several ways to elicit individuals’ WTP in CV surveys. The use of discrete choice format in contingent valuation surveys is strongly recommended by the work of the NOAA panel (Arrow et al. 1993). It consists of asking a bid to the respondent with a question like if it costs $ x to obtain …, would you be willing to pay that amount? Indeed, one advantage of the discrete choice format is that it mimics the decision making task that individuals face in everyday life since the respondent accepts or refuses the bid proposed. One drawback of this discrete choice format is that it leads to a qualitative dependent variable (the respondent answers yes or no) which reveals little about individuals’ WTP. In order to gather more information on respondents’ WTP, Hanemann (1985) and Carson (1985) proposed to add a follow-up discrete choice question to improve efficiency of discrete choice questionnaires. This mechanism is known as the double bounded model. This basically consists of asking a second bid to the respondent, greater than the first bid if the respondent asked yes to the first bid and lower otherwise.
Emmanuel Flachaire, Guillaume Hollard, Stéphane Luchini ________________________375
The key disadvantage of the double-bounded model is that individuals may anchor their answers to the second bid on the first bid proposed. Herriges and Shogren (1996) show that, in the presence of anchoring bias, information provided by the second answer is lost such that the single bounded model can become more efficient than the double bounded model. In this section, we present these different models proposed in the literature: the single bounded, double bounded models and the Herriges and Shogren (1996) anchoring model. Finally, we develop an econometric model of anchoring that depends upon individual heterogeneity.
3.1
Single bounded model
Let us first consider W i , the individual i ’s prior estimate of his willingness to pay, which is defined as follows Wi = xi ( β ) + ui
(1)
σ2
where the unknown parameters β and are respectively a k × 1 vector and a scalar, where x i is a non-linear function depending on k independent explanatory variables. The error term u i are Normally distributed with mean zero and variance σ 2 . The number of observations is equal to n and the error terms u i are Normally distributed with mean zero and variance σ 2 . In the single bounded mechanism, the willingness to pay (WTP) of the respondent i is not observed, but his answer to the bid b i is observed. The individual i answers yes to the bid offer if W i > b i and no otherwise.
3.2
Double bounded model
The double bounded model, proposed by Hanemann (1985) and Carson (1985), consists of asking a second bid (follow-up question) to the respondent. If the respondent i answers yes to the first bid, b 1i , the second bid b 2i is higher and lower otherwise. The standard procedure, Hanemann (1985) and Carson (1985), assumes that respondents’ WTPs are independent of the bids and deals with the second response in the same manner as the first discrete choice question, W 1i = x i ( β ) + u i
and W 2i = W 1i
(2)
The individual i answers yes to the first bid offer if W 1i > b 1i and no otherwise. He answers yes to the second bid offer if W 2i > b 2i and no otherwise. Hanemann, Loomis, and Kanninen (1991) compare the double bounded model with the single bounded model and show that the double bounded model can yield efficiency gains.
376 ____________ Recherches Économiques de Louvain – Louvain Economic Review 73(4), 2007
3.3
Anchoring model
The double bounded model model assumes that the same random utility model generates both responses to the first and the second bid. In fact, introduction of follow-up questioning can generate inconsistency between answers to the second and first bids. To deal with inconsistency of responses, Herriges and Shogren (1996)’s approach considers a model in which the follow-up question can modify the willingness to pay. According to them, respondents combine their prior WTP with the value provided by the first bid, this anchoring effect is then defined as follows W 1i = x i ( β ) + u i
and W 2i = ( 1 – γ )W 1i + γ b 1i
(3)
where the parameter 0 ≤ γ ≤ 1 . Herriges and Shogren (1996) show that, when an anchoring bias exists, efficiency gains provided by the double-bounded model disappear. Information yielded by the answers to the second bid is diluted in the anchoring bias phenomenon.
3.4
Anchoring model with heterogeneity
In the presence of individual heterogeneity, results based on standard regression can be seriously misleading if this heterogeneity is not taken into account. In the preceding anchoring model, Herriges and Shogren (1996) consider that all individuals are influenced by the first bid: the anchoring bias parameter γ is the same for all individuals. However, if only some respondents combine their prior WTP with the information provided by the first bid, the others not, it means that individual heterogeneity is present. Let us consider that we can divide respondents into two distinct groups: one subject to anchoring and another one not subject to anchoring. Then, we can define a new model as follows W 1i = x i ( β ) + u i
and W 2i = ( 1 – I i γ )W 1i + b 1i I i γ
(4)
where I i is a dummy variable which is equal to 1 when individual i belongs to one group and 0 if he belongs to the other group. Note that, if I i = 1 for all respondents, our model becomes the model proposed by Herriges and Shogren (1996) and if I i = 0 for all respondents, our model becomes the standard double bounded model. The model can also be defined with an heterogeneity based on individual characteristics rather than two groups, replacing I i by a variable X i taking any real values.
3.5
Estimation
The dependent variable is a dichotomous variable: the willingness-to-pay W i is unknown and we observe answers only. Thus, estimation methods appropriate to the qualitative dependent variable are required. The single bounded
Emmanuel Flachaire, Guillaume Hollard, Stéphane Luchini ________________________377
model can be estimated with a standard probit model. Models with followup questions can easily be estimated by maximum likelihood using the loglikelihood function l ( y, β ) =
n
∑ ( r1i r2i log [ P ( yes, yes ) ] + r1i ( 1 – r2i ) log [ P ( yes, no ) ] i=1
(5)
+ ( 1 – r 1i )r 2i log [ P ( no, yes ) ] + ( 1 – r 1i ) ( 1 – r 2i ) log [ P ( no, no ) ] ) where r 1 (resp. r 2 ) is a dummy variable which is equal to 1 if the answer to the first bid (resp. to the second) is yes, and is equal to 0 if the answer is no. For each model, we need to derive the following probabilities: P ( no, no ) = P ( W i < b 2 )
P ( no, yes ) = P ( b 2 < W i < b 1 )
P ( yes, no ) = P ( b 1 < W i < b 2 )
P ( yes, yes ) = P ( W i > b 2 )
(6) (7)
For the anchoring model with heterogeneity, we calculate these probabilities: P ( no, no ) = Φ [ ( ( b 2i – b 1i I i γ ) ⁄ ( 1 – I i γ ) – x i ( β ) ) ⁄ σ ]
(8)
P ( yes, no ) = Φ [ ( b 1i – x i ( β ) ) ⁄ σ ] – Φ [ ( ( b 2i – b 1i I i γ ) ⁄ ( 1 – I i γ ) – x i ( β ) ) ⁄ σ ] (9) P ( no, yes ) = Φ [ ( ( b 2i – b 1i I 1 γ ) ⁄ ( 1 – I i γ ) – x i ( β ) ) ⁄ σ ] – Φ [ ( b 1i – x i ( β ) ) ⁄ σ ] (10) P ( yes, yes ) = 1 – Φ [ ( ( b 2i – b 1i I 1 γ ) ⁄ ( 1 – I i γ ) – x i ( β ) ) ⁄ σ ]
(11)
The anchoring model, proposed by Herriges and Shogren (1996) is a special case, with I i = 1 for i = 1, …, n . The double bounded model is a special case, with γ = 0 .
4
Application
In order to test our model empirically, this article uses the main results of a contingent valuation survey which was carried out within a research program that the French Ministry in charge of environmental affairs started in 1995. It is based on a contingent valuation survey which involves a sample of users of the natural reserve of Camargue 7. The purpose of the contingent 7
The Camargue is a wetland in the south of France covering 75 000 hectares. The Camargue is a major wetland in France and is host to many fragile ecosystems. The exceptional biological diversity is the result of water and salt in an “amphibious” area inhabited by numerous species. The Camargue is the result of an endless struggle between the river, the sea and man. During the last century, while the construction of dikes and embankments salvaged more land for farming to meet economic needs, it cut off the Camargue region from its environment, depriving it of regular supplies of fresh water and silt previously provided by flooding. Because of this problem and to preserve the wildlife, the water resources are now managed strictly. There are pumping, irrigation and draining stations and a dense network of channels throughout the river delta. However, the costs of such installations are quite large.
378 ____________ Recherches Économiques de Louvain – Louvain Economic Review 73(4), 2007
valuation survey was to evaluate how much individuals were willing to pay to preserve the natural reserve using an entrance fee. The survey was administered to 218 recreational visitors during the spring 1997, using face to face interviews. Recreational Visitors were selected randomly in seven sites all around the natural reserve. The WTP question used in the questionnaire was a dichotomous choice with follow-up. There was a high response rate (92.6 %) 8.
4.1
Conformists and Non-Conformists
The questionnaire also contains an open-ended question related to the individual representations of the Camargue. This open-ended question yields the raw material to divide the respondents population into two groups: conformists and non conformists. This is done using the methodology presented in section 2, through the following steps: Step 1: What are the words that come to your mind when you think about the Camargue? In the questionnaire, respondents were asked to freely associate words to the Camargue. This question were asked before the contingent valuation scenario in order to not influence the respondents’ answers. Respondents used more than 300 different words or expressions in total. Step 2: A categorization into eight categories A basic categorization by frame of reference leads to eight different categories. For instance, the first category is called “Fauna and Flora”. It contains all attributes which refer to the animals of Camargue and local vegetation (fauna, 62 citations, birds, 44, flora, 44, bulls, 37, horses, 53, flamingos, 36, etc.). The others categories are “Landscape”, “Disorientation”, “Isolation”, “Preservation”, “Anthropic” and “Coast”. A particular exception is the category “Nature” which only contains the word nature which can hardly fall in one of the previous categories. There exists a ninth category which put together all attributes which do not refer to any categories mentioned below 9. Step 3: Existence of a transitive social representation After consolidating the data in step 2, we were left with 218 incomplete preferences over the set X containing our eight categories. A majoritarian pairwise comparison results are presented in Table 1. The result between two categories should be read in the following way: the number of line i and column j is the difference between the number of individuals who 8
9
See Claeys-Mekdade, Geniaux, and Luchini (1999) for a complete description of the contingent valuation survey. After categorization and deletion of doubles, the average number of attributes evoked by the respondents falls from 5.5 to 4.0.
Emmanuel Flachaire, Guillaume Hollard, Stéphane Luchini ________________________379
rank category i before category j and the individuals who order category j before i . For instance, we see that “Fauna and Flora” is preferred by a strong majority to “Isolation” (a net difference of 85 voices for “Fauna and Flora”). After aggregation through the majoritarian principle, the social representation is then transitive and thus provides a coherent social representation. Attributes
F-F Land. Isol. Preserv. Nat. Anth. Disor. Coast
Fauna-Flora
0
40
85
73
107
147
146
144
Landscape
-
0
48
53
86
117
123
126
Isolation
-
-
0
6
47
56
78
73
Preservation
-
-
-
0
25
51
62
65
Nature
-
-
-
-
0
14
11
28
Anthropic
-
-
-
-
-
0
9
17
Disorientation
-
-
-
-
-
-
0
12
Coast
-
-
-
-
-
-
-
0
Table 1: Majoritarian pairwise comparison
Step 4: Conformists and non conformists The top element, namely the Condorcet winner, concerns all aspects relating to biodiversity 10. This is not surprising since the main interest of the Camargue (as presented in all related commercial publications) is the “Fauna and Flora” category. Talking about the Camargue without mentioning any of those aspects is thus remarkable. Individuals who do so are considered as non conformists (38 individuals), while individuals who do are considered as conformists (180 individuals). Recall the survey was admistrated inside Camargue after individuals have visited it. Thus, they are fully aware of the importance of fauna and flora in Camargue. Not referring to those aspects is thus not a hazard.
4.2
Econometric results
We consider the dummy variable conformists/non-conformists, obtained with the four steps described above, and estimate the different models described in section 3, using a linear model (Mac Fadden and Leonard 1993). In practice, a value of particular interest is the mean of WTP, evaluated by n
µ = n– 1 ∑ xi ( β ) i=1 10
Full description of the data and more details are available in Hollard and Luchini (1999).
(12)
380 ____________ Recherches Économiques de Louvain – Louvain Economic Review 73(4), 2007
and the WTPs estimated dispersion is equal to d = σ (Hanemann and Kanninen 1999). Table 2 presents estimated means of WTP µ , as defined in (12), and the dispersions of WTP distributions σ for the single bounded, double bounded, anchoring and anchoring with heterogeneity models. From this Table, it is clear that the standard errors, in parentheses, decrease considerably when one uses the usual double-bounded model (column 2) instead of the single bounded model (column 1). This result confirms the expected efficiency gains provided when the second bid is taken into account (Hanemann, Loomis, and Kanninen 1991). However, estimates of the mean WTP in both models are very different: in the double bounded model the mean WTP would belong to the interval [ 77; 86 ] with a confidence level at 95% 11, instead of the confidence interval [ 104; 123 ] in the single bounded model. Such inconsistent results lead us to consider that anchoring effect could be present, as suggested by Herriges and Shogren (1996). Then, we estimate a model with anchoring effect, as defined in (3). Results, given in column 3, show that the anchoring parameter, γ = 0.52 , is significant ( P -value = 0.0124). This test confirms the existence of an anchoring effect in the respondents’ answers. When correcting for anchoring effect, the mean WTP belongs to the confidence interval [ 118; 136 ] which intersects the confidence interval of the single bounded model: results are now consistent. However, standard errors increase considerably, so that, even if follow-up questioning increases precision of parameter estimates (column 2), efficiency gains are lost once the anchoring effect is taken into account (column 3). According to this result, “the single-bounded approach may be preferred when the degree of anchoring is substantial” (Herriges and Shogren, 1996, p.124). Single -bounded model
Double -bounded model
Anchoring model
Anchoring model with heterogeneity
Mean
113.59
81.79
127.63
99.39
WTP µ
(4.80)
(2.41)
(4.62)
(3.29)
WTP
45.42
42.74
82.44
57.23
(23.65)
(5.23)
(41.22)
(11.46)
-
-
0.52
0.36
(0.23)
(0.14)
dispersion σ Anchoring effect γ
Table 2: Parameter estimates in French Francs (standard errors in parenthesis)
11
This confidence interval is defined as [ 81.79 ± 1.96 × 2.41 ]
Emmanuel Flachaire, Guillaume Hollard, Stéphane Luchini ________________________381
According to the distinction between conformists and non conformists, we now tackle the assumption of homogeneous anchoring. We firstly estimate a more general model than (4), with two distinct parameters of anchoring for these two groups, respectively conformists and non conformists. This is done from a model with W 2i = [ 1 – I i γ 1 – ( 1 – I i ) γ 2 ]W 1i + [ I i γ 1 + ( 1 – I i ) γ 2 ]b 1i replacing W 2i in (4). It allows us to test if non-conformists are not subject to anchoring with the null hypothesis γ 2 = 0 . A likelihood ratio test is equal to 1.832 ( P -value=0.1759), so that we cannot reject the null hypothesis and we therefore select the model (4), where anchoring only affects the conformists. Estimates of the model, where only conformists are subject to anchoring, are given in column 4. The anchoring parameter, γ = 0.36 , is clearly significant ( P -value = 0.005). In other words, it means that conformists use information provided by the first bid in combining their prior WTP with this new information, but not the non-conformists. Moreover, it is clear from Table 2 that standard errors from column 4, in parentheses, are significantly reduced compared to those of column 1. Hence, although the single-bounded model provides better results in terms of efficiency than the model with constant anchoring, our model with anchoring and heterogeneity yields more efficient estimates. In addition, the confidence interval of the mean WTP in the model with anchoring and heterogeneity is equal to [ 93; 106 ] . This interval intersects the confidence interval in the single bounded model [ 104; 123 ] and so, results are consistent. These results show that the estimate of the mean WTP is smaller and more precise in the anchoring model with heterogeneity than in the single bounded model. Table 3 presents full estimation results. It is worth noting that the introduction of heterogeneity provides a better estimation since many variables are now statistically significant. Indeed, the heterogeneous model exhibits six significant variables. This contrasts with the single-bounded model which exhibits only one significant variable. Our results therefore suggest that when anchoring is understood as a heterogeneous process, one obtains significant efficiency gains. Furthermore, these gains are so important that the welfare estimates can be calculated by using the anchoring model with heterogeneity rather than the single bounded model. This contradicts the result by Herriges and Shogren (1996) who use a homogeneous anchoring model and observe substantial efficiency losses.
382 ____________ Recherches Économiques de Louvain – Louvain Economic Review 73(4), 2007
Variables
Single-bounded model
Anchoring model
Anchoring model with heterogeneity
Constant
35.43
(57.27)
83.57 (68.43)
Distance home-natural site
9.30
(5.30)
7.07
-61.71
(41.08)
-79.47 (49.04) *
-58.22 (26.81)
95.86
(46.86)
84.27 (49.09) *
65.36 (27.77)
Using a car to arrive Employee
*
(4.45)
61.16 (44.18)
*
4.67
(2.17)
Middle class
109.96
(63.60)
99.89 (56.95) *
74.66 (28.96)
Inactive
52.58
(38.44)
57.12 (40.87)
48.80 (27.99)
Working class
97.28
(68.29)
81.27 (81.66)
62.00 (53.27)
White collar
80.33
(42.16)
78.88 (44.24) *
59.66 (24.65)
Visiting with family
4.71
(29.61)
12.79 (31.36)
13.01 (22.71)
Visiting Alone
61.11
(101.67)
122.37 (95.03)
89.18 (52.97)
Visiting with a group
44.79
(47.90)
3.70 (46.24)
4.22
(32.65)
First visit
51.42
(35.29)
18.56 (23.50)
15.59 (16.31)
New facilities proposed
56.93
(32.12)
57.29 (33.06) *
41.94 (15.59)
Other financing proposed
-32.03
(27.60)
-28.19 (21.84)
-19.01 (12.87)
South-West
-24.18
(33.57)
-42.04 (40.61)
-28.48 (24.24)
South-East
42.04
(58.26)
52.72 (52.06)
40.73 (32.61)
Questionnaire type
-28.19
(23.34)
-13.15 (17.82)
-10.50 (11.97)
Investigator 1
23.44
(56.29)
6.12 (47.50)
Investigator 2
-17.12
(57.52)
-39.70 (54.49)
8.26
(32.07)
-29.92 (35.09)
Table 3: Parameter estimates, standard errors in parentheses ( *: significant at 95% )
5
Conclusion
In this article, we follow a line of argument suggesting that anchoring exists but is not uniformally distributed across the population. To that extent, we present a method that is able to identify respondents who are more likely to anchor, and respondents who are not, on the basis of a single open-ended
Emmanuel Flachaire, Guillaume Hollard, Stéphane Luchini ________________________383
question with which we want to elicit free associations. Depending on the answers, we discriminate between two groups of individuals, namely the conformists and the non-conformists respectively. While the first group responds in more standard terms, the latter give more individualistic answers. We therefore show that it is possible to control for anchoring bias. The interesting aspect for CV practitioners is that we still experience efficiency gains over single bounded dichotomous choice by exploiting the heterogeneity in anchoring effects. This result stands in contrast to Herriges and Shogren (1996) who propose a model with homogeneous anchoring throughout the population and find important losses of efficiency with respect to the singlebounded model. Finally, how can we explain that non-conformists are less prone to anchoring? More investigation is required to answer this question. Our suggestion is that non-conformists have already a much more elaborated view on the subject, which does not conform to the “stereotypical” representation of the Camargue. They are not citing the most “obvious” reasons why they are visiting the Camargue (fauna, birds, horses, flamingos etc), but have a more “constructed” discourse, which reflects their own personal opinion on the Camargue. In that sense, we identify people with more “experience” on their subject, which may give raise to stronger opinions and preferences. Arguably, people with enhanced preferences are more likely to behave according to standard economic rationality. This means that in our setting, non-conformists attach much more importance to their own prior value of the object and are not influenced by the bidding values presented to them in the CV questionnaire. The general line of thought parallels experimental findings, which show that experienced subjects are more likely to conform to standard economic rationality. While one can rely on repetition in an experimental setting (Grether 1980), or clearly identified experienced subjects (List 2004), to come up with this conclusion, we associate “repetition” and “experience” with non-conformist representations of the subject under consideration.
6
Acknowledgments
This research was supported by the French Ministry in charge of environmental affairs. The authors wish to thank Louis-André Gérard-Varet for advice throughout this work. Thanks to Emmanuel Bec, Colin Camerer, Russell Davidson, Alan Kirman, André Lapied, Miriam Teschl and Jean-François Wen for their helpful and constructive comments. We also gratefully aknowledge the participants of the workshop Recent issues on contingent valuation surveys held in Marseilles (June 2003), especially Jason Shogren for his helpful comments and remarks. Errors are the authors’ own responsibility.
384 ____________ Recherches Économiques de Louvain – Louvain Economic Review 73(4), 2007
References Arrow, K., R. Solow, P. R. Portney, E. E. Leamer, R. Radner, and H. Schuman (1993, January). “Report of the NOAA panel on contingent valuation.” Technical Report 58 (10), p. 1601-1614. Bateman, I. and K. Willis (1999). Valuing Environmental Preferences: Theory and Practice of the Contingent Valuation Method in the US, EU, and Developing Countries. Oxford University Press. Carson, R. (1985). Three essays on contingent valuation: welfare economics, non-market goods, water quality. Ph.D dissertation, Departement of agricultural economics and resource economics, University of California, Berkeley. Claeys-Mekdade, C., G. Geniaux, and S. Luchini (1999). “Quelle valeur attribuer à la Camargue ? Une perspective interdisciplinaire économie et sociologie.” In P. Point (Ed.), La valeur économique des hydrosystèmes. Méthodes et modèles d’évaluation des services délivrés, Chapter 7, p. 137-168. Paris: Economica. Farr, R. M. (1998). From collective to social representations: Aller et Retour. Culture and Psychology 4 (3), 275-296. Galinsky, A. and T. Mussweiler (2001). “First offers as anchors: the role of perspective-taking and negotiator focus.” Journal of Personality and Social Psychology 81 (4), 657-669. Green, D., K. Jacowitz, D. Kahneman, and D. McFadden (1998). “Referendum contingent valuation, anchoring, and willingness to pay for public goods.” Resource and Energy Economics 20, 85-116. Grether, D. (1980). “Bayes rule as a descriptive model: The representativeness heuristic.” The Quaterly Journal of Economics 95 (3), 537-557. Hanemann, M. and B. Kanninen (1999). “The statistical analysis of discrete response CV data.” In I. Bateman and K. Willis (Eds.), Valuing Environmental Preferences. Theory and Practice of the Contingent Valuation Method in the US, EU, and Developing Countries, Chapter 11, p. 302-441. New York: Oxford University Press. Hanemann, W., J. Loomis, and B. Kanninen (1991). “Statistical efficiency of double-bounded dichotomous choice contingent valuation.” American Journal of Agricultural Economics 73 (4), 1255-1623. Hanemann, W. M. (1985). “Some issues in continuous and discrete response contingent valuation studies.” Northeastern Journal of Agricultural Economics 14 (april), 5-13. Hausman, J. (1993). Contingent valuation: A critical assessment. NorthHolland. Herriges, J. and J. Shogren (1996). “Starting point bias in dichotomous choice valuation with follow-up questioning.” Journal of Environmental Economics and Management 30, 112-131.
Emmanuel Flachaire, Guillaume Hollard, Stéphane Luchini ________________________385
Hollard, G. and S. Luchini (1999). “Théorie du choix social et représentations : analyse d’une enquête sur le tourisme vert en Camargue.” Working paper 99B06, GREQAM, Université de la Méditerranée Marseille, France. Laslier, J.-F. (1997). Tournament solutions and majority voting. Studies in Economic Theory. New York: Springer. List, J. A. (2004). “Neoclassical theory versus prospect theory: Evidence from the marketplace.” Econometrica 72 (2), 615-625. Mac Fadden, D. and G. Leonard (1993). Issues in the contingent valuation of environmental goods: Methodologies for data collection and analysis, Volume Contingent Valuation: a critical Assessment, p. 165-215. New York: North-Holland: Hausman. Mitchell, R. and T. Carson, R. (1989). Using Surveys to Value Public Goods: The contingent Valuation Method. Washington D.C.: Resources for the Future. Moscovici, S. (1961). La psychanalyse, son image et son public. Paris: PUF. Moscovici, S. (1998a). “Presenting social representations: A conversation.” Culture and Psychology 4 (3), 371-410. Moscovici, S. (1998b). Psychologie sociale (7th ed.). Paris: PUF. Mussweiler, T. and F. Strack (2001). “Considering the impossible: explaining the effects of implausible anchors.” Social Cognition 19 (2), 145-160. Strack, F. and T. Mussweiler (2002). Resisting influence: Judgmental correction and its goals. In J. Forgas and K. Williams (Eds.), The Sydney symposium of social psychology: social influence, Chapter 12, p. 201214. Cambridge University Press. Tversky, A. and D. Kahneman (1974). “Judgment under uncertainty: Heuristics and biases.” Science 185, 124-131. Vergès, P. (1994). Approche du noyau central: propriétés quantitatives et structurales. In Structures et transformations des représentations sociales, Textes de base en Sciences Sociales, Chapter 8, p. 233-253. Lausanne, Switzerland: Delachaux et Niestlé. Viaud, J. and C. Roland-Levy (2000). “A positional and representational analysis of consumption: households when facing debt and credit.” Journal of Economic Psychology 21, 411-432.