2800
IEEE TRANSACTIONS ON IMAGE PROCESSING, VOL. 20, NO. 10, OCTOBER 2011
Halftone-Image Security Improving Using Overall Minimal-Error Searching Jing-Ming Guo, Senior Member, IEEE, and Yun-Fu Liu, Student Member, IEEE
Abstract—For image-based data hiding, it is difficult to achieve good image quality when high embedding capacity and 100% data extraction are also demanded. In this study, the proposed method, namely, overall minimal-error searching (OMES) is developed to meet the aforementioned requirements. Moreover, the concept of secret sharing is also adopted to distribute watermarks into multiple halftone images, and the embedded information can only be extracted when all of the marked images are gathered. The OMES modifies the halftone values at the same position of all host images with the trained substitution table (S-Table). The S-Table makes the original combination of these halftone values as another meaningful combination for embedding watermark, which is the key part in determining the image quality. Thus, an optimization procedure is proposed to achieve the optimized S-Table. Two different encoders, called error-diffused-based and least-mean-square-based approaches are also developed to cooperate with the proposed OMES to cope with high processing speed and high image quality applications, respectively. Finally, for resisting the issues caused by the print-and-scan attack, such as zooming, rotation, and dot gain effect, a compensation correction procedure is also proposed. As demonstrated in the experimental results, the proposed approach provides good image quality, and is able to guard against some frequent happened attacks in printing applications. Index Terms—Data hiding, digital watermarking, error diffusion (ED), halftoning, least mean square (LMS).
I. INTRODUCTION IGITAL halftoning [1] is a technique for changing grayscale images into two-tone halftone images. These halftone images can be resembled as a grayscale images when viewed from a distance with the low-pass nature of the human visual system (HVS). Halftoning is commonly used in printing books, newspapers, and magazines because these printing processes can only generate a limited number of colors, black and white (with and without ink). More halftoning methods can be grouped through different properties such as ordered dithering (OD) [1], error diffusion (ED) [2]–[6], least squares (LS) [7]–[11], and dot diffusion (DD) [12], [13]. Among these, ED offers good visual quality and reasonable computational complexity.
D
Manuscript received August 24, 2010; revised January 08, 2011 and March 07, 2011; accepted March 08, 2011. Date of publication March 24, 2011; date of current version September 16, 2011. This work was supported by the National Science Council, Taiwan, under Contract NSC 99-2631-H-011-001. The associate editor coordinating the review of this manuscript and approving it for publication was Dr. James E. Fowler. The authors are with the Department of Electrical Engineering, National Taiwan University of Science and Technology, Taipei 10607, Taiwan (e-mail:
[email protected];
[email protected]). Color versions of one or more of the figures in this paper are available online at http://ieeexplore.ieee.org. Digital Object Identifier 10.1109/TIP.2011.2131667
Since the halftoning is normally employed for image printing, it raises the importance of halftoning-based digital watermarking and data hiding. Normally, the practical application can be classified into two scenarios. For instances, it can be used for protecting ownership rights of the printed documents or preventing the illegal distribution of a printed image document without permission; another scenario can be hidden data communication via printed image documents. According to the applications, digital watermarking trends to provide a high robustness of extracting hidden information to withstand attacks, while the data hiding expects to increase the embedded payload data for depositing a better hidden information transmission efficiency. The hidden information, which is embedded in halftone images can be retrieved by scanning and applying some extraction algorithms. These methods include using a number of different dither cells to create a threshold pattern in the halftoning process [14] using vector quantization to embed watermarks into the most significant bit or least significant bit of error-diffused images [15], [16], using modified data-hiding ED to embed data into error-diffused images [17], embedding a message into dithering images using a pair of conjugate halftone screens [18], using smart pair-toggling (DHSPT) to embed data into error-diffused images [19], adopting intensity and connection selection concepts to put the embedded data in a suitable location [20], coordinating the BCH error-correcting code with data-hiding techniques [21] authentication based on halftoning and coordinate projection [22], and data hiding in several halftone images or color planes using minimal-error bit searching (MEBS) [23]. The MEBS employs the gray code to divide code vectors into two groups, and a code vector in a group can be switched to another group by simply modifying one bit. This property preserves good image quality when embedded capacity (is defined in next section) is as high as 33.33%. However, the quality degrades significantly when capacity increases up to 50%. This study presents the overall minimal-error searching (OMES) method to improve the image quality when the data capacity is higher than 50%. Moreover, the least-mean-square (LMS) based scheme is also employed to achieve even better quality and edge-enhanced embedded results. The rest of this paper is organized as follows. Section II introduces the performance evaluation used in this study. Section III describes the proposed OMES encoding scheme. Section IV presents the print-and-scan (PS) effect correction algorithm. Finally, experimental results and conclusions are given in Section V and Section VI, respectively.
1057-7149/$26.00 © 2011 IEEE
GUO AND LIU: HALFTONE-IMAGE SECURITY IMPROVING USING OVERALL MINIMAL-ERROR SEARCHING
2801
II. PERFORMANCE EVALUATIONS In this section, the peak SNR (PSNR), correct decode rate (CDR), and capacity employed in this study for estimating the performance of proposed technique are defined. Suppose of size is adopted an original grayscale image to generate the marked halftone image of same size, the quality evaluation of the marked image is defined as follows, where the grayscale value is defined within a range from 0 to 255 to describe pure black and white in quality estimation. (See equation at bottom of page, where the variables and denote the values of the original grayscale image and the marked halftone image, respectively.) The variable denotes the coefficient of the LMS-trained filter, where the filter size is directly affected by the viewing distance and image resolution (dpi). The filter size is defined as the number of pixels in one visual degree as follows: (2) denotes one viewing degree, denotes the where viewing distance (in centimeters), denotes the viewed width, . Suppose and and , then , which means 31 pixels in 1-D space are involved for one perceived degree calculation. The LMS-trained filter can be obtained by psychophysical experiments [24]. The other way to derive the filter can be to use a training set of both pairs of grayscale images and the good halftone results of them, such as using ED or OD, to produce the set. Herein, Lena, Airplane, Peppers, House, Tree, Mandrill, Splash, and Sailboat images are involved for training. The LMS is described as follows: (3) (4) (5)
if (6) if where the variables and denote the values of the grayscale image and the corresponding halftone image, respecdenotes the th iterated coefficient of tively, and variable the LMS-trained filter. The parameter denotes the adjustment scale that affects the convergent speed of the LMS optimization procedure. Theoretically, it is a tradeoff between the accuracy and the training speed according to the value of . A small
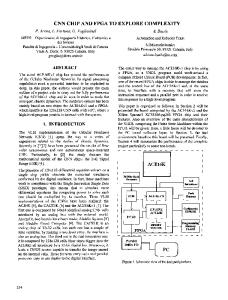
Fig. 1. Five optimized LMS-trained human visual filters of various sizes. (a) 7 7. (b) 9 9. (c) 15 15. (d) 23 23. (e) 31 31.
2
2
2
2
2
can yield a faster training speed, while the quality of the final reconstructed LMS-based halftone image will be lower, and vice versa. According to the experimental results, there is . little gain in image quality when is set smaller than is set at to achieve a Consequently, this parameter balance result in this study. Some other quality evaluation methods can be found in [25] and [26]. The obtained optimized LMS-filters are shown in Fig. 1. Notably, these filters have some basic HVS characteristics, including: 1) the diagonal has less sensitivity than the vertical and horizontal directions, and 2) the center portion has the highest sensitivity and it decreases while moving away from the center. Notably, the trained filter of size 31 31 is shown in Fig. 1(e); it is obvious that the HVS is more sensitive to the center part of size 7 7. Fig. 1(b)–(d) shows the trained filters of various sizes, and which support this observation. Thus, for reducing the overall computational complexity of the optimization in the next section, the LMS-trained 7, as shown in Fig. 1(a), is adopted in this filter of size 7 study. The other performance evaluation is the CDR, which determines the similarity between the original binary watermarks and the corresponding decoded watermarks . The
(1)
2802
IEEE TRANSACTIONS ON IMAGE PROCESSING, VOL. 20, NO. 10, OCTOBER 2011
Fig. 2. Flowchart of the proposed scheme.
CDR is based on the concept of Hamming distance as defined in the following: (7) where the size of the embedded watermark is identical to that , the variables and of the host image as denote the values of the embedded watermark and the decoded watermark, respectively, and the notation denotes the Exclusive OR logic operator. Moreover, the third performance evaluation is the capacity which is used to estimate the ratio between the embedded data size and the host data size as defined in the following: (8) III. DATA HIDING WITH OMES This section describes the proposed OMES encoding scheme, watermarks into (always even number which can embed in this study) host images to achieve 50% data capacity. This method alters the combination of halftone values constructed from the halftone images at the same positions according to the corresponding combination of the watermark values at the same position. With the proposed method, the watermarks can be distributed to multiple marked halftone images. This concept is similar to that of the secret sharing scheme [27]. Consequently, the hidden information can only be extracted when all the marked images are gathered, and thus, it improves the overall security. Fig. 2 shows the flowchart of the proposed algorithm. First, are adopted the original grayscale images to embed binary watermarks . The optimized substitution table (S-Table) is adopted to yield the with high image quality. marked images In this paper, two encoders with different characteristics are proposed for different applications, namely error-diffused-based (ED-based) and LMS-based encoders. Normally, the LMS-based encoder can obtain a better image quality than that of the ED-based encoder, yet the LMS-based encoder consumes more processing time. The marked images are in
Fig. 3. Proposed ED-based encoder. (a) Main algorithm. (b) and (c) Examples of the partial functions of (a), where the characters “a” to “z” denote the different individual values, and z . . . ba denotes the constructed value stream with a specific order. (d) ED-based halftoning with Floyd–Steinberg’s error kernel [2].
halftone format, thus it can be directly outputted for printing without damaging. However, the printed documents may suffer from zooming, rotation, and dot gain effect [28] when PS is applied. To cope with this, a corresponding correction strategy is proposed. Conversely, the marked images can also be transmitted in electronic form to a remote end, and the receiver can decode the secret information before it is further printed. The main procedure of the proposed algorithm is fully discussed in this section, and the PS correction strategy will be introduced in the next section. A. ED-Based Encoder Fig. 3(a) illustrates the flowchart of the ED-based encoder, where the processing of value combination and value dissociation are explained in Fig. 3(b) and (c), respectively. The black circles indicate collecting all individual values to form a value stream or dissociating a value stream to individual values. First, , where ) the values of the grayscale host images ( import to the ED-based halftoning operations. The outputs of them are gathered to form the two vectors
GUO AND LIU: HALFTONE-IMAGE SECURITY IMPROVING USING OVERALL MINIMAL-ERROR SEARCHING
TABLE I S-TABLE: RELATIONSHIPS BETWEEN WATERMARK AND THE CORRESPONDING HOST IMAGES
2803
TABLE II S-TABLE TRAINED FOR TWO, FOUR, AND SIX HOST IMAGES WITH CAPACITY 50%. (a) One Watermark Hiding in Two Host Images. (b) Two Watermarks Hiding in Four Host Images. (c) Three Watermarks Hiding in Six Host Images
and , with a specific order for further ED-based OMES processing. In the processing of ED-based OMES, the pseudorandom permuted watermarks are also taken into account in a vector form as . After the processing, the output of the ED-based OMES is represented by a vector , which contains the outputs of each marked images. The flowchart of the ED-based halftoning is shown in and denote the grayscale Fig. 3(d), where the variables value of the host image and the diffused error sum added up denotes from the neighboring processed pixels, variable denotes the value of the temporary halftone value, variables marked halftone determined by ED-based OMES, and variable denotes the error kernel proposed by Floyd–Steinberg [2], where the notation x denotes currently processing position. The relationships among these variables are organized as follows:
(9) if if
.
(10)
Notably, 0 and 1 represent pure black and white in this section. The OMES scheme observes the temporary halftone outputs and the corresponding permutated binary vector of vector at the same position, and then modifies the the watermarks according to the S-Table, which will be reoutput vector visited later. The quantized errors are feedback diffused to the neighboring pixels of the temporary halftone images (host images) to reduce the damage caused by the binary outputs modification. Suppose a case that yields a capacity of 50% with two host images and one watermark, and each of them is of the same and have and configurations, size. Thus, the . For two pixels in and one pixel respectively, where of the same relative position, it can be organized, as in in Table I, where the group number indicates different watermark information. For simplicity, this table can be rearranged to Table II(a), where each row represents a group. This is called the S-Table, and each number in the S-Table is called a state. Given a specific order of the host images, the corresponding is first transformed to a decimal value, then this value maps to a corresponding group in S-Table. The mapped group is called . Meanwhile, the vector of the watermarks original group with the same position as the host images is also transformed to a decimal value, then this value also maps to a corresponding group in S-Table. The group mapped by the watermarks is called . When , then let ; the target group
Fig. 4. Example of the halftone watermark.
G
and
G
with two host images and one embedded
when , then all the states in should be used for testing which state causes minimal overall error. Herein, the overall error is defined as the overall quantized error caused by the tested state. The one with the minimal overall error is employed to replace the original state. An example is illustrated in Fig. 4. The procedure of the proposed ED-based OMES is organized as follows: (11) (12) (13) (14) denotes the set of states of in S-Table, where the vector denotes the binary stream, which represents the vector decimal state in S-Table, where the stream can also be repre, variable denotes the sented by bits , variable denotes the host image number, state number in is defined in Fig. 3(d), and vector is defined variable
2804
IEEE TRANSACTIONS ON IMAGE PROCESSING, VOL. 20, NO. 10, OCTOBER 2011
denotes a temporary constant that stores the total the variable denotes the grayscale error in th iteration processing, denotes the temporary halftone value of a host image, results, which will be modified during this processing, and the , and converged will be the marked halftone image denotes the current processing position, where and . The initial can be in any binary combinations, such as whole black or white, or any halftone image, because the experimental results show that the initial halftone image does not significantly influence the quality of the final marked image. Consequently, without losing generality in this study, a whole black image is employed as the initial halftone image. The iterative reconstruction procedure is organized as follows. and the temporary halftone image Step 1) Initialize . Step 2) Determine which state in the target group can achieve the minimal visual error (the best visual image quality). The corresponding processing is identical to (13)and (14) in ED-based encoder, where (13) has to be redefined as follows:
TABLE III EXAMPLE OF QUANTIZATION ERROR
(16) Fig. 5. Flowchart of the proposed LMS-based encoding scheme.
in Fig. 3(a). According to the above equations, the state with of the minimal error will be assigned to be the output marked image to maintain image quality. For further improving the quality of each marked image, a manner is adopted to reduce the negative influence when , where provides the best halftone result. Table III provides an example to show the states of the errors defined in (10), where the definitions of the rest variables can be found in Fig. 3(d), or the related descriptions toward (9) and (10). This , the value of will be table explains that when less or equal to 0.5. This is a normal case for the ED halftoning generating the best halftone image quality. However, when the yields the opposite output of the ED-based OMES encoder (as or premodified halftone output ), the value of will be greater or equal to 0.5 (as the circled error shown in Table III), and which will significantly reduce the image quality. To reduce the influence is set at 0.5 for of aforementioned occasions, an upper bound maintaining the quantization error has the nearest value to meet . The modified equation for (10) is shown as follows: if if O.W.
where denotes the coefficient in LMS-trained (7 7), as shown in Fig. 1(a), filter of size denotes the number of the host and constant is defined in (12). Comparing images; variable with (13) in ED-based OMES, the LMS-based OMES evaluates the visual errors obtained with the LMS-trained human visual filter, and which thus increases the computations. Afterward, update with the output and with , where is defined in (14). Step 3) Process the whole temporary halftone image with step 2. Step 4) The convergence is met when the total error in the current iteration equals to the last iteration. Otherwise, repeat steps 2–3. Step 5) Output the converged temporary halftone images as the marked images. From the experimental results, the averaged convergence speed of LMS-based encoder with all black initial temporary halftone image is depicted in Fig. 6. With the inherent iterating reconstruction property of the proposed LMS-based halftoning, the secret-sharing LMS-based OMES can cooperate with it to produce high data capacity and high-quality embedded results. C. S-Table Optimization Procedure
(15)
B. LMS-Based Encoder The flowchart of the proposed LMS-based encoding scheme is illustrated in Fig. 5, which contains the cooperation between the LMS-based halftoning and the LMS-based OMES. Herein,
The quality of the marked images obtained by the proposed OMES scheme is determined by the altered quantity of the halftone values from its original state to the target state. Theoretically, the occurrence of achieving the best image quality is when the original state equals to the target state; however, the probability of this event is simply (where denotes the number of the watermarks). Consequently, there will be a high possibility that some values in the original halftone images
GUO AND LIU: HALFTONE-IMAGE SECURITY IMPROVING USING OVERALL MINIMAL-ERROR SEARCHING
Fig. 6. Average total error (E ) of LMS-based encoder with natural images and watermarks in training image set, and with whole black temporary halftone image.
2805
suppose Table II(a) is the initialized S-Table, which is formed to an 1-D sequence with raster scan to where and , the swapped result becomes . Step 3) Evaluate the average PSNR of the marked images from the training image set (in total combinations) with the temporary S-Table obtained from step 2. To avoid the possibility that the information of watermarks is over carried on some specific host images (this will significantly degrade the image quality of the host images), the variance of all the evaluated PSNRs from the corresponding marked images is taken into account. This method can simultaneously increase the security of each marked image for it is not easy to perceive the hidden embedded information. The estimation equations are defined as follows: (17)
(18) if O.W.
Fig. 7. Optimization procedure of the S-Table.
are required to be changed for hiding watermarks. Unfortunately, when too many differences are shown between the target and the original states, the image quality will be significantly degraded. Thus, an optimization procedure of constructing the S-Table is proposed to meet this goal as follows. There are totally 18 different natural grayscale images and 3 different watermarks involved in the S-Table training procedure. To maintain the identical amount of black and white watermark bits with different spatial distribution, a uniform distributed image with grayscale value 0.5 is adopted to perform with the three different halftoning approaches including Classical-4 clustered-dot dithering [1], Bayer-5 dispersed-dot dithering [1], and Mese–Vaidyanathan’s DD with class matrix of size 8 8 [13]. The steps of the optimization procedure are organized as follows, and the corresponding flowchart is illustrated in Fig. 7. Step 1) Given an initial S-Table . Step 2) Suppose the states in S-Table are rearranged in 1-D sequence of length . Choose two states and ( , ) and swap them to generate a temporary , where is called the exchange state, which will be swapped with other states, and is called the swapped state, which is adopted to swap with . For instance,
(19)
denotes the PSNR calculated by (1), where with th marked image, which is obtained with , and variables and denote the mean and variance of the PSNRs, respectively. The empirical parameter which denotes the upper bound of the acceptable . Theoretically, is the ideal setting for protecting the security of all the host images; however, the contents, structures, or grayscale values of the host images are not predictable, and which makes the calculated PSNR of each marked image different with each other. Thus, the ideal is impracticable. For the setting of this parameter, a smaller can produce marked images of similar quality, yet it also has to be big enough to be used by all the unpredictable training set. The parameter value 0.4 is the smallest value from the training set. Step 4) When the overall is calculated, adopt the , which can achieve the maximum cost defined in (19) to update the . Since the variables and defined in step 2 are allowed to be identical, thus even through the maximum cost obtained by the current iteration is not better than that obtained in last iteration, the is maintained unchanged. Step 5) When all the exchange states in S-Table are in turn evaluated, and no further swapping is able to yield a better cost, then terminate the optimization. Otherwise, repeat steps 2–4. In fact, the full search can achieve the best S-Table. However, the computations will be substantially increased, for example, an S-Table of size 4 4 requires 16! computations. The proposed optimization method only needs computations for
2806
IEEE TRANSACTIONS ON IMAGE PROCESSING, VOL. 20, NO. 10, OCTOBER 2011
Fig. 8. Flowchart of the PS effect correction.
each iteration, as mentioned earlier, yet the drawback is the higher probability to be trapped in a local optimum result. To reduce the influence of this problem, in total 5000 different randomly generated initial S-Tables are employed. By doing this, the computations of the proposed method is still lower than that (when the size of the of the full search by a factor S-Table is 8 8, the computations of the proposed method will be lower than that of the full search by a factor ). Thus, it is not possible to adopt the full search optimization. Table II shows the final convergent S-Tables for different numbers of host images including three configurations: 1H2 (one watermark embedded into two host images), 2H4, and 3H6. Among these, due to the Table II(a) only requires 4! computations (four elements have 4! combinations), this S-Table is obtained by full search method. All of these configurations can achieve capacity 50%. In this study, no more than eight host images are explored since it is impractical in applications. IV. PS EFFECT CORRECTION As it can be seen in Fig. 2, the marked images can be distributed through two ways, i.e., electronic format or printed documents. To decode the marked image obtained in the latter format, the damages caused by the PS process such as zooming, rotation, and dot gain effects should be taken into account. For these, an automatic procedure for resynchronization after PS attack is proposed, as introduced in the following, and the corresponding flowchart is illustrated in Fig. 8. Step 1) Low-pass filtering: From this step to step 5, it is attempted to locate the halftone image from a printed document and solve the rotation issue inherent in a PS attacked image. Since black and white pixels generally appear alternately in a halftone image, the low-pass filtering is to make the region inside the halftone image as a cluster of dark area. Suppose the , the low-pass filtering is deimage is of size fined as follows. The corresponding filtered example is shown in Fig. 9(a).
(20) Step 2) Binarization: After step 1, a threshold of 90% corresponding to the maximum pixel value of the scanned
Fig. 9. Examples of the proposed recovery procedure for PS attack. (a) Lowpass filtered result. (b) Binarized result. (c) Morphological expansion and erosion processed result. (d) Edge detected result. (e) Hough transform in a–b domain. (f) Coordinates of the projected boundaries. (g) Rotation corrected result. (h) Corrected result of the mask image. (i) Halftone image localization mask. (j) Image size normalized result. (k) Normalized image binarization. (a) f (i; j ); (b) f (i; j ); (c) f (i; j ); (d) f (i; j ); (g) f (i; j ); (h) f (i; j ); (i) f (i; j ); (j) f (i; j ); (k) f (i; j ).
document is applied to separate the bright background and the dark halftone image. The binarized is shown in Fig. 9(b). result Step 3) Expansion and erosion: Since some background regions beyond the halftone image may be thresholded as black, the morphological expansion and erosion operations are further applied to remove these unwanted areas. In general, the erosion number could be greater than the expansion number without affecting the rotational angle. In detail, the reason of applying expansion is to remove some white dots inside the halftone image, and the erosion is to remove the peripheral black regions. To make the overall procedure automatic, the expansion and erosion numbers are determined proportional to the . According to numerous overall black pixel of experiments, these parameters are fixed as follows:
(21) (22) denotes the rounding processing. where . Herein, the processed result is denoted as Step 4) Edge detection: The following equation is applied to obtain the edge of the reserved area. The corresponding edge detected result is shown in Fig. 9(d) if O.W. (23)
GUO AND LIU: HALFTONE-IMAGE SECURITY IMPROVING USING OVERALL MINIMAL-ERROR SEARCHING
Step 5) Hough transform: Those pixels with value 1 in are further transformed using Hough transform as follows: (24) domain corresponds to a line in Each pixel in domain, as shown in Fig. 9(e). All the lines in domain mostly intersect to four points, which correspond to two different slopes. These two points marked with red circles in the second quadrant correspond to the negative slope, as indicated on the -axis, where the value 15 is the pixel number domain, and the value apart from the origin in 2.15 in the parentheses is the detected rotational angle. The intersected points 1 and 2 correspond , respectively. to the top and bottom edges of Other two intersection points are located in the distance of the fourth quadrant and are not necessary to be included in the rotational angle detection. The gray area between points 1 and 2 associates to the extended lines of the two intersection points in the fourth quadrant. In fact, the coordinates of the points 1 and 2 on the -axis are somewhat different. Hence, the rotational angle is defined as the average of the two values. Step 6) Rotation correction: According to hundreds of testing with different PS resolution configurations, the proposed approach can detect the rotational angle correctly. Using the detected angle in step 5, the corresponding rerotated results associated and are shown in Figs. 9(g) and 9(h), with and . Notably, the which are denoted as origin of the rerotation is not at the center of the whole scanned document, but in the center of the halftone image. According to the projected boundaries depicted in Fig. 9(f), where Fig. 9(f) and 9(c) are identical, the center coordinate is defined as . Step 7) Second round expansion and erosion: In this stage, it is to locate the whole area of the halftone image from the scanned document using the mask image, as shown in Fig. 9(h). In addition to the original black noises beyond the halftone image in Fig. 9(b), some new black parts in the peripheries of the scanned document are involved after the rerotation process in Fig. 9(h). As a result, the erosion count should be greater than that in step 3, and the expansion count can be kept equal as that in step 3. Based on numerous experiments, the second round expansion and erosion counts defined in the following are selected:
(25) (26)
2807
Apparently, as long as the count of erosion is greater than that of the expansion, the reserved black region is shrunkened. Hence, the second-time expansion should be conducted to recover the original area of the halftone image. The second-time expansion count is defined as
(27) The corresponding halftone region mask is denoted and is shown in Fig. 9(i). as Step 8) Image size normalization and binarization: The is extracted using the mask halftone image in . In general, the size of the PS halftone image image is larger than that of the original size (according to hundreds of experiments), the preserved square blocks (suppose result is divided into ), and the avthe size of original image is erage pixel value inside each block is calculated to , as shown in Fig. 9(j), which is achieve image the size-normalized result. is Step 9) Normalized image binarization: The image then thresholded to recover the original halftone image (0-black and 1-white). Since the laser printer has the inherent problem of dot gain effect [28], herein the threshold was set to be lower than 0.5 to overcome the darkening effect. According to the equipments, Epson AcuLaser C2000 printer and Epson photo700 scanner, the value 100 is a good choice. However, the value may slightly vary corresponding to different equipment models. The thresholded result is shown in Fig. 9(k). Suppose a scenario is met in practical applications that the marked images are printed on a newspaper or a magazine with other contents on the background. In this case, the printed marked images have to be manually labeled with a region of interest (ROI). The regions beyond the ROI are reset to white. The additional step is logical that when a specific printed image is distributed and thus causes copyright issue, the receiver certainly can identify the ROI for further verification. V. EXPERIMENTAL RESULTS In this section, the performance of the proposed algorithm with two different OMES encoders is demonstrated. In this section, nine different images are adopted to exhibit the results of the proposed schemes. Fig. 10(a)–(f) shows six different grayscale host images of size 512 512, and Fig. 10(g)–(i) shows three halftone watermarks of size 512 512 obtained by Floyd–Steinberg’s ED [2]. Notably, the proposed method can achieve 100% in CDR when there is no attack. Thus, the corresponding decoded watermark will not be shown under this scenario. Figs. 11 and 12 show the two marked halftone images using MEBS [23] and the proposed ED-based encoder with capacity 50%, where the adopted watermark is shown in Fig. 10(g). According to these results, when a higher capacity is utilized, the proposed ED-based encoder provides superior average
2808
IEEE TRANSACTIONS ON IMAGE PROCESSING, VOL. 20, NO. 10, OCTOBER 2011
Fig. 13. Marked halftone images obtained by the proposed ED-based encoder with Table II(b)’s S-Table and watermarks of Fig. 10(g) and (h). (All printed at 600 dpi). (a) PSNR = 27:9 dB. (b) PSNR = 28:2 dB. (c) PSNR = 28:9 dB. (d) PSNR = 25:1 dB.
Fig. 10. Original tested images. (a)–(f) grayscale host images. (g)–(i) Halftone watermarks obtained by Floyd-Steinberg’s ED [2]. (All printed at 600 dpi).
Fig. 11. Marked halftone images obtained by MEBS [23] with the watermark shown in Fig. 10(g). (All printed at 600 dpi). (a) PSNR = 24:5 dB. (b) PSNR = 24:4 dB.
Fig. 12. Marked halftone images obtained by the proposed ED-based encoder with Table II(a)’s S-Table and watermark of Fig. 10(g). (All printed at 600 dpi). (a) PSNR = 26:3 dB. (b) PSNR = 24:1 dB.
image quality than that of the MEBS method. These results also indicate that the proposed ED-based encoder supports embedded images of higher security than that of the MEBS since the hidden watermark artifact is even more difficult to be perceived. An interesting phenomenon is explored: When the number of host images is few, such as two, one host image with explicit edge structure or a cluster of bright or dark area, the other marked halftone image will suffer from serious interference and then degrades in quality. This problem is raised because there are only few selectable states ( , where and denotes the number of host images and watermarks, respectively) in target group. To solve this problem, the difference between the number of host images and watermarks should be increased. Notably, the capacity has to be maintained. Figs. 12–17 show the marked images obtained by the proposed ED- and LMS-based encoders with various number of host images from two to six, in which, the watermark, as shown
Fig. 14. Marked halftone images obtained by the proposed ED-based encoder with Table II(c)’s S-Table and watermarks of Fig. 10(g)–(i). (All printed at 600 dpi). (a) PSNR = 28:1 dB. (b) PSNR = 27:7 dB. (c) PSNR = 28:6 dB. (d) PSNR = 28:6 dB. (e) PSNR = 28:2 dB. (f) PSNR = 27:7 dB.
Fig. 15. Marked halftone images obtained by the proposed LMS-based encoder with Table II(a)’s S-Table and watermark of Fig. 10(g). (All printed at 600 dpi). (a) PSNR = 28:6 dB; (b) PSNR = 23:1 dB.
in Fig. 10(g), is embedded in Figs. 12 and 15, the watermarks, as shown in Fig. 10(g) and (h), are embedded in Figs. 13 and 16, and the watermarks, as shown in Fig. 10(g)–(i), are embedded in Figs. 14 and 17. According to the experimental results, the LMS-based encoder can iteratively determine the best image quality. Thus, some deficiencies inherently shown in error diffusion, such as warm effect and false contour, do not accompany with the LMS-based results. This advantage can also be observed in Fig. 18, which shows the averaged image quality of seven different methods. The comparisons contain various methods including MEBS [23], ED- and LMS-based encoders with two host images and one watermark (ED 1H2 and LMS 1H2), ED and LMS 2H4, and ED and LMS 3H6. This experimental result shows that the marked images of the LMS-based encoder have superior quality than that of the ED-based encoder
GUO AND LIU: HALFTONE-IMAGE SECURITY IMPROVING USING OVERALL MINIMAL-ERROR SEARCHING
2809
Fig. 16. Marked halftone images obtained by the proposed LMS-based encoder with Table II(b)’s S-Table and watermarks of Figs. 10(g), (h). (All printed at 600 dpi). (a) PSNR = 28:2 dB; (b) PSNR = 29:7 dB; (c) PSNR = 30:4 dB; (d) PSNR = 27:2 dB.
Fig. 17. Marked halftone images obtained by the proposed LMS-based encoder with Table II(c)’s S-Table and watermarks of Fig. 10(g)–(i). (All printed at 600 dpi). (a) PSNR = 29:1 dB. (b) PSNR = 29:2 dB. (c) PSNR = 30:0 dB. (d) PSNR = 30:0 dB. (e) PSNR = 29:7 dB. (f) PSNR = 28:1 dB.
Fig. 18. Performance comparisons among MEBS [23], the proposed ED-based, and LMS-based watermarking methods.
and MEBS. In addition, the image quality of the proposed encoders is improved when the difference between the number of host image and the number of watermarks is increased. Two of the most frequently happened attacks, cropping (tampering) and PS, are involved in the experiments to analyze the robustness performance, in which the marked images obtained by the ED-based encoder are adopted in these experiments since the CDR of the decoded watermarks obtained from EDor LMS-based encoders are identical to 100%. In addition, to avoid the cluster losing of information by cropping, the watermark is pseudopermutated before being embedded, and the decoded watermark are repermutated after the decoding. Fig. 19 shows the decoded watermark results with various cropping rate from 5% to 40%, where the A# denotes the
Fig. 19. Decode watermark with cropping rate 5% and 40%, where the “#H#” represents the different input images with capacity 50%, and A# denotes the number of attacked embedded images. (All printed at 900 dpi). (a) 1H2, A1. (b) 2H4, A1. (c) 2H4, A2. (d) 3H6, A1. (e) 3H6, A2. (f) 3H6, A3.
number of the attacked marked halftone images, and the types represents different number of host images and watermarks with capacity 50%. A more complete experimental result under various cropping rates is shown in Fig. 20. Moreover, multiple configurations of PS attacks are involved in the experiments, namely, printing at 150, 300, and 600 dpi, and scanning at 300, 600, and 1200 dpi. In this experiment, an RGB color image of size (512 512) is adopted, where each
2810
IEEE TRANSACTIONS ON IMAGE PROCESSING, VOL. 20, NO. 10, OCTOBER 2011
TABLE IV COMPARISONS AMONG VARIOUS WATERMARKING/DATA HIDING TECHNIQUES
Fig. 20. Average CDR of decoded watermarks with various cropping rates from 5% to 40%.
color channel can be considered as an independent marked image. Notably, only one watermark can be embedded in R–G, R–B, or G–B channel pairs of the color image. In addition, the ED-based encoder along with the S-Table in Table II(a) is adopted. Fig. 21 shows an example of the color marked image and the associated three channels, in which Fig. 21(b)–(d) are the red, green, and blue channels of Fig. 21(a), respectively. The color image is divided into nonoverlapped cells of size , and each watermark bit is embedded in a cell; thus, every vector in a cell has to embed the same watermark bit. The majority voting is then employed to recover the attacked watermark. Fig. 22 shows the averaged CDRs with the 12 test color images. The results show that a configuration with a low printing resolution and a high scanning resolution can yield a high decoded result. For the researches of data hiding/watermarking, the marked image can be separated into two groups, according to whether it is meaningful or not. The nonmeaningful marked image can
Fig. 21. Color marked image. (a) Color marked result. (b) Red channel of (a). (c) Green channel of (a). (d) Blue channel of (a).
Fig. 22. Average CDR of decoded watermarks with different configurations of PS resolutions.
be highly suspicious for the adversary counterpart. Conversely, the meaningful marked image is more secure as it is normally
GUO AND LIU: HALFTONE-IMAGE SECURITY IMPROVING USING OVERALL MINIMAL-ERROR SEARCHING
considered as a regular image, while the image quality is the key issue. Consequently, the comparisons provided here only focus on the techniques, which can create meaningful marked images, including Fu and Au’s works [20], [21], Pei and Guo’s MEBS scheme [23], Lien and Pei’s method [29], Guo and Zhang’s technique [30], Wang and Arce’s method [31], Ulutas’s method [32], Shen and Ye’s method [33], and the proposed OMES. The results are organized in Table IV, where the values of CDR and image quality are quantized, and the circled values indicate those with top 33% performances under each assessment. According to this analysis, it is generally a tradeoff between capacity and marked image quality. Moreover, inspecting the proposed OMES and the former MEBS [23], it is difficult to tell the difference in image quality when the capacity is lower than 50%. Among these methods, the proposed OMES provides good image quality, which is able to hide information without severe artifact, and it also yields extremely high embedded capacity. VI. CONCLUSION This paper presents a high payload watermarking in multiple halftone images using the OMES. Employing the concept that a vector can be used to represent an information bit of a watermark, the proposed OMES effectively shares a watermark into two halftone images with data capacity 50%. The image quality can be further improved when the difference between the number of the host images and the number of the embedded watermarks is increased, since more potential selectable states are available. Moreover, the proposed LMS-based encoder can also be employed to enhance the image quality. As documented in the experimental results, the image quality of the proposed OMES is significantly superior to the pervious MEBS under the same embedded capacity. Moreover, it can guard against most frequently happened cropping and PS attacks. To withstand the PS attack, the PS effect correction technology is also developed to cope with the zooming, rotation, and dot gain darkening effect. Due to the high capacity nature of the proposed method, it is also applicable to secret communication application. It is noteworthy that when the marked images are cropped, the watermark can be synchronized in the decoder when the decoder is aware of the size of a marked image and the location of each cropped areas (visually awareness). However, this is the ideal case. The receiver is simply aware of the cropped areas without the knowledge of the original size of the marked image and which location the cropped areas belong to. This scenario leads to a receiver that does not know the size of the overlapped area. This problem can possibly be solved by embedding some anchors for calibrating a cropped marked image in future work. REFERENCES [1] R. Ulichney, Digital Halftoning. Cambridge, MA: MIT Press, 1987. [2] R. W. Floyd and L. Steinberg, “An adaptive algorithm for spatial gray scale,” in Proc. SID 75 Dig.: Soc. Inf. Display, 1975, pp. 36–37. [3] J. F. Jarvis, C. N. Judice, and W. H. Ninke, “A survey of techniques for the display of continuous-tone pictures on bilevel displays,” Comp. Graph. Image Proc., vol. 5, pp. 13–40, 1976. [4] P. Stucki, MECCA-A Multiple-Error Correcting Computation Algorithm for Bilevel Image Hardcopy Reproduction IBM Res. Lab., Zurich, Switzerland, Res. Rep. RZ1060, 1981.
2811
[5] J. N. Shiau and Z. Fan, “A set of easily implementable coefficients in error diffusion with reduced worm artifacts,” Proc. SPIE, vol. 2658, pp. 222–225, 1996. [6] V. Ostromoukhov, “A simple and efficient error-diffusion algorithm,” in Proc. Comput. Graph. (SIGGRAPH), 2001, pp. 567–572. [7] D. Anastassiou and S. Kollias, “Digital image halftoning using neural networks,” Proc. SPIE, vol. 1001, pp. 1062–1069, 1988. [8] D. Anastassion, “Error diffusion coding for A/D conversion,” IEEE Trans. Circuits Syst., vol. 36, no. 9, pp. 1175–1186, Sep. 1989. [9] A. Zaknor, S. Lin, and F. Eskafi, “A new class of B/W and color halftoning algorithm,” in Proc. Int. Conf. Acoust., Speech, Signal Process., Toronto, ON, Canada, May 1991, vol. 4, pp. 2801–2804. [10] M. Analoui and J. P. Allebach, “Model based halftoning using direct binary search,” in Proc. SPIE, Human Vision, Visual Proc., Digital Display III, San Jose, CA, Feb. 1992, vol. 1666, pp. 96–108. [11] J. B. Mulligan and A. J. Ahumada, Jr., “Principled halftoning based on models of human vision,” in Proc. SPIE, Human Vision, Visual Proc., Digital Display III, San Jose, CA, Feb. 1992, vol. 1666, pp. 109–121. [12] D. E. Knuth, “Digital halftones by dot diffusion,” ACM Trans. Graph., vol. 6, no. 4, pp. 245–273, Oct. 1987. [13] M. Mese and P. P. Vaidyanathan, “Optimized halftoning using dot diffusion and methods for inverse halftoning,” IEEE Trans. Image Process., vol. 9, no. 4, pp. 691–709, Apr. 2000. [14] H. Z. Hel-Or, “Watermarking and copyright labeling of printed images,” J. Electron. Imag., vol. 10, no. 3, pp. 794–803, Jul. 2001. [15] J. R. Goldschneider, E. A. Riskin, and P. W. Wong, “Embedded color error diffusion,” in Proc. IEEE Int. Conf. Image Process., 1996, vol. 1, pp. 565–568. [16] J. R. Goldschneider, E. A. Riskin, and P. W. Wong, “Embedded multilevel error diffusion,” IEEE Trans. Image Process., vol. 6, no. 7, pp. 956–964, Jul. 1997. [17] M. S. Fu and O. C. Au, “Hiding data in halftone image using modified data hiding error diffusion,” in Proc. SPIE Conf. Vis. Commun. Image Process., 2000, vol. 4067, pp. 1671–1680. [18] S.-G. Wang and K. T. Knox, “Embedding digital watermarks in halftone screens,” in Proc. SPIE Conf. Security Watermarking Multimedia Contents II, 2000, vol. 3971, pp. 218–227. [19] M. S. Fu and O. C. Au, “Data hiding by smart pair toggling for halftone images,” in Proc. IEEE Int. Conf. Acoust., Speech Signal Process., June 2000, vol. 4, pp. 2318–2321. [20] M. S. Fu and O. C. Au, “Halftone image data hiding with intensity selection and connection selection,” Signal Process.: Image Commun., vol. 16, no. 10, pp. 909–930, 2001. [21] M. S. Fu and O. C. Au, “Data hiding watermarking for halftone images,” IEEE Trans. Image Process., vol. 11, no. 4, pp. 477–484, Apr. 2002. [22] C. W. Wu, “Multimedia data hiding and authentication via halftoning and coordinate projection,” Eurasip J. Appl. Signal Process., vol. 2002, no. 2, pp. 143–151, Feb. 2002. [23] S. C. Pei and J. M. Guo, “High-capacity data hiding in halftone images using minimal-error bit searching and least-mean square filter,” IEEE Trans. Image Process., vol. 15, no. 6, pp. 1665–1679, Jun. 2006. [24] J. Mannos and D. Sakrison, “The effects of a visual fidelity criterion on the encoding of images,” IEEE Trans. Inf. Theory, vol. IT-20, no. 4, pp. 526–536, Jul. 1974. [25] Z. Wang and A. C. Bovik, “A universal image quality index,” IEEE Signal Process. Lett., vol. 9, no. 3, pp. 81–84, Mar. 2002. [26] N. Damera-Venkata, T. D. Kite, W. S. Geisler, B. L. Evans, and A. C. Bovik, “Image quality assessment based on a degradation model,” IEEE Trans. Image Process., vol. 9, no. 4, pp. 636–650, Apr. 2000. [27] A. Shamir, “How to share a secret,” Commun. ACM, vol. 22, pp. 612–613, 1979. [28] D. L. Lau and G. R. Arce, Modern Digital Halftoning. New York: Marcel Dekker, 2001. [29] B. K. Lien and W.-D. Pei, “Reversible data hiding for ordered dithered halftone images,” in Proc. Int. Conf. Image Processing, 2009, pp. 4237–4240, art. no. 5413515. [30] M. Guo and H. Zhang, “High capacity data hiding for binary image authentication,” in Proc. Int. Conf. Pattern Recognition, 2010, pp. 1441–1444, art. no. 5597537. [31] Z. Wang and G. R. Arce, “Halftone visual cryptography by iterative halftoning,” in Proc. IEEE Int. Conf. Acoustics, Speech and Signal Processing, 2010, pp. 1822–1825, art. no. 5495395. [32] M. Ulutas, “Meaningful share generation for increased number of secrets in visual secret-sharing scheme,” Math. Problems Eng., 2010, art. no. 593236. [33] Y. Shen and Y. Ye, “Visual cryptography based multiparty copyright protect scheme,” in Proc. IEEE Int. Conf. Advanced Computer Control, 2010, pp. 223–226, art. no. 5486685.
2812
Jing-Ming Guo (M’06–SM’10) was born in Kaohsiung, Taiwan, on November 19, 1972. He received the B.S.E.E. and M.S.E.E. degrees from National Central University, Taoyuan, Taiwan, in 1995 and 1997, respectively, and the Ph.D. degree from the Institute of Communication Engineering, National Taiwan University, Taipei, Taiwan, in 2004. From 1998 to 1999, he was an Information Technique Officer with the Chinese Army. He is currently a Professor in the Department of Electrical Engineering, National Taiwan University of Science and Technology, Taipei. His research interests include multimedia signal processing, multimedia security, digital halftoning, and digital watermarking. Dr. Guo is a senior member of the IEEE Signal Processing Society. He received the Excellence Teaching Award in 2009, the Research Excellence Award in 2008, the Acer Dragon Thesis Award in 2005, the Outstanding Paper Awards from the Chinese Image Processing and Pattern Recognition Society (IPPR), Computer Vision and Graphic Image Processing in 2005 and 2006, and the Outstanding Faculty Award in 2002 and 2003. From 2003 to 2004, he was granted the National Science Council scholarship for advanced research from the Department of Electrical and Computer Engineering, University of California, Santa Barbara.
IEEE TRANSACTIONS ON IMAGE PROCESSING, VOL. 20, NO. 10, OCTOBER 2011
Yun-Fu Liu (S’09) was born in Hualien, Taiwan, on October 30, 1984. He received the M.S.E.E. degree from the Department of Electrical Engineering, Chang Gung University, Taoyuan, Taiwan, in 2009. He is currently working toward the Ph.D. degree at the Department of Electrical Engineering, National Taiwan University of Science and Technology, Taipei, Taiwan. His research interests include digital halftoning, digital watermarking, pattern recognition, and intelligent surveillance system. Mr. Liu is a student member of the IEEE Signal Processing Society. He received the Special Jury Award from Chimei Innolux Corporation in 2009, and the 3rd Master’s Thesis Award from Fuzzy Society, Taiwan, in 2009.