INITIATE COVERAGE
Thailand
Gulf Energy Development (GULF.BK/GULF TB)
เข้ ามาทีหลัง แต่ ขนาดใหญ่ ไม่ ใช่ เล่น
Neutral‧Initiate Price as of 26 Apr 2018
67.50
12M target price (Bt/shr)
68.00
Unchanged/Revised up (down)
N.A.
(%)
Upside/downside (%)
0.7
Key messages
เราเริ่ มดูแลหุ ้น GULF ด้วยคาแนะนาถือ และให้ราคา เป้ าหมาย DCF ปี 2561 ที่ 68.00 บาท ถึงเราจะมองว่าบริ ษทั มี แผนขยายกาลังการผลิตที่น่าสนใจในอีก 8 ปี ข้างหน้าซึ่ งจะทา ให้กาไรโตถึง 34.4% CAGR ในช่ วงปี 2561-2568 ซึ่ งเป็ น ระดับการเติบโตที่โดดเด่นเมื่อเทียบกับหุ ้นอื่นในกลุ่ม แต่เรา เชื่อว่าปั จจัยบวกต่างๆ สะท้อนในราคาหุ ้นไปหมดแล้ว จึงทา ให้เหลือ upside ถึงราคาเป้ าหมายของเราอีกไม่มาก เรามองว่า upside จะมาจาก i) บริ ษทั ได้โครงการใหม่ๆ เพิ่มอีก ii) ประสิ ทธิภาพการผลิตดีเกินคาดจากโครงการ tie-line iii) นโยบายระเบียงเศรษฐกิจภาคตะวันออก (EEC) ช่วยให้อุป สงค์การใช้ไฟจากลูกค้าอุตสาหกรรมเพิ่มขึ้น และ iv) ต้นทุน การก่อหนี้ลดลงจากการ refinance หนี้เดิม ซึ่ งจะเป็ นปั จจัย หลักที่ทาให้หุ้น GULF กลับมาน่าสนใจอีกครั้ง Trading data Mkt cap (Btbn/US$mn) Outstanding shares (mn) Foreign ownership (mn) 3M avg. daily trading (mn) 52-week trading range (Bt) Performance (% ) Absolute Relative
3M -8.2 -5.4
144/4056 2,133 794.9 14.0 51-77.5 6M 12M
n.a. n.a.
n.a. n.a.
Quarterly EPS Bt 2015 2016 2017
Q1 n.a. n.a. 0.52
Q2 n.a. n.a. 0.32
Q3 n.a. n.a. 0.32
Q4 n.a. n.a. 0.46
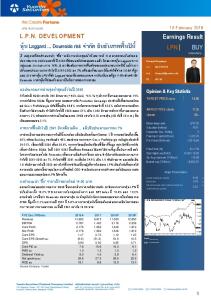
Share price chart 85
50
80 75
40
70
30
65
20
60 10
55 50
0
45 Dec-17
(10)
Event เราเริ่ มดูแลหุ ้น GULF ด้วยคาแนะนาถือ ถึงเราจะมองว่าอัตราการเติบโตของกาไรจะน่าสนใจที่สุดใน กลุ่ม แต่ราคาหุ ้นก็เหลือ upside ถึงราคาเป้ าหมายของเราอีกไม่มาก ซึ่ งเรามองว่าการมี upside เพิ่ม มากกว่านี้ก็จะทาให้หุ้นตัวนี้ กลับมาน่าสนใจอีกครั้ง lmpact แผนเพิม่ กาลังการผลิตยาวนานที่สุด บริ ษทั มีแผนจะเพิ่มกาลังการผลิตอย่างมีนยั สาคัญถึง 3.9GW ในช่วงปี 2561-2567 (+195%) เป็ น 5.9GW ถือเป็ นแผนการเพิ่มกาลังการผลิตที่ยาวนานที่สุด และจะทาให้กาลังการผลิตแซงหน้าคู่แข่งทุกราย ซึ่ง การที่แผนขยายกาลังการผลิตใช้เวลานานก็หมายถึงแนวโน้มการเติบโตของกาไรที่ยาวขึ้นไปโดยปริ ยาย ด้วย เราประเมินว่ากาไรจากธุรกิจหลักของบริ ษทั จะโตถึง 34.4% CAGR ในช่วงปี 2561-68 ซึ่งเป็ น ระดับการเติบโตที่โดดเด่นเมื่อเทียบกับหุ ้นอื่นในกลุ่ม นอกจากนี้ เรายังคาดว่ากาไรปกติในปี นี้ ของบริ ษทั ก็น่าจะโตแรงสุ ดในกลุ่มที่ 144% จากการเริ่ มเปิ ดดาเนินการโรงไฟฟ้ า SPPs 4 โครงการในปี นี้ และการ รับรู้ผลการดาเนินงานเต็มปี จากโรงไฟฟ้ า SPPs 5 โครงการที่เริ่ มเปิ ดดาเนิ นการเชิงพาณิ ชย์ในปี 2561 PPA ที่ยาวและอายุยงั น้ อย หมายถึงแนวโน้ มการเติบโตที่ชัดเจน เราคิดว่ากาไรของ GULF จะเติบโตในอัตราที่น่าสนใจในระยะ 8 ปี จากนี้ เนื่ องจากกาลังการผลิต ประมาณ 96% อิงอยูก่ บั สัญญาขายไฟระยะยาวที่ทาไว้กบั การไฟฟ้ าฝ่ ายผลิตแห่ งประเทศไทย (กฟผ.) นอกจากนี้ บริ ษทั ยังมีสญ ั ญา PPA ที่อายุนอ้ ยมาก โดยยังมีอายุเฉลี่ยเหลืออีกถึง 27 ปี ซึ่ งสู งกว่าค่าเฉลี่ย ของกลุ่มที่ 19 ปี ปัจจัยกระตุ้นสี่ตัวที่จะช่ วยสร้ าง upside เรามองว่ามีปัจจัยสี่ ตวั ที่อาจะช่วยกระตุน้ ให้เกิด upside ได้ ประกอบด้วย i) บริ ษทั ได้โครงการใหม่ๆ เพิ่ม อีก ii) ประสิ ทธิ ภาพการผลิตดีเกินคาดจากการทา tie-line iii) นโยบายระเบียงเศรษฐกิจภาคตะวันออก (EEC) ช่วยให้อุปสงค์การใช้ไฟจากลูกค้าอุตสาหกรรมเพิ่มขึ้น และ iv) ต้นทุนการก่อหนี้ ลดลงจากการ refinance หนี้ เดิม ซึ่งจะทาให้ประมาณการกาไรมี upside เพิ่มขึ้นอีก ซึ่งจากปั จจัยกระตุน้ ทั้งสี่ ตวั นี้ เรา มองว่าประเด็นการได้โครงการใหม่จะสร้าง upside ให้กบั มูลค่าอย่างเป็ นชิ้นเป็ นอันมากที่สุด แต่อย่างไร ก็ตาม บริ ษทั ยังมีประสบการณ์การทาโครงการที่ไม่หลากหลายนักทั้งในแง่ของประเทศที่ดาเนิ นการ และประเภทของโรงไฟฟ้ า แถมยังมีภาระหนี้ สูงก็ถือเป็ นข้อจากัดสาหรับการลงทุนในช่วงต้น Valuation & Action เราเริ่ มดูแลหุ ้น GULF ด้วยคาแนะนาถือ และให้ราคาเป้ าหมาย DCF ปี 2561 ที่ 68.00 บาท ถึงเราจะมอง ว่าบริ ษทั มีแผนขยายกาลังการผลิตที่น่าสนใจในอีก 8 ปี ข้างหน้า ซึ่ งจะทาให้อตั ราการเติบโตของกาไรอยู่ ในขาขึ้น แต่เราเชื่ อว่าปัจจัยบวกต่างๆ สะท้อนในราคาหุ ้นไปหมดแล้ว จึงทาให้เหลือ upside ถึงราคา เป้ าหมายของเราอีกไม่มาก ซึ่ งจากราคาปิ ดล่าสุ ด ราคาหุ ้นคิดเป็ น PER ปี 61 ที่สูงถึง 53. ซึ่ งสู งกว่า ค่าเฉลี่ยของกลุ่มที่ 25.6x นอกจากนี้ เรามองว่าเงินปั นผลก็จะยังไม่น่าสนใจจนกว่าทุกโครงการของ บริ ษทั จะเริ่ มเปิ ดดาเนิ นการครบหมด Risks มีการปิ ดโรงไฟฟ้ านอกแผน, ขาดแคลนวัตถุดิบ feed stock, เกิดความล่าช้าในการก่อสร้างโครงการใหม่, และอัตราแลกเปลี่ยนผันผวน Key financials and valuations Dec - 19F 28,159 3,905 3,905 45.3 45.3 1.83 0.73 45.3 36.9 3.3 7.8 133.2 1.1 9.0
Dec - 20F 38,924 4,117 4,117 5.4 5.4 1.93 0.77 5.4 35.0 3.1 8.6 153.5 1.1 8.8
*The Company may be issuer of Derivative Warrants on these securities.
1
Feb-18 Share Price
Source: SET
Voranart Meethavorn 66.2658.8888 Ext.8856
[email protected]
Price performance relative to SET
Revenue (Btmn) Net Profit (Btmn) Normalized Profit (Btmn) Net Profit Growth (%) Normalized Profit Growth (%) EPS (Bt) DPS (Bt) EPS Growth (%) P/E (X) P/B (X) EV/EBITDA (X) Net Debt to Equity (%) Dividend Yield (%) Return on Average Equity (%)
Dec - 16A 4,350 418 450 151.5 161.7 1.49 n.a. 143.8 n.a. n.a. 68.9 1,344.0 n.a. 11.0
Dec - 17A 15,374 3,451 1,104 726.6 145.5 1.62 0.40 8.3 40.2 3.5 9.3 93.4 0.6 8.8
Dec - 18F 25,575 2,688 2,688 (22.1) 143.6 1.26 0.50 (22.1) 53.6 3.6 9.4 114.5 0.7 6.7
Source: Company data, KGI Research
April 27, 2018
http://research.kgi.com; Bloomberg: KGIT
Please see back page for disclaimer
Thailand
Gulf Energy Development
Figure 1: 1Q18 earnings preview Bt mn Revenue Gross Profit SG&A Operating Profit Operating EBITDA Non-Operating Income/(Expense) Equity Income/(Loss) Interest expense Net Profit Normalized profit EPS (Bt) Normalized EPS (Bt) Percent Gross margin EBIT margin SG&A/sales
1Q18F 3,405 901 243 701 919 615 632 467 1,210 595 0.57 0.28 1Q18F 26.5 20.6 7.1
1Q17 YoY (%) 44 7,578.2 (9) 9,691.8 138 76.2 (140) 599.3 (139) 760.7 978 (37.1) 626 1.0 282 65.5 1,107 9.2 130 358.0 0.52 9.2 0.06 358.0 1Q17 YoY (ppts) (21.2) n.a. (316.6) n.a. 311.1 (304.0)
4Q17 QoQ (%) 2,388 42.6 655 37.6 278 (12.5) 412 70.4 569 61.4 573 7.4 616 2.7 422 10.7 982 23.2 409 45.3 0.46 23.2 0.19 45.3 4Q17 QoQ (ppts) 27.4 (1.0) 17.2 3.4 11.6 (4.5)
Source: Company data, KGI Research
Figure 2: GULF's portfolio Power plants
Power type
Location
COD/SCOD
Operating project GNS GUT GKP1 GKP2 GTLC GNNK GNLL GCRN GNK2 Gulf solar GVTP GTS1 GTS2 GTS3 GTS4 GNC
Natural gas Natural gas Natural gas Natural gas Natural gas Natural gas Natural gas Natural gas Natural gas Solar Natural gas Natural gas Natural gas Natural gas Natural gas Natural gas
Saraburi Ayudhya Saraburi Saraburi Saraburi Chachengsao Rayong Pathunthani Saraburi Chonburi, Rayong, Saraburi Rayong Rayong Rayong Rayong Rayong Prachinburi
Jun 14, Dec 14 Jun 15, Dec 15 Jan-13 Feb-13 Mar-13 Apr-13 May-13 Jul-13 Oct-13 2014-15 May-17 Jul-17 Sep-17 Nov-17 Jan-18 Mar-18
Future project GBL GBP GNLL2 GNPM GNRV1 GNRV2 GCG GSRC GPD
Natural gas Natural gas Natural gas Natural gas Natural gas Natural gas Biomass Natural gas Natural gas
Ayudhya Ayudhya Rayong Saraburi Nakorn Ratchasrima Nakorn Ratchasrima Songkhla Chonburi Rayong
Sep-18 Sep-18 Jan-19 Mar-19 May-19 Jul-19 Mar-20 Unit 1-2: 2021, Unit 3-4: 2022 Unit 1-2: 2023, Unit 3-4: 2024
Effective shareholding
Contracted capacity (MW)
Effective capacity (MW)
40% 1,600 40% 1,600 40% 110 40% 112 40% 116 40% 110 30% 120 40% 117 40% 132 75% 0.6 52% 124 52% 127 52% 131 52% 130 52% 124 70% 105 Total operating project capacity
640 640 44 45 46 44 36 47 53 0.4 65 67 69 68 65 73 2,002
53% 120 53% 118 52% 116 70% 92 70% 111 70% 91 100% 21 70% 2,500 70% 2,500 Total future project capacity
63 62 61 64 78 64 21 1,750 1,750 3,912
Source: Company data, KGI Research Industrial users
EGAT
April 27, 2018
*The Company may be issuer of Derivative Warrants on these securities. http://research.kgi.com; Bloomberg: KGIT
Please see back page for disclaimer
2
Thailand
Gulf Energy Development
Figure 3: Company profile
Figure 4: Core profit continue grow in 2018-20
Gulf Energy Development Public Company Limited (GULF) is one
Profit growth, percent (LHS), Core profit, Btbn (RHS)
of
the
leading
power
another
3.8GW
is
producers
expected
to
in
Thailand.
During
commercialize,
2018-24,
making
its
200
total
150
effective capacity increase to 5.9GW. The company sells electricity
100
5.0 4.0 3.0 2.0
to the Electricity Generating Authority of Thailand (EGAT) and industrial
users
in
industrial
estates
through
Independent
Power
Producer (IPP) and Small Power Producers (SPP) programs and
50
1.0
0
0.0
2016A
2017A
sell electricity to the Provincial Electricity Authority (PEA) through
2018F
Core profit
2019F
2020F
Core profit growth
Very Small Power Producers (VSPP) program. Source: Company data
Source: Company data, KGI Research
Figure 5: Capacity to rise to 5.9GW in 2024
Figure 6: Expansion program
Power capacity, GW
2018
2019
GTS4 (Cogen)
GNLL2 (Cogen)
GNC (Cogen)
GNPM (Cogen)
GBL (Cogen)
GNRV1 (Cogen)
GBP (Cogen)
GNRV2 (Cogen)
2020
2021
2022
2023
2024
GSRC unit3-4
GPD unit1-2
GPD unit3-4
7.0 6.0
GCG GSRC (Biomass) unit1-2
5.0 4.0 3.0
2.0 1.0 0.0 2016A 2017A 2018F 2019F 2020F 2021F 2022F 2023F 2024F Source: Company data, KGI Research
Source: Company data, KGI Research
Figure 7: Heavy debt during development phase
Figure 8: Contract with EGAT as majority in portfolio
IBD/E and D/E, times
Percent Industrial users
3.0 2.5
4.4
2.0 1.5 1.0 0.5 0.0 2019F
2020F
2022F
2023F
95.6
2024F
Source: Company data, KGI Research Note: PER bases on target price and core EPS 18
EGCO
RATCH
TPCH
GULF
CKP
BGRIM
0.0
GUNKUL
0.0
TPCH
1.0
GPSC
10.0 BCPG
2.0
WHAUP
3.0
20.0
GLOW
4.0
30.0
BPP
5.0
40.0
RATCH
6.0
50.0
EGCO
60.0
BPP
PEG, times
WHAUP
Figure 10: PEG comparison
PER, times
BGRIM
Figure 9: PER comparison
CKP
Source: Company data, KGI Research
GUNKUL
Source: Company data, KGI Research
April 27, 2018
EGAT
Interest bearing debt/E
BCPG
D/E
2021F
GPSC
2018F
GULF
2017A
Source: Company data, KGI Research Note: Calculation based on PER 18 and CAGR 2018-20
*The Company may be issuer of Derivative Warrants on these securities. http://research.kgi.com; Bloomberg: KGIT
Please see back page for disclaimer
3
Thailand
Gulf Energy Development
Quarterly Income Statement Mar-15A
Jun-15A
Sep-15A
Dec-15A
Mar-16A
Jun-16A
Sep-16A
Dec-16A
Mar-17A
Jun-17A
Sep-17A
Dec-17A
Revenue Cost of Goods Sold
n.a. n.a.
n.a. n.a.
n.a. n.a.
n.a. n.a.
n.a. n.a.
n.a. n.a.
n.a. n.a.
n.a. n.a.
44 (54)
408 (338)
1,510 (1,162)
2,388 (1,732)
Gross Profit Operating Expenses Other incomes
n.a. n.a. n.a.
n.a. n.a. n.a.
n.a. n.a. n.a.
n.a. n.a. n.a.
n.a. n.a. n.a.
n.a. n.a. n.a.
n.a. n.a. n.a.
n.a. n.a. n.a.
(9) (138) 7
70 (333) 90
348 (209) 66
655 (278) 34
Operating Profit Depreciation of fixed assets
n.a. n.a.
n.a. n.a.
n.a. n.a.
n.a. n.a.
n.a. n.a.
n.a. n.a.
n.a. n.a.
n.a. n.a.
(140) (1)
(173) (39)
206 (172)
412 (158)
Operating EBITDA Non-Operating Income Interest Income Other Non-op Income
n.a. n.a. n.a. n.a.
n.a. n.a. n.a. n.a.
n.a. n.a. n.a. n.a.
n.a. n.a. n.a. n.a.
n.a. n.a. n.a. n.a.
n.a. n.a. n.a. n.a.
n.a. n.a. n.a. n.a.
n.a. n.a. n.a. n.a.
(139) 978 0 978
(134) 292 (64) 356
378 396 (45) 442
569 637 65 573
Non-Operating Expenses Interest Expenses Other Non-op Expenses
n.a. n.a. n.a.
n.a. n.a. n.a.
n.a. n.a. n.a.
n.a. n.a. n.a.
n.a. n.a. n.a.
n.a. n.a. n.a.
n.a. n.a. n.a.
n.a. n.a. n.a.
(282) (282) 0
(326) (326) 0
(397) (397) 0
(422) (422) 0
Equity Income/(Loss) Pre-tax Profit Current Taxation Minorities Extraordinary items
n.a. n.a. n.a. n.a. n.a.
n.a. n.a. n.a. n.a. n.a.
n.a. n.a. n.a. n.a. n.a.
n.a. n.a. n.a. n.a. n.a.
n.a. n.a. n.a. n.a. n.a.
n.a. n.a. n.a. n.a. n.a.
n.a. n.a. n.a. n.a. n.a.
n.a. n.a. n.a. n.a. n.a.
626 1,181 30 (104) 0
830 623 29 (30) 0
557 762 1 (132) 0
616 1,242 (5) (190) 0
n.a. n.a. n.a. n.a.
n.a. n.a. n.a. n.a.
n.a. n.a. n.a. n.a.
n.a. n.a. n.a. n.a.
n.a. n.a. n.a. n.a.
n.a. n.a. n.a. n.a.
n.a. n.a. n.a. n.a.
n.a. n.a. n.a. n.a.
1,107 130 0.52 0.06
686 331 0.32 0.16
676 234 0.32 0.11
982 409 0.46 0.19
n.a. n.a. n.a. n.a.
n.a. n.a. n.a. n.a.
n.a. n.a. n.a. n.a.
n.a. n.a. n.a. n.a.
n.a. n.a. n.a. n.a.
n.a. n.a. n.a. n.a.
n.a. n.a. n.a. n.a.
n.a. n.a. n.a. n.a.
(21.2) (316.6) (313.6) 2,497.1
17.2 (42.4) (32.9) 168.1
23.1 13.6 25.0 44.8
27.4 17.2 23.8 41.1
n.a. n.a. n.a. n.a. n.a.
n.a. n.a. n.a. n.a. n.a.
n.a. n.a. n.a. n.a. n.a.
n.a. n.a. n.a. n.a. n.a.
n.a. n.a. n.a. n.a. n.a.
n.a. n.a. n.a. n.a. n.a.
n.a. n.a. n.a. n.a. n.a.
n.a. n.a. n.a. n.a. n.a.
820.8 23.4 (3.5) (38.0) 154.7
269.8 (218.8) (381.8) (1.5) (29.2)
58.1 99.9 50.5 45.3 74.8
Income Statement (Bt mn)
Net Profit Normalized Profit EPS (Bt) Normalized EPS (Bt) Margins Gross profit margin Operating EBIT margin Operating EBITDA margin Net profit margin Growth Revenue growth Operating EBIT growth Operating EBITDA growth Net profit growth Normalized profit growth
n.a. n.a. n.a. n.a. n.a.
Source: KGI Research
Peer comparison – Key valuation stats Rating Conventional BGRIM OP BPP* OP CKP* U EGCO* OP GLOW N GPSC* U GULF N RATCH OP WHAUP OP Sector Renewable BCPG* UR GUNKUL* OP TPCH OP Sector Rating Neutral
Target Current Upside price (Bt) price (Bt) (%)
17 core EPS (Bt)
18F core EPS (Bt)
19F core EPS (Bt)
18F EPS 19F EPS 18F PER 19F PER 18F PBV 19F PBV 18F Div 19F Div 18F ROAE 19F ROAE gr. (%) gr. (%) (x) (x) (X) (X) Yield (%) Yield (%) (%) (%)
29.00 32.00 3.20 278.00 88.00 59.00 68.00 66.00 8.50
27.25 24.40 3.82 226.00 86.50 74.25 67.50 52.00 6.30
6.4 31.1 (16.2) 23.0 1.7 (20.5) 0.7 26.9 34.9
0.41 1.83 0.04 18.56 5.34 2.12 0.52 4.49 0.37
0.76 2.03 0.08 18.66 5.39 2.75 1.26 5.02 0.45
0.95 2.10 0.11 19.09 5.42 2.88 1.83 5.12 0.48
85.7 11.4 104.7 0.5 1.1 29.9 143.6 11.8 21.4
24.8 3.5 40.4 2.3 0.4 4.5 45.3 2.0 7.7
35.9 12.0 49.5 12.1 16.0 27.0 53.6 10.4 14.1 25.6
28.8 11.6 35.2 11.8 16.0 25.8 36.9 10.1 13.1 21.0
2.5 1.6 0.9 1.1 2.1 2.6 3.6 1.1 1.8 1.9
2.3 1.5 0.9 1.1 2.1 2.5 3.3 1.0 1.7 1.8
1.4 1.7 1.7 3.3 6.6 2.4 0.7 4.8 3.5 2.9
1.7 1.7 2.0 3.5 6.6 2.5 1.1 5.0 3.8 3.1
7.1 13.7 1.8 9.3 13.4 9.7 6.7 10.2 12.7 9.4
8.0 12.7 2.5 9.0 13.2 9.7 9.0 9.9 12.8 9.6
20.00 4.90 22.50
19.30 2.96 9.75
3.6 65.5 130.8
0.83 0.08 0.67
0.94 0.15 0.99
1.10 0.25 1.85
14.0 82.4 47.8
16.1 62.7 86.7
20.5 19.1 9.8 16.5
17.6 11.8 5.3 11.5
2.5 2.0 1.2 1.9
2.4 1.9 0.9 1.7
2.4 2.6 2.0 2.4
2.8 4.3 3.8 3.6
12.4 10.7 12.2 11.8
13.4 16.0 17.6 15.6
Source: KGI Research
25.0 20.0 15.0
10.0 5.0 BCPG
CKP
BGRIM
GUNKUL
TPCH
0.0
6.0 5.0 4.0
April 27, 2018
*The Company may be issuer of Derivative Warrants on these securities. http://research.kgi.com; Bloomberg: KGIT
3.0
Please see back2.0page for disclaimer
4
Thailand
Gulf Energy Development
Balance Sheet As of 31 Dec (Bt mn) Total Assets Current Assets Cash & STInvestments Inventories Accounts Receivable Others Non-current Assets LTInvestments Net fixed Assets Others Total Liabilities Current Liabilities Accounts Payable STBorrowings Others Long-term Liabilities Long-termDebts Others Shareholders' Equity Common Stock Capital Surplus Retained Earnings Preferred Stock
Profit & Loss 2016 54,301 5,514 2,766 0 38 2,711 48,787 18,502 29,913 373 56,033 12,007 49 494 11,464 44,026 43,866 160 3,782 280 0 (1,409) 0
2017 75,708 24,944 20,222 1 1,660 3,061 50,764 20,436 50,547 (20,219) 61,304 7,047 791 572 5,684 54,257 53,898 359 39,348 2,133 20,889 1,935 0
2018F 86,416 14,613 8,694 0 2,460 3,459 71,803 20,536 60,969 (9,702) 60,915 9,191 2,306 200 6,685 51,724 51,340 384 40,114 2,133 20,889 3,548 0
2019F 100,977 13,983 6,694 0 2,813 4,476 86,994 20,636 75,415 (9,057) 71,526 10,159 2,558 200 7,401 61,367 61,111 256 43,434 2,133 20,889 5,891 0
2020F 117,465 12,172 5,555 0 3,097 3,520 105,293 20,736 91,951 (7,394) 82,703 8,247 1,408 200 6,639 74,457 74,175 282 46,933 2,133 20,889 8,361 0
Year to 31 Dec (Bt mn) Revenue Cost of Goods Sold Gross Profit Operating Expenses Other Incomes Operating Profit Depreciation of fixed assets Operating EBITDA Non-Operating Income Interest Income Other Non-op Income Non-Operating Expenses Interest Expenses Other Non-op Expenses Equity Income/(Loss) Pre-tax Profit Current Taxation Minorities Extraordinary items Net Profit Normalized Profit EPS(Bt) Normalized EPS(Bt)
Source: KGI Research
Source: KGI Research
Key Ratios
Cash Flow
Year to 31 Dec Growth (% YoY) Sales OP EBITDA NP Normalized Profit EPS Normalized EPS Profitability (%) Gross Margin Operating Margin EBITDA Margin Net Profit Margin ROAA ROAE Stability Gross Debt/Equity (%) Net Debt/Equity (%) Interest Coverage (x) Interest & STDebt Coverage (x) Cash Flow Interest Coverage (x) Cash Flow/Interest & STDebt (x) Current Ratio (x) Quick Ratio (x) Net Debt (Bt mn) Per Share Data (Bt) EPS Normalized EPS CFPS BVPS SPS EBITDA/Share DPS Activity Asset Turnover (x) Days Receivables Days Inventory Days Payable Cash Cycle Keys drivers Effective capacity (MW) Source: KGI Research
April 27, 2018
2016
2017
2018F
2019F
2020F
1,705.3 9.1 (341.3) 151.5 161.7 143.8 152.6
253.4 (169.3) 482.3 726.6 145.5 8.3 (67.8)
66.4 767.6 17.2 (22.1) 143.6 (22.1) 143.6
10.1 74.2 43.6 45.3 45.3 45.3 45.3
38.2 9.8 8.0 5.4 5.4 5.4 5.4
94.6 (10.1) 22.3 9.6 0.8 11.0
78.6 2.0 36.8 22.5 4.6 8.8
52.9 10.3 25.9 10.5 3.1 6.7
28.4 16.3 33.8 13.9 3.9 9.0
42.9 13.0 26.4 10.6 3.5 8.8
14.8 13.4 1.2 0.8 (1.5) (0.9) 0.5 0.5 50,835
1.6 0.9 3.7 2.6 (0.5) (0.4) 3.5 3.5 36,768
1.5 1.1 2.8 2.5 1.1 1.0 1.6 1.6 45,919
1.6 1.3 3.1 2.8 1.6 1.5 1.4 1.4 57,861
1.8 1.5 3.0 2.8 1.5 1.4 1.5 1.5 72,064
1.5 1.6 (4.1) 13.5 15.6 3.5 0.0
1.6 0.5 (0.3) 18.4 7.2 2.6 0.4
1.3 1.3 1.0 18.8 12.0 3.1 0.5
1.8 1.8 1.7 20.4 13.2 4.5 0.7
1.9 1.9 1.8 22.0 18.2 4.8 0.8
0.1 3.1 0.0 75.6 (72.5)
0.2 39.4 0.1 87.8 (48.3)
0.3 35.1 0.0 69.8 (34.7)
0.3 36.5 0.0 46.3 (9.9)
0.3 29.0 0.0 23.1 5.9
1,595
1,864
2,127
2,394
2,414
Year to 31 Dec (Bt mn) Operating Cash Flow Net Profit Depreciation & Amortization Change in Working Capital Others Investment Cash Flow Net CAPEX Change in LTInvestment Change in Other Assets Free Cash Flow Financing Cash Flow Change in Share Capital Net Change in Debt Change in Other LTLiab. Net Cash Flow
2016 4,350 (235) 4,115 (594) 149 3,671 (5) 970 (32) 0 (32) (792) (792) 0 1,437 4,283 47 197 0 418 450 1.49 1.61
2017 15,374 (3,286) 12,087 (957) 197 11,327 (370) 5,651 2,348 0 2,348 (1,428) (1,428) 0 2,629 14,876 54 (456) 0 3,451 1,104 1.62 0.52
2018F 25,575 (12,057) 13,518 (972) 292 12,837 (1,344) 6,621 0 0 0 (1,917) (1,917) 0 2,642 13,562 0 (672) 0 2,688 2,688 1.26 1.26
2019F 28,159 (20,152) 8,007 (1,058) 226 7,175 (2,267) 9,510 0 0 0 (2,361) (2,361) 0 2,652 7,465 0 (976) 0 3,905 3,905 1.83 1.83
2020F 38,924 (22,233) 16,692 (1,098) 213 15,807 (2,525) 10,267 0 0 0 (2,596) (2,596) 0 2,701 15,912 0 (1,029) 0 4,117 4,117 1.93 1.93
2016 (1,153) 418 5 91 (1,666) (34,739) (21,024) (15,222) 1,507 (35,892) 37,183 415 36,728 40 1,291
2017 (716) 3,451 370 (4,712) 174 (16,426) (20,990) (1,989) 6,552 (17,142) 34,601 7,872 3,077 23,652 17,459
2018F 2,100 2,688 1,344 37 (1,970) (9,663) (11,766) 89 2,014 (7,563) (4,021) 0 (2,099) (1,922) (11,584)
2019F 3,717 3,905 2,267 (780) (1,675) (15,044) (16,713) (6) 1,675 (11,326) 9,326 0 9,912 (586) (2,000)
2020F 3,776 4,117 2,525 (1,194) (1,672) (17,400) (19,061) (10) 1,672 (13,623) 12,484 0 13,101 (618) (1,139)
Source: KGI Research
Rates of Return on Invested Capital Year 2016 2017 2018F 2019F 2020F Year 2016 2017 2018F 2019F 2020F Year 2016 2017 2018F 2019F 2020F
+ COGS Revenue 5.3% 19.0% 41.9% 63.5% 50.6% 1/ Working Capital + Revenue 0.0 -0.3 0.0 0.0 0.0 x Operating Margin 77.5% 71.1% 47.9% 23.9% 39.5% 1-
Depreciation Revenue 0.1% 2.4% 5.3% 8.1% 6.5% Net PPE Revenue 6.9 3.3 2.4 2.7 2.4 Capital Turnover 0.1 0.2 0.3 0.3 0.3
+
+
x
Operating Exp. Revenue 17.1% 7.5% 4.9% 4.6% 3.4% Other Assets Revenue 5.6 1.6 1.0 0.9 0.7 Cash Tax Rate -27.0% -1.4% 0.0% 0.0% 0.0%
Operating Margin 77.5% 71.1% 47.9% 23.9% 39.5% = Capital Turnover 0.1 0.2 0.3 0.3 0.3 = After-tax Return on Inv. Capital -1.7% -0.2% 0.0% 0.0% 0.0% =
Source: KGI Research
*The Company may be issuer of Derivative Warrants on these securities. http://research.kgi.com; Bloomberg: KGIT
Please see back page for disclaimer
5
Thailand
Gulf Energy Development
Gulf Energy Development – Recommendation & target price history 80
75 70 65 60
55 50 Dec-17
Jan-18
Feb-18 Share price
Mar-18 Target price lowered
Apr-18 Target price raised
Source: KGI Research
KGI Locations
China
Shanghai Room 1507, Park Place, 1601 Nanjing West Road, Jingan District, Shanghai, PRC 200040 Room 24D1, 24/F, A Unit, Zhen Ye Building, 2014 Bao’annan Road,
Shenzhen
Shenzhen, PRC 518008
Taiwan
Taipei
700 Mingshui Road, Taipei, Taiwan Telephone 886.2.2181.8888 ‧
Hong Kong
41/F Central Plaza, 18 Harbour Road, Wanchai, Hong Kong Telephone 852.2878.6888
Thailand
Facsimile 886.2.8501.1691
Bangkok
Facsimile 852.2878.6800
8th - 11th floors, Asia Centre Building 173 South Sathorn Road, Bangkok 10120, Thailand Telephone 66.2658.8888
Singapore
Facsimile 66.2658.8014
4 Shenton Way #13-01 SGX Centre 2 Singapore 068807 Telephone 65.6202.1188 Facsimile 65.6534.4826
KGI's Ratings
Rating
Definition
Outperform (OP)
The stock's excess return over the next twelve months is ranked in the top 40% of KGI's coverage universe in the related market (e.g. Taiwan)..
Neutral (N)
The stock's excess return over the next twelve months is ranked in the range between the top 40% and the bottom 40% of KGI's coverage universe in the related market (e.g. Taiwan)
Under perform (U)
The stock's excess return over the next twelve months is ranked in the bottom 40% of KGI's coverage universe in the related market (e.g. Taiwan).
Not Rated (NR)
The stock is not rated by KGI.
Restricted (R)
KGI policy and/or applicable law regulations preclude certain types of communications, including an investment recommendation, during the course of KGI's engagement in an investment banking transaction and in certain other circumstances.
Excess return = 12M target price/current priceNote
Disclaimer
April 27, 2018
When an analyst publishes a new report on a covered stock, we rank the stock's excess return with those of other stocks in KGI's coverage universe in the related market. We will assign a rating based on its ranking. If an analyst does not publish a new report on a covered stock, its rating will not be changed automatically.
KGI Securities (Thailand) Plc. ( “The Company” ) disclaims all warranties with regards to all information contained herein. In no event shall the Company be liable for any direct, indirect or any damages whatsoever resulting from loss of income or profits, arising by utilization and reliance on the information herein. All information hereunder does not constitute a solicitation to buy or sell any securities but constitutes our sole judgment as of this date and are subject to change without notice.
*The Company may be issuer of Derivative Warrants on these securities. http://research.kgi.com; Bloomberg: KGIT
Please see back page for disclaimer
6