Journ al o f Scicnti li c & Industrial Research Vo l. 6 1, Novemhcr 2002. pp 940-947
Performance Evaluation of Public Research Institutes Using Principal Component Analysis D Kri shn a, S Rama Mohan*, and B S N Murthy Indi an Institu te of Chcmi ca l Techno logy. Hyderahad 500 007 and
A Ramakri shn a Rao Sri Ve nkat eslI'ura Un i ve rsi ty Co ll ege of Enginccring. Ti ru pati 5 17502 Received: II Ju ne 2002: accepted: 23A ugust 2002 Puhlic research institut es arc thc organi sati ons. wh ich carry ou t sc icn ti fic research and ren der technological services. Owing to the phenomenon of globali sat ion. re source con strailll s and i ncreased acco untahi lity. puhli c research institutes. espec iall y in the deve loping co untries. arc under treme ndous prcssure to impro ve thci r per l'ormancc. Th c necd tn impro ve performancc of these organizations nccessit::lles ev alu ating the performan ce or thc instilUtion in rclati on to other in sli tute s. I n thi s stud y. public research inst itu tes arc co nsidered as systems and so me models hased on statist ical co ncepts arc uti li/c d to com pare performance or dirrcrent research institu tes by measuring productivit y index or those in stilUtes. Pe rrormance ranki ng is done. based on produl'livit y index val ucs, Ranks obtained wit h the study are also compa red wi th those or the ex pcrt s Judgment I'or slUdying thc acc uracy ur the methodol og ies.
In trod uc tion
Public research institu tes are the organi sa ti ons. which carry out sc icntific research and ren der tech nol og ical se rvices . Nowada ys . these insti tutes have a fundamental role in a co untry's development. supporting businesses as they face the techno logica l i challe nges in the tu rbulent world sce nari o . Ow in g to the phen omenon of globalisati on. resource constrai nts and inc reased acco untabilit y. public resea rc h insti tutes. especia ll y in the de ve lop ing countr ies. are under treme nd ous press ure to improve the ir performance c. The need to imp rove performa nce of these organi sati ons necess itates evaluati ng the pe rformance of an insti tute in re lation to other institutes. For co mparin g performa nce of research institu tes. Cocc ia i proposed a method, called Re lev method whi ch measures the act ivit y of eac h researc h institute by num be r of ind ices and indi ces are co mb ined in a sim ple func ti on to ca lcula te know ledge scores fo r eac h institute. He ranked all the in stitutes
" Author ro r co rres pondence
on the ba sis of thei r knowledge scores. The need to imp rove pe rfo rmance of these organi sati ons places the elabora tion of me th odo logies fo r measuring prod uctivit y of research institutes ve ry mllch to the fo re front. Measuring prod ucti vity o r resea rch insti tutes is crucia ll y impo rtan t in dec isio n makin g fo r rhe leve l and directi on o f publi c funding for research and deve lopment (R&D). In this stud y. public resea rch instit utes are conside red as sys te ms and so me mode ls ba sed on stati stical concepts are ut ili sed to co mpare performa nce o f different researc h institutes by meas ur ing prod ucti vity o f th ose researc h inst itut es. This meth odo logy sy nthesises all the in put and output ind ica tors in single val ue scores and these input scores and output scores can be considered for fu rt her analys is and lO ca lc ul ate producti vit y values. Producti vity va lues of the in stitutes ca n be used to co mpare the ir pe rfo rman ce. These method s <.I re instruments in strategic plann ing and can be considered for improv ing the ove rall perfo rmance of researc h in stitutes.
KRISH NA el 01. : PERFO RM ANCE EVALUATIO
Research Institute as a System
A sys tem is a set, made up of elements interac tin g with eac h other, in order to reach a common goa l. The definition of a system 'as a collec ti on of part s organised for a purpose' is so general that any phenomenon, or organisation becomes a part of a particular sys tem or the other. Research in stitutes are particular systems, set up and run by men. who deve lop a process of scientific producti on, mainl y using publi c reso urces or private funds . The elements are conn ected to each other and they generate an output. namely basic and appli ed researc h. which is essenti al for increasing wealth of nati ons. Resea rch institutes are considered as feedback sys tems. since th ey are influenced by past beha viour I., . Inputs are the reso urces of the system, whi ch generate cogniti ve process. Sci entifi c manpower. fund and research equipment that are avai labl e are genera lIy the inputs of a particu lar research in stitute. The produ ction process of a research in stitute tran sform s the input into output through the rea li sati on of resea rch projec ts. techn olog ical services, etc .. Outputs of research in stitutes include the publicati on of papers. patents. projects co mpl eted . contra ct and consultancy se rvices and tec hn ologies developed. A pri vate organi sation prov ides exc lusionary profit ma xi mi sing goods and services. whereas a publ ic resea rch in stitut e tends to produce in fo rmati on and innova ti ons on a non-exc lusionary basis. whi ch ma y. in turn. be co mmerc iali sed by other agents. In public research in stitutes. publication s in sc ienti fic journ als and pa tents may be a more desirab le outp ut. Diagramaticall y, the co mpl ete sce nario can be represe nted, as show n in Figure 1. If we co nsider the research in stilUte as a system wi th its in put, prod uct ion process (o f sc ientifi c
I
OF PUBLIC RESEA RCH INSTIT TES
ac tivity), and output, th is can be expressed In the followin g form:
55 r ;
= f (pJ e),
where 5sr; = System of research in stitutes. p = Scientific personnel../= Funds. e = Resea rch equipment Research Study Objective
The prese nt stud y aims to deve lop a methodo logy for co mparin g performance of di ffere nt resea rch institutes in India . For facilit at ing compari son of performance of different resea rch in stitutes the prese nt stud y aims at ca lculating producti vit y va lues of different in stitutes and ass ignin g ranks to d ifferent in stitutes, based on their producti vit y va lues . The performan ce co mpari son is done by utili sing rank s g iven to different in stitu tes ba sed on their producti vit y va lues . Resea rch in stitu te whi ch gets top rank is the best performin g in stitu te of the lot, foll owed by the one with the nex t highest rank , etc. Methodologv
Productiv it y of an organi sat ion is de fin ed as rati o of outpu t to input. T hi s definiti on was co nsidered in the stud y for calc ulatin g producti vity values fo r di ffere nt research in s til'Jte s~ .
o
Producti vity of a research in stitute = P = - , I
A public resea rch in stitute rece ives fund s from its parent bod y. It ma y al so receive fund s from oth er age nci es, such as Government Departments and
OUTPUTS
......
RESEARCH INSTITUTE
Fi gure 1-
.. . ( 1)
where 0= Output and I = Input.
INPUTS Scientific manpower F unds Equipment
941
.....
Resea rch Inslilule as a syslem
Papers Patents Projects Completed Technologies Developed ConSUl tancy and Contract
942
J SC I IND RES VOL 6 1 NOVEM BER 2002
Industry (both public and private) . In this study, fund s and sc ienti fi c personn el arc taken as inputs. Indicators, such as publicati ons, patents, and tec hn ologies developed are taken as outputs5 . The ya rd sti cks empl oyed in eva luating productivity in industri al firm s cann ot be used for public research institutes. Man y ac ti vities that these in sti tutes are mandated to und ertake are not amenable to meas urement by market metric. Even in case, where the in stitute has deve loped a new product, it is difficult to ca lcul ate res ultant benefits. For so me innovati ons it may be poss ible to es timate bene fits by using cos t benefit approac h, but ge nerall y it is very difficult. If all innovati ons made are li censed and sold in the market , then market value of the transactions ca n pro ide economi c va lue of the output. However, for many in stitutes the practice has bee n not to enter into market transac ti ons. Where they have entered into market transacti ons. these have represe nted onl y a small part of their output. Sci ence, innova ti on and tec hnology arc most ly abst ract concepts that cannot be meas ured directly and so indicators are being used JI1 a I ann er so as to re fl ec t the pattern of productivity. In the case of industri al firms, all outputs and inputs ca n be ex pressed in economic terms and productivity ca n be calcu lated by dividing output with input. But in a public research in stitute. express ing all output va ri ab les and in put va ri ables in eco nomic terms, is not poss ible. Kri shna 6 has used multivariate stati sti ca l models to solve this kind of problem and applied successfull y in ranking Indian coa ls. Based on thi s approach , Rama Mo han et at' have suggested a methodo logy fo r ca lculatin g productivity of publi c research in st itutes. Mu lti va ri ate stat isti ca l model, li ke Principal Co mponent Ana lys is (PCA). is used ge nerally fo r data reduction. Thi s tec hnique ca n be used to reduce the ove rall large set of va ri ab les to a relat ive ly small set of new var iables, without loosing much of the information of the origi nal data set. As per thi s model, one ca n prese nt all informati on present in all output indicators in a si ngle output indi cator without loos ing much of it. Simil arl y, one can use thi s model to fi nd out a single input indicator that represents all in puts. Thcn productivity of eac h institute ca n be ca lculated by dividing output indicator with input indi cator. F in all y, performance of the institutes ca n be judged by assig nin g ranks based on productivity
va lues. These mode ls have a solid mathemat ica l foundation and hence give better res ul ts. A further ex tension of the Principal Compo nent Analysis consists of arri ving at Principal Co mponen ts scores, which are obtained by sta rti ng with the Principal Components and app lying th e percentage var iation ex plained by eac h Principal Component as the we ights. The methodology of Principal Co mponent Analys is is ex pl ained subseq uentl y. Suppose 'X' is the (nxp) matri x of obse rvat ions co nsistin g of ' J/ ' inputs/o utputs, eac h input/output hav ing 'p' obse rva ti ons. Then eva luat ion of Principal Co mponents consists of dete rmi ning th e e igen va lues and e igen vectors of th e Cova rian ce of Matrix ·X'. The eigen vectors will beco me the Principal Components and eige n va lues give the we ightages a~ we ll as the percentage variation exp lai ned by eacl Principal Co mpone nt. Eve n though theoretically. it is poss ible to ex trac t as many Principal Co mponents as the ori ginal number of va ri ables. ge nerall y. on ly the first few Principal Co mponents co uld exp lain maximum va ri at ion (a lmost 99 per ce nt) of the ori ginal data. It is enough if they are retain ed. For a detai led di sc uss ion on Principal Co mponent Analysis. one ca n refer to any sta nd ard book on multi variate stati stics 7-'). F inal scores, obtained from Principal Component Analys is model ca n be used for further analysis. Methodology proposed summari zed as fo ll ows:
In
th is
stud y
IS
Identi ficat ion of inputs and outpu ts 2
Collecti on of input and output da ta for resea rch in sti tutes durin g a certain ti me period.
3
Fo rmat ion of matrix ' X' fo r outpu ts. whi ch is the (nxp) mat ri x observations co nsistin g of 'J/' outputs, eac h output ha ving 'po obse rvations.
4
Determinati on of eigen va lues and c ige n vectors of covariance of matrix 'X '.
5
Determination of Principal Compone nts, which are not hin g but eigen vectors.
6
Determination of weig htage fac tors wh ich are eige n va lues.
7
Ca lcul at ion of scores due to two compone nts.
8
Ca lcul at ion of Principal Component Outp ut Indicator score for eac h resea rch in stitute uSlIlg the formula :
--
KRISH NA
el
q Plh
= L: fJ/
Wpj,
... (2)
k=I ,2, .. .n,
j= I
•
Funds from Indi an industry, and
•
Funds from overseas industry.
Outputs co nsidered in the stud y were:
where components 9
943
al. PERFORMAN CE EVALUATION OF PU BLIC RESEA RC H I NSTITUT ES
p J,fh, .. . .fJq
are
the
first
principal
Si mil arl y, calculate Principal Co mponent Input Indicator score for all resea rch institutes.
10 Calculate prod ucti vity of eac h research in stitute by di viding output score wit h input score. II Ass ign ranks for the in stit utes based on the ir producti vity va lues . Institute wi th hi ghest producti vity va lue gets Rank I. In stitute with hi ghest rank is the best performin g institute of the lot, fo ll owed by the In stitute with the next hi ghest sco re, etc.
Results and Discussion Data
With the liberali sa ti on of the Indi an Economy in 199 1, research in stitutes in Indi a were also faced wit h a cha ll enge to beco me more performance ori ented while the performance targets set were for th e organi sation as a who le, eac h laboratory was to contribute its share co mmensurate to its core competence and ex tern al opportu nities. Thus, every laboratory has to perform we l1 10 Eight Indi an resea rch in stitutes work ing in the sa me area, were considered in thi s study and to mai ntain anonymi ty, the research institutes are designated as RI A, RI 8 , RI C RI D, RI E, RI F, RI G, and RI H.
•
Tec hnologies developed,
•
Publicati ons,
•
Ind ian patents, and
•
Foreign patents.
The data rega rdin g the inputs and outputs are co ll ected for eac h in stitute during the peri od 1997200 1 and presented in Tabl e I. Outputs
Principal Co mponent Ana lys is mode l res ults fo r the output var iab les are given in Table 2. Principal Co mponent Ana lysis model has extracted two principal co mpon ents. The first co mponent ex plaining 82.764 per cent of the va ri at ion and the second component ex plaining 16.307 per ce nt of the var iati on, thereby both the principal components could ex plain nearl y 99 .07 per ce nt va ri ation of original data, whi ch is very good data reduction. Column I gives the variab le names, co lumn s 2 and 3 give the Principal Component coefficients I and 2. Thus the first two principal components are given by: 0.710 technologies developed + 0.980 papers + 0.928 Indian patents + 0.992 Foreign patents ... (3) 0.703 techn ologies developed - O. 178 papers 0.356 Indi an patents + 6.034E-03 Fore ign patents .. .(4)
Inputs considered in the stud y were: •
Grant from parent body,
•
Scientific manpower,
Later, in order to arrIve at a Ana lys is score, both Component
Principal principal
Tabl e 1- Input and output ind icators for di ffe rent institut es during th e period 1997-200 I Inputs Gran t from parent hody (Rs in crores)
RI A
53. I
Outputs Scien tific personnel from Indian indu stry (Rs in crare s) 150
RIB RI C RID RI E RI F RIG RIH
75 .4 52. 4 36.0 97 .9 55.4 106.9 46.8
220 125 11 6 225 485 340 105
Public rese arch institut e
Funds from Forei gn indu stry (Rs in cro res) 12.6 26.9 27.5 9.3 27.5 23. 1 41. 6 8.3
Funds deve loped
Technologies
Publi cations
Indian patent s
Foreign patents
1. 0
18
97
33
6
22 18 55 26 25 4
14 273 11 4 8 10 62 1234 172
II
1.7 0.9 10.5 0.6 36.3 0.6
5 20 5 125 16 14 1
47 14 127
35 295 42
:l
944
J SCI I D RES VOL 6 1
Tabl e 2- Pri ncipal com ponenl analys i s model resulls for OUlpUlS OUlpUl S
Componen l I
Componelll 2
Percentage varialion explained
Technologi es De ve loped Puhl ical ions
0.7 10 0.980
0.703 -0. 178
Indian palenls
0.92
-0.356
Foreign palenl s
0.991
6.034E-03
Percenlage va ri alion explai ned
82764
16.307
9907 1
components I and 2 are considered and utili sin ba the percent va ri ati on ex plained by eac h principal component as we ightages. scores are ca lculated for eac h institute and the res ults are presented in Tabl e 3. The seco nd and third col umn s in Table 3 give the sco res due to the component I and component 2. res pec ti ve ly, ie, using ex press ions 3 and 4. Then scores for all the in stitutes ca ll ed Indi cator scores are ca lcul ated. using Eq. (2) and arc given in column 4 of Table 3. It is important to note that these scores contain the in format ion of all output indicators and a stud y of these scores is equi va lent to th e stud y of all outputs simul taneously. II/pllts
In a simila r mann er. Principal Co mponent Analys is model was appli ed to redu ce the input variabl e into a single var iab le. Res ults obtained are prese nted in Table 4 and Table 5. [n the case of inputs, Principal Co mponent Analysi s model has ex tracted two Principal co mponents whi ch co ul d explain nea rl y 90.435 per ce nt. First two principal co mponents are given by : 0.922 Grant from parent body + 0.635 Scientific manpowe r +0.936 Fund s from Indian Industry + 0.874 Funds from foreign industry. ... (5) -0.2 17 Grant from parent body + 0.786 Scienti fic manpowe r -2.38E-02F und s from Indi an Indu stry 0.302 F nds from foreign industry. . .. (6) In order to arri ve al a Principal Component Analys is scores, both principal components I and 2 are considered and uti Iising the per cent va riati on. ex plained by eac h principal co mponenl as
OVEMBER 2002
T ahle 3-
Principal eomponenl scores for OUlpuls for di fferen l instilLIles
Research inslilule
Score I
Score 2
Ind icalor sc ore
RIA
144.4 16
- 16.324
116.8625
RI B
29.5 98
-5.670
23:17 11 0 278.7620
RIC
346.6 16
-49 .740
RID
142.452
- 12.592
11 58456
RIE
1074.706
- 149.977
8650 129
RI F
127.572
-5. 1220
104.7484
RIG
1640.702
-3 06.25 I
1307.970
RIH
2 13.352
-42.7:18
169 .6094
Tahle 4 -
Principal componenl an;Jlysis model res ul ls for inpul indi cal ors
Inpul
Gran l from parenl hody
Compone nl I Componenl 2 Percenlage v;Jrialion ex pl;Jined 0.922
-0.2 17
Sc ien li fic manpolVer
063:1
0.7 66
found s from Indi an ind uslry
0.936
-2.38E-02
Funds from foreign induSlry
0.874
-0.302
Percentage var ialion ex plained
72.307
18. 12
90.435
Tahle 5- Principal com ponenl scores for in pul s for differenl inslilules Research illslilUle
Score I
Score 2
Indi ca lor sco re
RIA
156.8758
101.7:1:14
132063
RIB
234 .3972
15 I.:'i 18
196.952 8
RI C
154.9 136
83.21 13
1270979
RID
11 6.3434
80.5508
98.7267
RI E
2680558
147.2802
220.5221
RI F
38 1. 1998
3:18 7572
340.6696
RIG
385. 1256
225 .29
3 19.3 133
RIH
11 8. 11 78
69 .8956
98. 078 12
we ightages, scores are calculated for eac h in stitute and the res ults are presented in Tabl e 5. The second and third column s in Table 5 give the scores due to the componenl I and co mponent 2. i.e., using Eq (~ and 6). Then sco res for all the inst itutes are calc ul ated using Eq. (2) and are given in column 4 of Tabl e 5.
KRI SHNA ('I of.
945
PERFO RM ANCE EVA L UATION OF PU BLIC RESEA RCH I ST ITU TES
It is important to note that these scores contain the informati on of all input indicators and a stud y of these scores is equi va lent to the stud y of all inputs simultaneously.
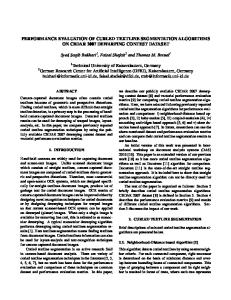
fo llowed by institute RI E, institute RI C, and institute RI H, etc. Institute RI B co mes in the last pl ace. To have a clear view, these ranks are depicted in a bar diagram, as shown in Figure 2.
Calculation of Produ cti vity
Validation of Model
In ord er to calcul ate producti vit y of eac h institute. outp ut sco res are di vided by input sco res . Res ults obtained are prese nted in Table 6. Column 2 of Ta ble 6 co ntain s Output Indi cator scores and Column 3 gives input indi cat or scores . Third column contains producti vity values obtained by di viding output score with input scores. In the last colu mn of Table 6, perfo rmance rank s are awa rded on th e bas is of producti vity va lues.
Ex pert s ranking about performance of all the laboratori es are obtained through interviews wit h ex perts. To va lidate our model, rankin g obtained wi th PCA model is compared with the rankin g given by ex perts and also by ca lcul atin g the rank correlati on coefficient betwee n the two rankin gs . Res ults obtained are presented in Ta ble 7. In Tabl e 7. the first col umn gives the resea rch In stitute's name, co lumn 2 gives the rank s obtained by PCA mode ls, whereas column 3 gives the ranks obtained from the ex perts, while eva luatin g the perfo rmance of these resea rch insti tutes. A close inspecti on of these two column s c lea rl y indicates that the ranks obtained from PCA mode l are ve ry mu ch similar to those obtained by the ex perts. Thu s, e.g .. In stitute RI G is identifi ed as the bes t by both . Simil arl y, In stitute RT B is
Institute hav ing hi ghest productivity va lue is considered as top perfo rmin g laboratory and ass igned rank I. T he In stitute. whose score is second hi ghest, is given rank 2, the third hi ghest rank 3, etc .. In stitute wit h lowest producti vity va lue is leas t perfo rmin g lab. out of all . Ev ide ntl y in our stud y. institute RI G is perfo rmin g ex tremely good among all the institutes .
9 8
[-----
-~----.---
7
6 en
~
e
5
l --,------.-----~
I-
co 4
0::
3 2 1
0 1
Research institutes Figure 2 -
Rank s obtained with PCA
DRIA RIB D RIC D RID .RIE D RIF RIG DR IH
946
J SCI IN D RES VOL 6 1 NOVEM BE R 2002
Tah le 6 -
Producti vi ty of different instilUtc s and th eir performan ce ranking
Output (0 )
Input (I)
Producti vi ty
Performance P = 011 ranks
RI A
11 6.8625
132063
0.8849
6
RI B
23.57 11
196.9528
0. 1197
8
Rese arch institute
RI C
278.762
1270979
2. 1933
3
RID
11 5.8456
98.7267
1.1 734
5
RIE
865 0129
220.522 1
3 9225
2
RI F
104.7484
340.6696
0. 3075
7
RIG
1307.97
3 19.3 133
4096 1
RIH
169.6094
98 .078 12
1.7293
Tah le 7-- Co mpari son o f prin ci pal com ponent analysis mode l ranking with ex perts ranking Re search insti tute
Principal compo ncnt anal ys is performance ranks
Expert s rank s
RIA
6
7
RIB
8
8
RI C
3
3
RID
5
5
RI E
2
2
RI F
7
6
4
4
RIG RIH
Rank correlation coc lTi eient: 0.929 (p Icss than 0.0 1)
ide ntifi ed as the least pe rformin g institute by both. Even among o ther ranks , up to ra nk 5, both the approaches have identified the ranks as sa me, ie, RI 0-1 , R f E-2, RI C-3, RI H-4 , RI D-5 . Only w ith rega rd to the ranks 6,7, both the approac hes have sli g htl y differed . The PCA ap proac h has g ive n research in stitutes Rf A rank 6 and resea rc h in stitute RI Frank 7; whereas e xperts rank s are just the reverse. This is unde rstandabl e beca use the PCA model is based o n mathe mati ca l approac h, whereas the experts opinion is based on the ir experi e nce. Again , both approac hes have given least rank , ie, rank 8 to the research in stitute RI B . Also, in o rde r to va lidate the ranks obta in ed by the PCA a pproac h with those obtai ned from experts, ra nk correlation coeffic ie nt is calc ul ated. A rank corre latio n coeffic ie nt 0.929 ( p less than 0.0 I) is o btained impl yin g that ranks obtai ned by o ur mode l almost simil ar to rank s g iven by ex pe rts.
4
Conclusions Methodology is s ugges ted to compare performance of diffe re nt research in stit utes based o n their producti vity values. Principal Co mponen t Analys is mode l is proposed to calculate productivity for diffe rent in stitutes. Performance rank s were assigned to different la bo ratories o n the basi s of their producti vi ty va lues. Resea rc h In stitu te wi th hi g hes t produc tivity va lue is considered as the top pe rforming in stitute. Ranks o bta ined w ith the mode l a re compared w ith ranks give n by ex pe rts by stati st ica l rank correlation. A hi g h ra nk corre lation coefficient s uggests that ranks o bta in ed by o ur model are s imil ar to ranks give n by ex pe rt s. Methodol ogy s ugges ted in thi s study is of gene ral nature and ca n eas il y used for co mparing perfo rmance of a ny set of resea rc h in stitutes . Also, any numbe r of indi cato rs ca n be considered in the st ud y.
Acknowledgements D Kri shna, S R a ma Mohan an d B S N Murthy are g rateful to Dr K V Rag hava n, Director, n CT fo r his e nco uragemen t a nd g ivin g permi ssion to publish thi s pape r. One o f the authors S Rama Mo han a lso wo uld like to tha nk Dr L N Kota , De puty Director, n CT for hi s e ncourage me nt in ca rrying out thi s st ud y.
References Coccia M . A basie model for evaluatin g R&D performance: thcory and applications in Italy. R&D Manage. 31 (4) (200 1) 453 2
3
Rama Mohan S & Ramakri shna Rao A, To improve relations between public research institutes ( PR ls) and industry; Industry's pcrspect i vcs . .1 Sci {li d Res. 60 (200 I ) 929. Brown M G & Svenso n R A. Measuring R& D producti vit y.
Res Tech Mallage. 31 (4) ( 1988) II. 4
Mundcl. Measuring productivi ty. {lid 1::lIg .!. III ( 1976) 50.
KRISHNA et 01.: PERFO RMANCE EVALUATION OF PUB LI C RESEARC H INSTIT UTES
5
6
7
Rama Mohan S, Kri shna D & Ramakri shna Rao A. Assessment o f R&D producti vit y for public research institutes in Indi a by appli cation o f statistical models - a case stud y. R&D Mallage (communicated). Kri shna D.A comprehe nsive coal index by factor analys is for ranking Indian coal s. Chelllolll etriC'S Ill tell Lab Syst. 22 ( 1994) 273. Anderson T W. ;\11 illtmdl/ctioll 10 1I11/itil'ariate statistical all alvsis (Wil ey Eastern Pvt Ltd. New Delhi) 1998.
947
8
Morri son. MlIlti variate statistical II/ eth ods (McG raw Hill Intern ati onal Book Co., New York ) 1978.
9
Kendall M. MlIlt ivariate analrsis (Charl es Gri ffith Co Ltd. London) 1980.
10
Gupta A K, Bhojwani H R. Koshal R & Koshal I-I. Managing the process o f market orientati on by publi cly funded labs: Case of CS IR. Ind ia. R&D Mallage. 30 (4) (2000) 289.