Home
Search
Collections
Journals
About
Contact us
My IOPscience
Giant and uniform fluorescence enhancement over large areas using plasmonic nanodots in 3D resonant cavity nanoantenna by nanoimprinting
This article has been downloaded from IOPscience. Please scroll down to see the full text article. 2012 Nanotechnology 23 225301 (http://iopscience.iop.org/0957-4484/23/22/225301) View the table of contents for this issue, or go to the journal homepage for more
Download details: IP Address: 128.112.70.64 The article was downloaded on 14/05/2012 at 03:20
Please note that terms and conditions apply.
IOP PUBLISHING
NANOTECHNOLOGY
Nanotechnology 23 (2012) 225301 (9pp)
doi:10.1088/0957-4484/23/22/225301
Giant and uniform fluorescence enhancement over large areas using plasmonic nanodots in 3D resonant cavity nanoantenna by nanoimprinting Weihua Zhang, Fei Ding, Wen-Di Li, Yuxuan Wang, Jonathan Hu and Stephen Y Chou NanoStructure Laboratory, Department of Electrical Engineering, Princeton University, Princeton, NJ 08544, USA E-mail:
[email protected]
Received 17 January 2012, in final form 11 April 2012 Published 10 May 2012 Online at stacks.iop.org/Nano/23/225301 Abstract Using a new nanoplasmonic architecture and an optimized spacer, we observed the following: (a) the average fluorescence of an infrared dye (indocyanine green) is enhanced by 2970 fold uniformly (variation < 11%) over a large sample area and over a wide range of dye concentrations (380 to 380 000 molecule µm−2 ), laser excitation powers and laser beam sizes; and (b) for a single molecule placed at a ‘hot spot’, the fluorescence enhancement is 4.5 × 10⁶ fold. The giant and uniform enhancements (orders of magnitude higher than before), plus easy and inexpensive large area fabrication (>400 wafers), should open up wide applications. (Some figures may appear in colour only in the online journal)
1. Introduction
current nanoantenna often has only one hot spot, limiting the improvement in enhancement. Previously, the best observed surface-enhanced fluorescence had an enhancement factor (EF) of about 10–200 for an area-average [9, 10, 14, 15, 18–23] and ∼1300 for a single molecule that was placed right at a ‘hot spot’—a spot where the local electric field is highly enhanced [17]. Moreover, many previous SEF substrates have a few hot spots which are often randomly distributed, causing fluorescence enhancement to have a poor uniformity. Recently we proposed and demonstrated a new plasmonic architecture, termed a ‘disk-coupled dots-on-pillar antenna array’ (D2PA), which puts dense plasmonic nanodots inside dense 3D resonant cavity nanoantennas, and couples the metallic components through nanogaps [24]. The D2PA has demonstrated significant improvements over previous work in both enhancement and large area uniformity in surface-enhanced Raman scattering (SERS) [24]. However, a high SERS enhancement does not mean a high fluorescence enhancement. In fact, it has been shown both experimentally [5, 14] and theoretically [7, 18] that a plasmonic structure can have high SERS enhancement but not SEF.
Fluorescence has broad and significant applications in science, engineering and medicine, such as biological/chemical/medical imaging and sensing, light emitting devices, energy harvesting (e.g. solar cells) and communications, to name a few [1–4]. Metallic nanostructures can enhance fluorescence through surface plasmons excited by incoming light, E0 . The plasmons increase the local electric field Eloc (which in turn enhances the fluorophore’s excitation rate by |Eloc /E0 |2 ) and can also improve the quantum efficiency of a fluorophore [5–7]. Various metallic nanostructures have been used for surface-enhanced fluorescence (SEF). Initially rough metal surfaces, metallic nanoparticles, nanoapertures and nanogaps were used for SEF [7–13]. Recently, it was recognized that metallic nanostructures of subwavelength size are often poor in enhancing excitation light and in re-radiating fluorescence, and therefore nanoantennas, such as bowties (an optical analog of conventional antennas) were used to improve the light collection and radiation for enhancing fluorescence [14–17]. However, each 0957-4484/12/225301+09$33.00
1
c 2012 IOP Publishing Ltd Printed in the UK & the USA
Nanotechnology 23 (2012) 225301
W Zhang et al
SERS is a process through virtual quantum states, which goes as the fourth power of E-field enhancement and hence has no quenching effect, but SEF is a process through a real quantum state, which depends on the second power of E-field enhancement (from excitation), as well as the emission efficiency. Plasmons in metal can interact with the intermediate real quantum states to cause a non-radiative transition to a low energy level, leading to quenching of the fluorescence. Hence the fluorescence efficiency may not always be enhanced by metal. To reduce the quenching, a spacer that separates the fluorophore from the metal is needed, but it also reduces the E-field enhancement at the same time. Therefore to understand SEF and explore applications, an experimental proof of high SEF in a particular plasmonics design and the optimization of the spacer are extremely important and must be thoroughly investigated. In this report, we present the study of fluorescence enhancement of dyes using the new D2PAs and an optimization of the spacer; and report the observation of significant fluorescence enhancements for both area-average and a single molecule at a ‘hot spot’, which are orders of magnitude better than previously reports, and with excellent uniformity over a large area.
Figure 1. Plasmonic structure: a disk-coupled dots-on-pillar antenna array (D2PA) consisting of 3D resonant cavity nanoantennas coupled with plasmonic nanodots through nanogaps. (a) Scanning electron micrograph of the top view of a D2PA of 200 nm period. (b) Cross-sectional image showing the nanodots (∼5–20 nm, 10–50 dots per pillar), nanogap (∼1–10 nm), SiO2 , pillar (65 nm height, 100 nm diameter), metal disk (135 nm diameter) and metal backplane (55 nm thick). (Note: part of the pillar together with the nanodots on it was cut away in preparing the cross-section, hence it shows no nanodots.) (c) Schematic of D2PA cross-section and charge coupling. (d) Schematic of laser beam scanning (for ‘probe areas’) and step-and-repeat of the probe area for fluorescence measurement.
2. Experiments The D2PA has a pillar array (dielectrics or semiconductors) with a metal disk on top of the pillars, a metal backplane on the foot of the pillars, metallic nanodots on the pillar wall, and nanogaps between the metal components (figure 1) [24]. The 3D cavity antennas (formed by the periodic disk array and the backplane) trap light from the laser and pass it to the inside nanodots (∼5–20 nm diameter) through the nanogaps (1–10 nm), hence significantly boosting the local electric field intensity. Moreover, the cavities can also enhance the efficiency of fluorescence emission. By using a high density of pillars (e.g. 2.5 × 10⁹ pillars cm−2 − 200 nm pitch) and a high density of dots/gaps per pillar (about 10–50, depending upon the pillar geometry), we have made the plasmonic enhancement of D2PA not only high but also less sensitive to geometric variation, and hence excellently uniform over a large area. The D2PA substrates were fabricated on a 400 wafer by nanoimprinting [25–27], self-alignment, and selfassembly [24]. In brief, SiO2 nanopillars were first patterned by nanoimprinting and reaction ion etching, followed by a single Au evaporation from a normal incident angle with respect to the wafer surface, which simultaneously deposits Au nanodisks on top of the pillars, a backplane on the pillar foot, and Au nanodots on the pillar sidewall. Then a thin layer of silicon dioxide was conformably coated on the D2PA using plasma-enhanced chemical vapor deposition (PECVD) to avoid the fluorescence quenching effect. For a high fluorescence enhancement factor at 785 nm laser excitation, we optimized various D2PA parameters, such as the SiO2 pillar height, the pillar and disk diameter, and the distance between the disk and the backplane. The final optimized D2PA samples have SiO2 pillars of 200 nm pitch,
100 nm diameter and 65 nm height on a SiO2 (135 nm thick on Si) substrate, the Au disks and backplane are 55 nm thick, the nanodots have a diameter of 5–20 nm, the nanogaps range from 1 to 10 nm, and there are 10–50 nanodots/nanogaps per pillar. Other details of the D2PA structure and fabrication are published elsewhere [24]. We tested two infrared (IR) molecular dyes, indocyanine green (ICG) (Sigma-Aldrich) and IR800 (dimethyl {4-[1,5,5-Tris(4-dimethylaminophenyl)-2,4-pentadienylidene]2, 5-cyclohexadien-1-ylidene} ammonium perchlorate) (Sigma-Aldrich), both of which are widely used in medical, biological and chemical imaging and sensing techniques. In particular, ICG, long since approved for use in humans by the US Food and Drug Administration (FDA), has been used in a broad spectrum of medical and clinical applications for many years, including retinal angiography [28, 29] burn depth measurement [30], optical tomography [31], optical tumor detection [32], and many others. The dyes, diluted in ethanol to different concentrations, were dropped on millimeter-sized samples (typically 4 mm × 4 mm) using a precision pipette [a ±5% accuracy (50 nl) at 1 µl] to control the solution volume. Due to their hydrophilic surfaces, the droplets immediately spread out on the D2PA substrate and the reference substrate and were dried in air. Gentle nitrogen blowing was used to facilitate the evening out of liquid film thickness, but it did not blow away any liquid due to the low pressure used. This 2
Nanotechnology 23 (2012) 225301
W Zhang et al
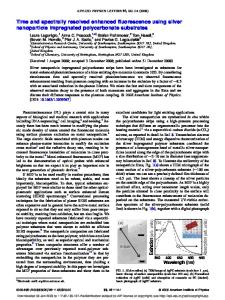
Figure 2. (a) Reflection spectrum of an optimized D2PA substrate, which shows strong resonant absorption at the excitation wavelength (785 nm). (b) Fluorescence enhancement of IR800 as a function of the thickness of the SiO2 spacing layer. (c) Fluorescence intensity of IR800 on D2PA (solid black line) and the reference (dashed black line), and the corresponding enhancement factor as function of wavelength (red line).
65 nm and a diameter of 100 nm, showing a strong resonance absorption at 785 nm, which perfectly matches the wavelength of the excitation laser (figure 2(a)). This optimization process is independent of the dye molecule since the resonance wavelength is mainly decided by the D2PA structure self. To avoid the quenching effect, a thin layer of SiO2 was deposited on D2PA substrates as the spacer between the fluorophore and the metal. We tested the fluorescence versus the SiO2 spacer thickness using the IR800 dye, and located the optimum thickness at 5 nm, figure 2(b). Figure 2(c) shows that the fluorescence signal was enhanced by ∼600 fold with the optimized spacer, and the wavelength dependence of the fluorescence enhancement spectrum matches the plasmonic resonance spectrum of the D2PA. Without a spacer, the fluorescence intensity is 12 times smaller than that at the optimum spacer thickness due to the quenching effect. When the spacer thickness increases beyond the optimum value, the fluorescence first decreases and then flattens out as the spacer thickness is larger than 30 nm. This is because the electric field enhancement is a near field effect, and the field enhancement drops rapidly when moving away from the surface of the nanoantennas.
process enables us to accurately control the total number of molecules deposited on the substrate surface. The excellent concentration uniformity over the samples prepared in this way has been confirmed by our fluorescence signal mapping at every point of the entire sample, as discussed later. It is also confirmed by our SERS mapping measurement of trans-1,2-bis(4-pyridyl)ethylene [24]. Another important experimental procedure is that all D2PAs and reference samples were cut to the same size and were prepared with chemicals in the same way. In this way, even where there were slight liquid losses (which we do not believe happened here), the enhancement factor, which is a ratio of the signals from the D2PA to the reference, should remain unchanged. This fact is confirmed by the observed linear dependence of fluorescence on the dye concentration. The D2PAs were fabricated in a wafer size of 400 and then diced into pieces for experimentation. Two types of reference sample were used: plain glass slides and Si substrates with a 30 nm SiO2 layer on the top surface; both gave identical fluorescence intensity under identical testing conditions, except the Si substrate has a sharp Raman peak. To ensure the accuracy of the measurements, in addition to the special care used in preparing all samples (including references) as mentioned above, the fluorescence signals were measured by mapping the entire sample over a wide range of dye concentrations and laser power densities, multiple samples were used, and repeated experiments were carried out. The different excitation powers were achieved using different optical attenuators while keeping the laser power and the rest of the optical measurement system unchanged.
4. Large and uniform fluorescence enhancement of ICG over a large area on D2PA It is known that the fluorescence enhancement by plasmonic structures is related to the intrinsic quantum efficiency (QE) of a dye: stronger enhancement for a lower QE [3]. At a low QE the fluorescence enhancement is inversely proportional to the QE. To test this fact in D2PA, we investigated the surface-enhanced fluorescence of ICG, which is currently the only near-IR dye approved by the US FDA for human use. The QE is 1.2% for ICG, about 5 times less than the 7% for IR800, leading us to expect the average fluorescence enhancement of ICG on D2PA to be ∼3000 fold, as confirmed by our experiments described below. The area-average enhancements of the fluorescence in our work were measured using a laser scanning confocal spectrometer (ARAMIS, HORIBA Jobin Yvon) with a 785 nm laser excitation. The spectrometer can scan the laser probe over an area by rapidly raster scanning the laser beam using a scanning galvo mirror system (which is termed ‘probe
3. Plasmon spectrum of a D2PA and spacer thickness optimization We tested the D2PA resonant spectra and optimized the structures for the 785 nm excitation laser by changing the height and diameter of the SiO2 pillars [24]. For a given pitch size, the resonance wavelength of the D2PA substrate is strongly dependent on the height of the pillar and the size of Au disk. In brief, the lower the pillar height is, the longer the resonance wavelength will be; the smaller the Au disk size is, the shorter the resonance wavelength will be [24]. The final optimized structures have SiO2 pillars with a height of 3
Nanotechnology 23 (2012) 225301
W Zhang et al
Table 1. Comparison of the current work with the best previously reported experimentally measured fluorescence enhancement factor for an area-average EF and for a single molecule placed at a hot spot (gHot.Spot ) of different dyes. Intrinsic quantum efficiency, η (%)
Excitation/emission center wavelength (nm)
Structure
Dye
Area-average EF
Single mol. EF at ‘hot spot’ (g Hot.Spot)
D2PA Nanoantenna array (avg.) [15] Nanoshell (avg.) [22]
ICG Rh800
2970 70
4.5 × 10⁶ NA
1.2 3
785/∼850 633/∼700
ICG attached to HSA Basic Fuchsin TPQDI
50
NA
1.2
785/850
200 NA
NA 1340
1–2 2.5
514.5/575 780/830
Silver islands (avg.) [8] Bowtie antenna (single ‘hot spot’) [17]
area’), and also can step-and-repeat the laser probe area using a x–y sample scanning stage to cover an area up to 20 mm × 20 mm, as shown in figure 1(d). Therefore, the spectrometer can map out each point of the sample under test. The pixel size in the mapping ranges from 2 to 100 µm, depending on the diameter of the laser beam and the optics. In particular, we used a 10× objective [numerical aperture (NA) = 0.25], 15 µW laser powers for D2PA samples and 15 mW for reference samples (to compensate their different fluorescence intensities), 100 µm × 100 µm probe area, and a 200 ms light excitation time for each probe area. The area-average fluorescence enhancement factor (λ) IExc.Ref nRef ARef is calculated by EF(λ) = IIFluo.SEF , where Fluo.Ref (λ) IExc.SEF nSEF ASEF IExc.SEF and IExc.Ref is the excitation intensity, IFluo.SEF and IFluo.Ref is the measured total fluorescence signal intensity over the entire sample area, nSEF and nRef is the number of molecules per unit area, and ASEF and ARef is the area size, for D2PA substrates and reference substrates respectively. To get an accurate area-average fluorescence enhancement, we scanned the entire sample area of ∼4 mm × 4 mm (every spot), using the 100 µm × 100 µm probe area and a step-and-repeat distance of 100 µm in both x and y directions (hence 40 × 40 steps). For an ICG concentration of 380 000 molecules µm−2 (dropping 10 µM ICG solution on a ∼4 mm×4 mm sample) on both D2PA and reference samples, our measurements show that the mean of the area-average fluorescence enhancement over the entire sample at 870 nm is 2970 fold higher on the D2PA than the reference samples (figure 3). The statistical analysis of mapping measurements of the fluorescence signal from each point of the entire sample shows that the enhancement has a variation of less than 11% around the mean, i.e. it is extremely uniform everywhere (see later in this section). The observed fluorescence enhancement has a rather broad bandwidth (which is determined by the plasmon resonance spectrum of D2PA), and in the 800–850 nm spectral range [the full width at the half maximum (FWHM) of the fluorescence peak] it weakly depends on the wavelength with a variation of <15%. When averaged over the FWHM spectral range, the mean of the area-average enhancement is 2360 fold. For laser excitation power densities and excitation times using the above measurements, we have not observed either
Figure 3. Area-average fluorescence intensity of ICG on D2PA (solid line) and the reference (glass substrate, dash line, amplified 1000× relative to D2PA), respectively, and the area-average enhancement factor which is 2970 fold at ∼870 nm and 2360 fold when integrated over the FWHM of the fluorescence peak.
saturation or noticeable bleaching. In fact, the fluorescence signals from both D2PA and the reference samples are found to be linear over a wide range of laser power densities and dye concentrations (see section 5), which indicates that there is no saturation and the fluorescence enhancement is constant over these ranges. Moreover, the fluorescence versus time measurement showed that the typical photo bleaching time on D2PA and reference substrates is of the order of 10 s, which is much longer than the exposure time (200 ms) used in our experiment, and therefore the bleaching effect does not influence our results either. The 2970 fold area-average fluorescence enhancement observed in our experiment is over 15 times higher than the previously highest reported value (which used the same dye or a dye with similar QE) [15, 21], and about two times higher than the previous best enhancement for a single molecule placed at a ‘hot spot’ (the strongest enhanced electric field spot) [17]. Detailed comparisons of the current and previous works regarding the dyes used, intrinsic QE, and observed EF are given in table 1. The large enhancement observed 4
Nanotechnology 23 (2012) 225301
W Zhang et al
Figure 4. Mapping of fluorescence intensity and variation of ICG (3.8 × 10⁵ molecules µm−2 ) over 1.5 mm × 1.5 mm area on D2PA. (a)–(c) Map of the intensity deviation (from the mean) of 15 × 15 matrix (total 225 locations) with a 100 µm stepping distance and a laser probe area of 100, 20, and 2 µm. (d)–(g) Fluorescence intensity (hence enhancement) distribution (normalized to the mean) for (a)–(c). (g) Variation (defined as the relative standard deviation assuming Gaussian distribution) of fluorescence enhancement as function of probe area. The variation is less than 11%, nearly independent of the probe area.
here is due to the unique design of the D2AP architecture (as discussed later). To test the uniformity of SEF enhancement, which is a key problem in previous SEF structures and a major obstacle to applications, we mapped the ICG fluorescence on D2PA with different probe area sizes. The mapping sampled a 15 × 15 matrix (total 225 locations) by stepping the probe area with a pre-fixed 100 µm step size in both x and y directions, hence over a 1.5 mm × 1.5 mm sample area. Three different laser probe area sizes were used in the mapping: squares of 2, 20 and 100 µm size (figure 4). (Note using a 100 µm × 100 µm excitation area, the entire 1.5 mm × 1.5 mm area is completely mapped.) We found that regardless of the size of
the probe area, the fluorescence enhancement has an excellent uniformity with a standard deviation between 10% and 11% over the entire sampled area (figure 4). To further visualize the high and uniform fluorescence enhancement by D2PA, we used a 785 nm laser beam over ∼5 mm × 5 mm area to uniformly illuminate both a D2PA and a reference substrate, which have the same IR800 concentration of 1.3×10⁶ molecules µm−2 . The D2PA shows a strong uniform fluorescence emission, while the reference has no fluorescence signal except the background (figure 5). The bright edges at figure 4(a) are caused by the scattering of the excitation beam at the edges of the substrate. 5
Nanotechnology 23 (2012) 225301
W Zhang et al
6. Giant enhancement factor of single molecule fluorescence at ‘hot spots’ Besides the large area-average EF and large area uniformity, we studied the spatial and temporal behaviors of the fluorescence from single molecules deposited on D2PA. At a very low dye concentration, the separation between molecules becomes large and there is a good chance to observe, in some locations, an isolated single molecule in a hot spot. In the single molecule fluorescence measurement, we used an inverted fluorescence microscope (TE300, Nikon), different from previous measurements. A 50 µm×50 µm area of the samples was excited by scanning a 785 nm laser through a 40× objective (NA = 0.6) at a rate of 25 ms per scan cycle (∼0.8 µm beam diameter), and the fluorescence images were collected continuously by an electron multiplying charge-coupled device (EM-CCD; Andor) at a rate of 100 ms per frame (each pixel measures 0.4 µm × 0.4 µm area of the sample). Different laser powers were used for D2PA samples (0.19 mW) and reference samples (11.4 mW). We used three different ICG molecule concentrations of 3.8, 38 and 380 molecule µm−2 (by dropping 1 µl ICG solution of concentration 100 pM, 1 nM or 10 nM, respectively). The corresponding average molecular spacing is ∼510 nm, 160 nm, and 51 nm, respectively (assuming a 2D surface), much larger than the size of the ICG molecule which is approximately 1 nm. Such concentrations also correspond to an average 0.15, 1.5 and 15 molecules per pillar for a D2PA of 200 nm pitch. At these low molecular concentrations we indeed observed that the fluorescence images over a 50 µm × 50 µm area have some bright spots randomly distributed in a uniform fluorescence background (figure 7(a)). The time dependence of the fluorescence intensity at each bright spot has a stepwise behavior—it has a high and constant (within noise) fluorescence signal initially and then suddenly drops to zero (figure 7(b)). This time dependence is a clear signature of a single molecule (fluorescing and then getting bleached) [33], and the high fluorescence brightness (hence high enhancement) at these spots indicates that the molecule is placed at a hot spot. Two methods were used to estimate the fluorescence enhancement of a single molecule placed at a hot spot of the D2PA, gHot.Spot . Both give nearly identical results. In the method 1, gHot.Spot is the ratio of the single molecule fluorescence signal at a ‘hot spot’ of D2PA, SHot.Spot , to the average fluorescence signal per molecule on the reference sample (which equals the area-average fluorescence intensity on the reference sample, IRef.Avg , divided by the average number of IGC molecules per unit area on the reference sample, nRef.Arg ):
Figure 5. Two-dimensional fluorescence image of IR800 on D2PA (a) and reference (b), which have the same IR800 concentration and are illuminated by the same laser intensity.
Figure 6. Fluorescence intensity, I, of ICG as a function of dye concentration on D2PA (a), and power of excitation laser which was expanded into a 100 µm × 100 µm area (b).
5. Constant fluorescence enhancement factor over a wide range of dye concentrations and laser power densities We measured the dependence of the fluorescence signal intensity (ISEF ) over a wide range of dye concentrations (n) and laser powers (IExt ) (figure 6). We found the signal intensity is a linear function of both n and IExt , as n varies from 380 to 380 000 molecule µm−2 (by droplet depositing 1 µL ICG solution of concentration of 10 nM–10 µM on 4 mm × 4 mm samples) and IExt varies from 12 µW to 11 mW (a fixed laser probe scan area of 100 µm × 100 µm, hence the power density from 1.2 nW µm−2 to 1.1 µW µm−2 ). The fluorescence intensity on a reference substrate was also measured as a function of the excitation intensity (varying from 2.5 to 25 mW, and hence a power density from 0.25 to 2.5 µW µm2 , figure 6(b)), and was found to have a linear relation with a slope of one (1/1). Therefore, over the above excitation power (power density) range and concentration range (380–380 000 molecules µm−2 ), no saturation was observed and the measured SEF enhancement factor of D2PA is independent of n and IExt . It should be pointed out that the above excitation power density is orders of magnitude lower than the expected saturation power density, which is estimated to be the inverse of the product of the absorption cross-section σabs and the fluorescence life time τ . Assuming σabs ∼ 10−16 cm−2 and τ ∼ 1 ns for ICG, the saturation power density should be 25 mW µm−2 , which is over four orders of magnitude higher that the power density we used.
gHot.Spot =
SHot.Spot IExc.Ref (IRef.Avg /nRef.Avg )IExc.SEF
where IExc.SEF and IExc.Ref is the excitation intensity for the D2PA and reference substrates, respectively. For SHot.Spot = 30 000 counts, IRef.Avg = 1500 counts µm−2 and nRef.Arg = 3800 molecule µm−2 we found the gHot.Spot is 4.5 × 10⁶ , 6
Nanotechnology 23 (2012) 225301
W Zhang et al
Figure 7. Single molecule fluorescence of ICG on D2PA. (a) Two-dimensional (2D) fluorescence image of a 50 µm × 50 µm area with a ultra-low ICG concentration (380 molecules µm−2 ), showing distinct bright spots (each pixel is 0.4 µm × 0.4 µm). (b) Fluorescence intensity versus time at three different bright spots [the intensity of each bright spot is a sum of 25 pixels around the center, and the average fluorescence background (∼535 counts/ pixel) was removed in plotting (b)]. The stepwise behavior in (b) indicates that the fluorescence from a single molecule. (Insets: 2D fluorescence images of a bright spot before and after the molecule is bleached. The scale bar is 5 µm.) (c) Number of bright spots (in an area of 50 µm × 50 µm) versus ICG concentration.
sample area, which indicates that at an ultra-low molecular concentration, on average one of 104 of the molecules entered the ‘hot spots’ of our current D2PA sample. Compared with the previous reported best fluorescence enhancement for a single molecule at a ‘hot spot’, our observed 4.5 × 10⁶ fluorescence enhancement is over 3000 times higher. More detailed comparisons with the best previously reported results in the near-IR spectral range are summarized in table 1.
which is over 3000 times larger than the best enhancement factor reported previously [17]. In method 2, the average fluorescence signal per molecule for the reference sample is estimated from the average fluorescence signal per molecule measured on D2PA (ISEF.Avg /nSEF.Arg ) divided by the enhancement factor (EF). The division of EF scales the signal from the D2PA substrate to a regular glass substrate. Hence, gHot.Spot =
SHot.Spot (ISEF.Avg /nSEF.Avg )/EF
7. Effects of nanodots on fluorescence enhancement
where ISEF.Avg is the area-average fluorescence intensity on D2PA, and nSEF.Avg is the average number of IGC molecules per unit area on D2PA. Note ISEF.Avg includes all signals from ‘hot’ spots and non-hot areas and was measured on the same D2PA substrate in the same measurement of SHot.Spot (and hence offers the advantage of eliminating the need to use different measurements and scaling of different molecular concentrations). For ISEF.Avg =∼ 6000 counts, and nSEF.Arg = ∼380 molecules µm−2 , and EF = ∼2970, we found gHot.Spot = 5.7 × 10⁶ , consistent with gHot.Spot by method 1. We also measured the average number of bright dots at an ultra-low molecular concentration as a function of the molecular concentration, and found they have a linear relation (figure 7(c)). As an example, at 38 molecules µm2 , we found on average about 10 bright spots in a 50 µm × 50 µm
To illustrate the significance of the plasmonic nanodots and the associated nanogaps in D2PA, we compared the fluorescence images of the D2PA with the same structures but without nanodots on the pillar sidewall (details about sample preparation without nanodots is given in [24]). D2PA clearly has more and much brighter fluorescence spots (i.e. hot spots) and an average signal about eight times stronger (figure 8).
8. Discussion and analysis Fluorescence enhancement by plasmonic structures is a product (multiplying) of several parameters which often have conflicting requirements. Hence regardless of how much enhancement is created by other parameters, one small parameter can kill the total enhancement. A low fluorescence 7
Nanotechnology 23 (2012) 225301
W Zhang et al
number of hot spots per pillar in our experiments. If we assume that the variation is solely due to the variation in hot spot number, and the variation follows a Gaussian distribution (where the variation is the inverse of the square-root of the mean), then to have the 11% measured variation in the 1 µm−2 excitation beam area, we need 82 hot spots (i.e. nanoparticles and associated gaps which are hot), or 3.3 hot spots per pillar. However, since in the real D2PA samples other factors contribute to the variation, the actual variation of the hot spots has to be much less than the 11%, thus making the actual average number of hot spot per pillar larger than 3.3, which is not hard to achieve considering the number of nanodots and nanogaps per pillar in current D2PAs. The large fluorescence enhancement, as well as the role of the nanodots and nanogaps, can be further understood through numerical simulation. Although we cannot model the exact size, shape, number, and locations of either the Au dots on the pillar sidewall or the gaps (between the dots and the disks) to calculate a meaningful theoretical enhancement factor, we can qualitatively model the roles of each component (e.g. Au dot, disk, and backplane) of the D2PA in enhancing the local electric field, by assuming there is only one Au dot on the sidewall. Our simulation of the electric field distribution, using a full 3D finite-different time-domain (FDTD) model (commercial software: Lumerical Solutions, Inc.) with the periodic boundary condition, normal incidence, 1 nm mesh size, and assuming only one Au dot, shows that (a) indeed the D2PA is a 3D cavity antenna that can trap the light, and (b) the electric field induced in the gap between the dot and the disk is much higher than the gap between the nanodisk and the metal backplane (figure 9(b)).
Figure 8. Comparison of the 2D fluorescence image of ICG (380 molecule µm−2 ) on the D2PA of the same structure except (a) with and (b) without Au nanodots on the pillar sidewall. (c) Area-average fluorescence enhancement of (a) and (b), respectively. The D2PA with Au dots on the sidewall clearly has more bright spots and an area-average fluorescence enhancement ∼8 times higher than that without Au dots.
enhancement in previous plasmonic structures is because they cannot simultaneously optimize all relevant parameters. But D2PA can. D2PA enhances: (i) 3D antenna efficiency in trapping the exciting light, (ii) the plasmonic effects of each nanodot and nanogap, (iii) the efficiency of radiating fluorescent light, (iv) the coupling efficiency between the antenna and the dots, and (v) the total number of hot spots per unit area (which equals the product of the pillar density, the numbers of dots and nanogaps per pillar, and the percentage of hot gaps). By optimizing these relevant parameters, the D2PA architecture has achieved the record high fluorescence enhancement and uniformity reported here. Furthermore, the advantages of D2PA enhancement and the role of each D2PA element have been thoroughly studied in our SERS study [24]. Indeed, one of the reasons for the observed excellent uniformity is the fact that the hot spot density in D2PA is several orders of magnitude larger than in previous structures. For a D2PA of 200 nm pitch, we have a pillar density of 2.5 × 109 cm−2 (25 µm−2 ) and 10–50 dots per pillar (depending on specific pillar geometry), and therefore a density of the dots and associated gaps of 2.5 × 10¹⁰ –1.50 × 10¹¹ dots cm−2 (250–1500 dots µm−2 ). For a diffraction limited laser beam of 1 µm−2 area, the D2PA with 200 nm pitch will have ∼25 pillars and ∼250–1500 nanodots and associated gaps in the excitation beam area. Using the experimentally measured relative variation of fluorescence enhancement, we can get a sense of the actual
9. Conclusion To summarize, we have observed a large and uniform fluorescence enhancement of a dye molecule ICG using a new nanoplasmonic structure, a D2PA. The observed fluorescence enhancement is, respectively, 2970 and 4.5 × 10⁶ fold for the area-average and the single molecule placed at a hot spot, which is over 15 and 3000 times higher than previously reported—hence the highest fluorescence enhancement observed so far. Furthermore, the new plasmonic structure has demonstrated excellent uniformity (less than 11% variation) over the entire sample, the large area-average fluorescence enhancement is constant over a wide range of dye concentrations and laser excitation powers, and was fabricated in large area (400 ) wafers precisely, simply, and inexpensively by combining nanoimprint, self-alignment, and self-assembly. The high enhancement should not be limited to dyes but also quantum dots and other emitters, and should not be limited to fluorescence but also other luminescences. The high enhancement, large area uniformity, plus ease of mass-production in large sizes and large quantities will open up opportunities for wide and significant applications of the D2PA structure in science, engineering, and medicine, such as biological/chemical/medical imaging and sensing, light emitting devices, energy harvesting (e.g. solar cells), communications, and many others. 8
Nanotechnology 23 (2012) 225301
W Zhang et al
Figure 9. Model and FDTD simulation of a D2PA, assuming only one Au dot. (a) 2D schematic showing the electrical coupling between different parts of a D2PA. (b) 2D electrical field intensity enhancement distribution on a logarithmic scale.
Acknowledgments
[13] Nie S M and Emery S R 1997 Science 275 1102–6 [14] Farahani J N, Pohl D W, Eisler H J and Hecht B 2005 Phys. Rev. Lett. 95 017402 [15] Bakker R M et al 2008 New J. Phys. 10 125022 [16] Muskens O L, Giannini V, Sanchez-Gil J A and Rivas J G 2007 Nano Lett. 7 2871–5 [17] Kinkhabwala A, Yu Z F, Fan S H, Avlasevich Y, Mullen K and Moerner W E 2009 Nature Photon. 3 654–7 [18] Anger P, Bharadwaj P and Novotny L 2006 Phys. Rev. Lett. 96 113002 [19] Bek A, Jansen R, Ringler M, Mayilo S, Klar T A and Feldmann J 2008 Nano Lett. 8 485–90 [20] Gerard D et al 2008 Phys. Rev. B 77 045413 [21] Pompa P P et al 2006 Nature Nanotechnol. 1 126–30 [22] Tam F, Goodrich G P, Johnson B R and Halas N J 2007 Nano Lett. 7 496–501 [23] Bardhan R, Grady N K, Cole J R, Joshi A and Halas N J 2009 ACS Nano 3 744–52 [24] Li W D, Ding F, Hu J and Chou S Y 2011 Opt. Express 19 3925–36 [25] Chou S Y, Krauss P R and Renstrom P J 1995 Appl. Phys. Lett. 67 3114–6 [26] Chou S Y, Krauss P R and Renstrom P J 1996 Science 272 85–7 [27] Chou S Y, Krauss P R, Zhang W, Guo L J and Zhuang L 1997 J. Vac. Sci. Technol. B 15 2897–904 [28] Marengo J, Ucha R A, Martinez-Cartier M and Sampaolesi J R 2001 Int. Ophthalmol. 23 413–23 [29] Schutt F, Fischer J, Kopitz J and Holz F G 2002 Clin. Exp. Ophthalmol. 30 110–4 [30] Still J M, Law E J, Klavuhn K G, Island T C and Holtz J Z 2001 Burns 27 364–71 [31] Ntziachristos V, Yodh A G, Schnall M and Chance B 2000 Proc. Natl Acad. Sci. USA 97 2767–72 [32] Corlu A et al 2007 Opt. Express 15 6696–716 [33] Ambrose W P, Goodwin P M, Martin J C and Keller R A 1994 Phys. Rev. Lett. 72 160
We thank Yixing Liang and Hao Chen for their help with the silica spacer deposition using PECVD, and the Defense Advanced Research Program Agency (DARPA) and National Science Foundation (NSF) for funding and support. Contributions SYC originated the idea of use of the D2PA structures for fluorescence enhancement, and designed and directed the research. FD and WDL fabricated the D2PA samples. WHZ, YXW and SYC designed and performed fluorescence measurements. WHZ and SYC contributed to data analysis. JH contributed to simulation.
References [1] Chalfie M, Tu Y, Euskirchen G, Ward W W and Prasher D C 1994 Science 263 802–5 [2] Bruchez M, Moronne M, Gin P, Weiss S and Alivisatos A P 1998 Science 281 2013–6 [3] Lounis B and Moerner W E 2000 Nature 407 491–3 [4] Shields A J 2007 Nature Photon. 1 215–23 [5] Weitz D A, Garoff S, Gersten J I and Nitzan A 1983 J. Chem. Phys. 78 5324–38 [6] Das P and Metiu H 1985 J. Phys. Chem. 89 4680–7 [7] Fort E and Gresillon S 2008 J. Phys. D: Appl. Phys. 41 013001 [8] Wokaun A, Lutz H P, King A P, Wild U P and Ernst R R 1983 J. Chem. Phys. 79 509–14 [9] Kuhn S, Hakanson U, Rogobete L and Sandoghdar V 2006 Phys. Rev. Lett. 97 017402 [10] Zhang J, Fu Y, Chowdhury M H and Lakowicz J R 2007 Nano Lett. 7 2101–7 [11] Song J H, Atay T, Shi S F, Urabe H and Nurmikko A V 2005 Nano Lett. 5 1557–61 [12] Rigneault H et al 2005 Phys. Rev. Lett. 95 117401
9