NeuroImage 58 (2011) 442–457
Contents lists available at ScienceDirect
NeuroImage j o u r n a l h o m e p a g e : w w w. e l s ev i e r. c o m / l o c a t e / y n i m g
Generalised filtering and stochastic DCM for fMRI Baojuan Li a,c, Jean Daunizeau a,b, Klaas E. Stephan a,b, Will Penny a, Dewen Hu c, Karl Friston a,⁎ a b c
The Wellcome Trust Centre for Neuroimaging, University College London, Queen Square, London WC1N 3BG, UK Laboratory for Social and Neural Systems Research, Institute of Empirical Research in Economics, University of Zurich, Zurich, Switzerland College of Mechatronic Engineering and Automation, National University of Defense Technology, Changsha, Hunan 410073, PR China
a r t i c l e
i n f o
Article history: Received 17 September 2010 Revised 10 December 2010 Accepted 31 January 2011 Available online 17 February 2011 Keywords: Bayesian Filtering Dynamic causal modelling fMRI Free energy Dynamic expectation maximisation Random differential equations Neuronal
a b s t r a c t This paper is about the fitting or inversion of dynamic causal models (DCMs) of fMRI time series. It tries to establish the validity of stochastic DCMs that accommodate random fluctuations in hidden neuronal and physiological states. We compare and contrast deterministic and stochastic DCMs, which do and do not ignore random fluctuations or noise on hidden states. We then compare stochastic DCMs, which do and do not ignore conditional dependence between hidden states and model parameters (generalised filtering and dynamic expectation maximisation, respectively). We first characterise state-noise by comparing the log evidence of models with different a priori assumptions about its amplitude, form and smoothness. Face validity of the inversion scheme is then established using data simulated with and without state-noise to ensure that DCM can identify the parameters and model that generated the data. Finally, we address construct validity using real data from an fMRI study of internet addiction. Our analyses suggest the following. (i) The inversion of stochastic causal models is feasible, given typical fMRI data. (ii) State-noise has nontrivial amplitude and smoothness. (iii) Stochastic DCM has face validity, in the sense that Bayesian model comparison can distinguish between data that have been generated with high and low levels of physiological noise and model inversion provides veridical estimates of effective connectivity. (iv) Relaxing conditional independence assumptions can have greater construct validity, in terms of revealing group differences not disclosed by variational schemes. Finally, we note that the ability to model endogenous or random fluctuations on hidden neuronal (and physiological) states provides a new and possibly more plausible perspective on how regionally specific signals in fMRI are generated. © 2011 Published by Elsevier Inc.
Introduction This paper is about stochastic dynamic causal modelling of fMRI time series. Stochastic DCMs differ from conventional deterministic DCMs by allowing for endogenous or random fluctuations in unobserved (hidden) neuronal and physiological states, known technically as system or state-noise (Riera et al., 2004; Penny et al., 2005; Daunizeau et al., 2009). In this paper, we look more closely at the different ways in which stochastic DCMs can be treated. Deterministic DCMs provide probabilistic forward or generative models that explain observed data in terms of a deterministic response of the brain to known exogenous or experimental input. This response is a generalised convolution of the exogenous input (e.g. the stimulus functions used for defining design matrices in conventional fMRI analyses). In contrast, stochastic DCMs allow for fluctuations in the hidden states, such as neuronal activity or hemodynamic states like local perfusion and deoxyhemoglobin content. These fluctuations can be regarded as a result of (endoge⁎ Corresponding author at: The Wellcome Trust Centre for Neuroimaging, Institute of Neurology, Queen Square, London WC1N 3BG, UK. Fax: + 44 207 813 1445. E-mail address: k.friston@fil.ion.ucl.ac.uk (K. Friston). 1053-8119/$ – see front matter © 2011 Published by Elsevier Inc. doi:10.1016/j.neuroimage.2011.01.085
nous) autonomous dynamics that are not explained by (exogenous) experimental inputs. This state-noise can propagate around the system and, potentially, can have a profound effect on the correlations among observed fMRI signals from different parts of the brain. In this work, we ask whether it is possible to model endogenous or random fluctuations and still recover veridical estimates of the effective connectivity that mediates distributed responses. In particular, we compare and contrast DCMs with and without stochastic or random fluctuations in hidden states and explore variants of stochastic DCMs that make different assumptions about the conditional dependence between unknown (hidden) states and parameters. Dynamic causal modelling (DCM) refers to the inversion of statespace models formulated with differential equations. Crucially, this inversion or fitting allows for uncertainty about both the states and parameters of the model. To date, DCMs for neuroimaging time series have been limited largely to deterministic DCMs, where uncertainty about the states is ignored (e.g., Friston et al., 2003). These are based on ordinary differential equations and assume that there are no random variations in the hidden neuronal and physiological states that mediate the effects of known experimental inputs on observed fMRI responses. In other words, the only uncertainty arises at the point of observation, through measurement noise. However, many
B. Li et al. / NeuroImage 58 (2011) 442–457
studies suggest that physiological noise due to stochastic fluctuations in neuronal and vascular responses need to be taken into account (Biswal et al., 1995; Krüger and Glover, 2001; Riera et al., 2004). Recently, there has been a corresponding interest in estimating both the parameters and hidden states of DCMs based upon differential equations that include state-noise. Examples of these have been in the DCM literature for a while (e.g., Friston, 2008; Daunizeau et al., 2009). Early pioneering work in this area focussed on multivariate autoregression and state-space models formulated as difference equations (Riera et al., 2004; Valdes-Sosa, 2004; Penny et al., 2005; Valdés-Sosa et al., 2005). Riera et al. (2004) used stochastic differential equations to model hemodynamic responses in fMRI data, and estimated the underlying states and parameters from BOLD responses using a local linearisation innovation method. Penny et al. (2005) used difference equations to furnish a bilinear state-space model for fMRI time series and estimated its parameters and states using expectation maximisation (EM). This work was extended by Makni et al. (2008), who used a Variational Bayes inversion scheme that allowed for priors over model parameters and enabled model comparison (Penny et al., 2004). More recently, Daunizeau et al. (2009) introduced a general variational Bayesian approach for approximate inference on nonlinear models based on stochastic differential equations. In their recent work, Sotero et al. (2009) used the innovation method to invert a biophysical generative model of fMRI, which included both physiological and observation noise. This paper deals with models based on random differential equations rather than stochastic differential or difference equations. This affords a model of state-noise that is not restricted to Wiener processes or Markovian assumptions. Furthermore, we will consider DCMs that comprise a network of regions (see also Valdés-Sosa et al., 2005), instead of the single regions considered previously (Penny et al., 2005; Makni et al., 2008). Our work in this area has focused on schemes that simplify the inversion problem, using various assumptions about the posterior or conditional density on unknown quantities in the model. Usually this density is assumed to have a Gaussian form. This is known as the Laplace approximation. In addition to this assumption, schemes based upon variational Bayes assume that the states and parameters (and any hyperparameters governing the amplitude of random noise) are conditionally independent. This is known as the mean-field approximation. Each set of conditionally independent quantities induces a separate optimisation step in the variational inversion scheme. For deterministic DCMs there are only two unknown quantities, the parameters and the hyperparameters. These are optimised by maximising a variational (freeenergy) bound on the model log evidence in two steps. These are usually described as expectation and maximisation steps in variational EM schemes (Friston et al., 2003). Stochastic DCMs include a new set of unknown variables, namely, the hidden states. This introduces a third (dynamic) step, leading to schemes like dynamic expectation maximisation (DEM; Friston et al., 2008). Recently, we have developed a simpler and more general scheme called generalised filtering (GF; Friston et al., 2010) that dispenses with the (mean-field) conditional independence assumption. In this paper, we examine the utility and validity of modelling uncertainty about hidden states and the impact of conditional independence assumptions implicit in the difference between DEM and GF. We will show that estimates of effective connectivity (parameter estimates) from fMRI data are relatively robust to these fluctuations. Furthermore we demonstrate the potential usefulness of generalised filtering over its mean-field variant (DEM), when making inferences about differences in coupling among brain regions. This paper comprises four sections. In the first, we present an illustrative application of generalised filtering to the same fMRI data set (attention to motion) that we have used previously to demonstrate DCM using EM (Friston et al., 2003; Stephan et al., 2008) and DEM (Friston et al., 2008). This section serves to illustrate the nature
443
of the GF scheme and the results it produces. Our focus here will be on estimates of hidden neuronal and physiological states causing data and how their estimation affects inference on the parameters we are interested in (effective connectivity). Having established that it is possible to recover estimates of both parameters and states, the second section turns to the nature of noise or fluctuations in the hidden states. This section uses model comparison to search over models with different hyperpriors on the amplitude, form and smoothness of noise. In the third section, we turn to face validity and ensure that the accuracy of parameter estimates is robust to the introduction of state-noise. We generated data with and without state-noise (using the conditional parameter estimates from the first section) and fitted stochastic (GF) and deterministic (EM) DCMs. Using the conditional density on parameters and models, we then assessed the ability of each DCM to distinguish between data that were generated with and without state-noise and the impact of false assumptions about state-noise on parameter estimates. In the final section, we turn to construct validity and apply DCM to empirical data from an fMRI study of (clinical) group differences. Our focus here was on the conditional estimates of effective connectivity from EM, DEM and generalised filtering. Our objective in these analyses was to see if the deterministic and mean-field assumptions (implicit in EM and DEM) improved or subverted the ability of the estimators to distinguish between groups (under the assumption that group differences exist), in terms of their functional architectures (i.e. effective connectivity). We discuss the implications of our findings in the discussion, paying special attention to endogenous brain activity in dynamic causal modelling. Stochastic DCM In this section, we reanalyse an old data set that has been used extensively in demonstrating connectivity analyses over the years. These data were acquired during an attention to visual motion paradigm and have been used to illustrate psychophysiological interactions, structural equation modelling, multivariate autoregressive models, Kalman filtering, variational filtering, EM and DEM (Friston et al., 1997; Büchel and Friston, 1997, 1998; Friston et al., 2003, 2008; Harrison et al., 2003; Stephan et al., 2008). Here, we revisit questions about the generation of distributed responses by analysing the data using conventional deterministic DCMs (EM), stochastic DCMs under the mean-field approximation (DEM) and generalised filtering (GF). The mathematical details of these schemes are described in a series of technical papers (e.g., EM: Friston et al., 2007; DEM: Friston et al., 2008; GF: Friston et al., 2010). In this paper, we focus on the products of these schemes and how they differ from each other. One interesting thing that we will see is that modelling endogenous fluctuations allows one to infer neuronal and physiological states explicitly. This provides a different perspective on how to model brain dynamics, which we will return to in the discussion. We will first describe the data and then review comparative analyses, under the three different schemes. Empirical data Data were acquired from a normal subject at 2 T using a Magnetom VISION (Siemens, Erlangen) whole-body MRI system, during a visual attention study. Contiguous multi-slice images were obtained with a gradient echo-planar sequence (TE = 40 ms; TR = 3.22 s; matrix size = 64 × 64 × 32, voxel size 3 × 3 × 3 mm). Four consecutive 100 scan sessions were acquired, comprising a sequence of 10 scan blocks of five conditions. The first was a dummy condition to allow for magnetic saturation effects. In the second, Fixation, subjects viewed a fixation point at the centre of a screen. In an Attention condition, subjects viewed 250 dots moving radially from the centre at 4.7 ° per second and were asked to detect changes in radial velocity. In No
444
B. Li et al. / NeuroImage 58 (2011) 442–457
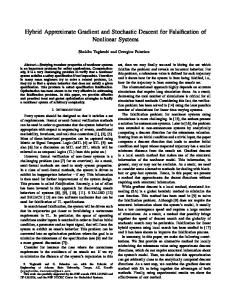
attention, the subjects were asked simply to view the moving dots. In a Static condition, subjects viewed stationary dots. The order of the conditions alternated between Fixation and visual stimulation (Static, No Attention, or Attention). In all conditions subjects fixated the centre of the screen. No overt response was required in any condition and there were no actual changes in the speed of the dots. The data were analysed using a conventional SPM analysis (http://www. fil.ion.ucl.ac.uk/spm). The responses of three key regions were summarised using the principal local eigenvariate of each region (radius = 6 mm) centred on the maximum of a contrast testing for an appropriate effect. An early visual region (V1) was identified using a contrast testing for the effect of visual stimulation. An extrastriate cortex (motion-sensitive area V5; Zeki et al., 1991) was identified using a test for motion-specific responses, and an attentional area was identified in the frontal eye fields (FEF), using a test for the effects of attention (see Fig. 1 for details). Model architecture and inversion Fig. 1 shows the DCM dependency graph for this empirical attention study: The most interesting aspects of this architecture speak to the role of motion and attention in exerting enabling or modulatory effects on coupling. Critically, the influence of motion is to enable connections from V1 to the motion-sensitive area V5. The influence of attention is to enable forward connections from V5 to a higher (frontal) region. The locations of these regions centred on visual cortex V1; 9, −87, 6 mm: motion-sensitive area V5; 39, 78, 9 mm and a frontal region, FEF; 12, −12, 66 mm. Note that in this paper, we condition everything on a single model and assume this is
the correct model. Usually one would optimise the model before focussing on the hidden states and parameters. A full treatment of model optimisation using generalised filtering can be found in Friston et al. (2011). In this example, the exogenous inputs ui(t) ∈ {0,1}: i = 1,…3, encode the presence of visual stimulation, the presence of motion in the visual field and attentional set (attending to speed changes). The responses yi(t) ∈ ℜ: i = 1,…3 correspond to the three regional eigenvariates. The unknown connections Aij ∈ θ: i, j = 1,…3 among regions were constrained to conform to a hierarchical pattern, in which each area was reciprocally connected to its supraordinate area (see Fig. 1). The strengths of these connections correspond to the effective connectivity in the absence of (mean-centred) inputs. Visual stimulation entered at, and only at, V1. The effect of motion in the visual field was modelled as a bilinear modulation of the V1 to V5 connection and attention modulated the forward connection from V5 to FEF. In the DCM used here, these modulatory effects are represented by bilinear parameters B(k) ij ∈ θ:i,j,k = 1,…,3 where the random differential equation for the hidden neuronal states is (in matrix form) � � ðkÞ ðxÞ x˙ = A + ∑k uk B x + Cv + ω v = u + ωðvÞ
1
Here Cik ∈ θ: i,k = 1,…,3 couples the k-th input to the i-th region. The unknown parameters θ t {A,B,C,H} include the coupling strengths and a set of region-specific hemodynamic parameters H governing the dynamics of four additional hemodynamic states h(t) ∈ ℜ for
Fig. 1. This figure shows the basic architecture of the DCM used to illustrate various inversion schemes. The central panel shows the location of three regions examined, superimposed on a slice of a (normalised) template MRI (V1: primary visual area; V5: motion-sensitive area: FEF: frontal area). The arrows denote the connections we allowed (a priori) to take non-zero values. These regions were identified using appropriate contrasts following a conventional SPM analysis. The experimental (exogenous) inputs shown on the left correspond to visual stimulation, motion in the stimuli and attention to motion, during 30 s epochs of a block design. These inputs can excite responses in each area directly (solid lines; here visual input enters directly into V1) or modulate (enable) connections (dotted lines; here motion enables the connection from V1 to V5 and attention enables the connection from V5 to FEF). The empirical responses the DCM is trying to explain are shown on the right. These are the principal eigenvariates from voxels within a 6 mm sphere centred on the (stereotaxic) location of each region in the centre panel. Note the emergence of attention-related activity at higher levels in this simple visual hierarchy. The input to V1 is not a perfect box car because it has been down-sampled (using a discrete cosine basis set) from the original specification (in time bins of a sixteenth of the inter-scan interval) to the empirical sampling rate.
B. Li et al. / NeuroImage 58 (2011) 442–457
each region (vasodilatory signal, blood flow, blood volume and deoxyhemoglobin content), as described by an extended version of the Balloon model (Buxton et al., 1998; Friston et al., 2003). A nonlinear mixture of volume and deoxyhemoglobin content provides the predicted BOLD response (Stephan et al., 2007). Here, the random state fluctuations ω(x) ∈ Ω(x) have an unknown precision (inverse variance) and smoothness that are hyperparameterised by π, σ ∈ γ ˜ ðxÞ e N ð0; V ðσ Þ⊗Σðe−π ÞÞ. Under this Gaussian assumption such that ω for the state-noise, the hyperparameters π ∈ γ are log precisions and the smoothness σ ∈ γ that encodes correlations V(σ)� among the � ˜ = ω; ω′ ; ω″ ; … T : Similarly generalised motion of state-noise ω for the fluctuations on the hidden causes ω(v) ∈ Ω(v), hemodynamic states ω(h) ∈ Ω(h) and observation noise ω(y) ∈ Ω(y). Note the random differential equation above makes the inputs u(t) ∈ {0,1} priors on the hidden neuronal causes v(t) ∈ ℜ, because the fluctuations induce uncertainty about how inputs influence neuronal activity. Crucially, when state-noise has a very low amplitude (π(v,x,h)→∞), Eq. (1) reduces to a (bilinear) ordinary differential equation used in conventional deterministic DCMs for fMRI � � ðkÞ x + Cu x˙ = A + ∑k uk B
2
We will use this limiting case later to simulate data under deterministic assumptions. In summary, stochastic DCMs have three sets of unknown quantities: hidden states st {x,v,h}, unknown parameters θt {A,B,C,H} and unknown hyperparameters γt {σ,π}. The hidden states include neuronal states x (t), their causes v(t), and the hemodynamic states h(t) that engender the BOLD signal and mediate the translation of neuronal activity into hemodynamic responses (Friston et al., 2003). Hidden states meditate the influence of causes on data and endow the system with memory; they are called hidden states because they are not observed directly. The unknown parameters include the coupling strengths A, B, C and a set of region-specific hemodynamic parameters H, while the unknown hyperparameters control the precision (inverse variance) and smoothness of the random fluctuations. Crucially, all hidden � states are �T represented in generalised coordinates of motion: s˜ = s; s′ ; s″ ; … . As discussed elsewhere (Friston, 2008; Friston et al., 2010), representing states in terms of generalised coordinates has several fundamental advantages. Most importantly, this scheme can accommodate temporal correlations in random fluctuations on the hidden states, which are often observed in biological systems (e.g., 1/f spectra; Billock et al., 2001). This circumvents the need to make Markovian or Wiener assumptions about state-noise and allows one to handle real or analytic (continuously differentiable) noise. Inversion of the DCM provides an approximate conditional density on the unknowns and a free-energy bound on the model log evidence. These can be expressed as qð s˜; θ; γÞ = N ðμ; CÞ≈pð s˜; θ; γj y˜ ; mÞ F ≈ ln pð y˜ jmÞ
3
where μ, C are the conditional means and covariances. Here, y˜ := ∪t y˜ ðt Þ denotes all the data and their temporal derivatives in the time series (we use derivatives up to fourth order in this paper, under the assumption that higher order derivatives have no precision, given the temporal correlations we consider). In variational schemes, one usually assumes that the approximating density factorises over sets of parameters; this is called a mean-field approximation. For example, in DEM, we assume that the hidden states, parameters and hyperparameters are conditionally independent given the data. This means, DEM assumes uncertainty about the parameters (after seeing the data) does not depend on uncertainty about the states or hyperparameters. While this is clearly not true, it provides a sufficiently good approximation is most situations and greatly finesses the numerics of model inversion. Under the mean-field approximation (in DEM), we
445
have qð s˜; θ; γ; t Þ = qð s˜; t ÞqðθÞqðγÞ, and under deterministic approximations (in EM) we have qð s˜; θ; γ; t Þ = qðθÞqðγÞ, because there is no uncertainty about the states. There is a subtle but important distinction between the conditional densities furnished by DEM and GF: The conditional density under GF changes with time and covers the parameters (and hyperparameters). This means we allow for timedependent changes in conditional uncertainty about the parameters, even though our prior belief is that they are constant. In other words, at various times in the experiment we may have more confidence about some parameters than others, depending on our uncertainty about the hidden states. In contrast, the mean-field assumption in DEM means that uncertainty about the hidden states does not affect uncertainty about the parameters (and hyperparameters), which means we can accumulate (assimilate) all the data before computing the (marginal) conditional density on the parameters. Technically, this has implications for the way the evidence for each model is accumulated: One can either use the log evidence of the accumulated data or the accumulated log evidence of the data. This corresponds to using the free-energy F of the accumulated time series or the accumulated free energy at each point in time (this is known as the free action S). In continuous time, these two summaries correspond to F ≤ ln pð y˜ jmÞ S ≤∫dt ln pð y˜ ðt Þ jmÞ
4
For internal consistency, we will use the free energy because this allows the direct comparison with free-energy bounds on log evidence from mean-field (variational) schemes. The free-energy bound from GF basically instantiates the mean-field approximation, after the conditional density has been optimised. This uses Bayesian parameter averaging over time (see Friston et al., 2010 for details). This is a useful device because it means we can compare the quality of the free-energy bounds provided by conditional densities optimised with and without the mean-field approximation, using GF and DEM respectively. We will use this in the last section. Comparative inversions Here, we focus on the impact of the deterministic and mean-field approximations on the conditional densities of the interesting parameters. There are the two bilinear effects mediating the (2) (3) modulatory influence of motion and attention (B21 ,B32 ) and an exogenous coupling parameter C11, mediating the effect of visual simulation on striate cortex. For all analyses we assumed fixed values for the log precision πm of hidden states; π(x) = π(h) = πm = 8, a log precision π(v) = 4 for the hidden causes and a smoothness of σm = 12 TR, unless otherwise stated. Although the inversion schemes can estimate these hyperparameters, we fixed them here using zero variance hyperpriors. The optimisation of these hyperpriors is described in the next section. We used the usual priors on the hemodynamic and coupling parameters as described previously (Friston et al., 2003). The stochastic schemes were initialised with the conditional parameter estimates of the deterministic scheme and the conditional log precision, plus one (because deterministic schemes over estimate observation noise variance in the presence of state-noise). The deterministic schemes are computationally faster (a few seconds) than the DEM and GF schemes (a few minutes). Fig. 2 shows the conditional estimates of the parameters, under the three schemes. A remarkable thing about these results is how similar the estimates are, particularly when comparing GF and EM and for the coupling parameters of interest that had uninformative priors. This is a reassuring result because it suggests that modelling endogenous activity does not explain away the information in the data that informs these estimates. However, there are important differences. Generally speaking, the conditional means or expectations from the stochastic schemes (GF and DEM) are quantitatively smaller and
446
B. Li et al. / NeuroImage 58 (2011) 442–457
Fig. 2. Conditional estimates of parameters (and log precisions) from the three schemes considered (GF – generalised filtering; DEM – dynamic expectation maximisation; and EM – expectation maximisation). The log precision or hyperparameter estimates from the three schemes, for each area (1 to 3), are shown on the lower right. The grey bars report the conditional means or expectations and the red bars correspond to 90% conditional confidence intervals. This figure only shows 9 of the 16 unknown parameters in this DCM: 6 effective connectivity parameters (A), 2 bilinear parameters (B) and 1 exogenous parameter (C) (see the letters next to bars). In addition, there are two-region-specific parameters encoding hemodynamic transit time and vasodilatory signal decay, and a single epsilon parameter controlling the mixture of intravascular and extravascular contributions to the measured fMRI signal (not shown in the plot).
more precise than the deterministic (EM) scheme. This quantitative difference suggests that stochastic schemes rely less on exogenous input to explain the same responses, an observation we will return to in the discussion. In terms of the difference between the two stochastic schemes, one can see that generalised filtering produces larger conditional confidence intervals than DEM (see also Friston et al., 2010). This is intuitive because uncertainty about the parameters in GF is affected by uncertainty about the states This example was also chosen to highlight the failure of the meanfield approximation (DEM) to detect the enabling or modulatory effect of motion (particularly the first B parameter), relative to the GF (and EM) estimates. Furthermore, the value of the exogenous coupling C parameter is much higher than under generalised filtering. These results probably reflect our rather inefficient experimental design: we were originally interested in the effect of attention (not motion). This means the visual and motion input (stimulus functions) are very similar, because we only used a small number of epochs without motion (see Fig. 1). Operationally, this results in a high degree of conditional dependence between the coupling parameters mediating the effects of visual and motion input (see Friston et al., 2010). In this example, DEM has explained motion-related responses in V5 largely in terms of visual responses. However, the GF scheme is much more confident about a modulatory effect of motion. The
difference in free energy for the GF and DEM schemes was 5436.1 suggesting that GF provided a much tighter (better) bound on the log evidence than the equivalent mean-field bound. Fig. 2 also shows the estimates of the observation noise hyperparameters (log precisions) for the three regions and three schemes (lower right panel). Again these are quantitatively similar, with stochastic schemes providing higher estimates of precision (i.e., less noise). The results here are interesting and intuitive. First one can see that the EM thinks observation noise is greater than either stochastic scheme. This is sensible because EM can only model random effects in terms of measurement noise, whereas stochastic models enjoy many more degrees of freedom to fit data. When comparing the two stochastic schemes, we see that the mean-field assumption used by DEM results in a higher estimate of precision in two areas. This is again sensible because these estimates ignore conditional correlations between the unknown parameters and states. Note that overestimates of precision contribute to overconfidence about parameters (c.f. upper right panel of Fig. 2). In summary, the increase in the estimated precision of observation noise with DEM, relative to GF, is consistent with the increased conditional precision of the parameter estimates and may reflect the overconfidence one generally sees with mean-field approximations. Fig. 3 shows the (GF) conditional estimates of the hidden causes and states. It is these estimates that are unavailable in deterministic
B. Li et al. / NeuroImage 58 (2011) 442–457
447
Fig. 3. A summary of the conditional expectations (means) of the hidden causes and states generating observed regional data after generalised filtering. The hidden causes are shown on the lower left. These can be thought of as estimate of afferent neuronal activity elicited by experimental inputs. Here, there are three such inputs (see Fig. 1). The solid lines are time-dependent means and the grey regions are 90% confidence intervals (i.e., confidence tubes). The resulting behaviours of the hidden states are shown on the upper right. These states comprise, for each region, neuronal activity, vasodilatory signal, normalised flow, volume and deoxyhemoglobin content. The last three are log-states. Again, solid lines represent conditional expectations and the grey regions are 90% confidence tubes. These hidden states provide the predicted responses (conditional expectation) in the upper left for each region (solid lines) and associated prediction errors (red dotted lines) in relation to the observed data.
schemes. This figure highlights the number and nature of hidden quantities that are optimised during model inversion, in addition to the unknown parameters and hyperparameters above. It also depicts the accuracy of model predictions, in terms of prediction errors (upper left). The predictions are generated by hidden causes (lower left) that can represent an estimate of afferent neuronal activity elicited by experimental inputs. Here, there are three such inputs (see Fig. 1). The solid lines are time-dependent means and the grey regions are 90% confidence intervals (i.e., confidence tubes, providing 5% bounds on either side of the conditional mean). The responses of the hidden states are shown on the upper right. These comprise neuronal activity, vasodilatory signal, normalised flow, volume and deoxyhemoglobin content for each region. These hidden states generate the predicted responses and associated prediction errors, in relation to the observed data. One can see that the prediction errors are small in relation to the predicted responses. Fig. 4 focuses on responses in the early visual region and compares the estimates of hidden neuronal and hemodynamic states with and without the mean-field approximation (i.e., for DEM and GF). The two schemes give very similar estimates of early visual responses, with the exception of neural activity and ensuing vasodilatory signal. These are quantitatively larger in the DEM scheme, relative to the GF scheme. This reflects a greater influence of the visual input, reflecting the
larger exogenous coupling parameter estimate described above. These conditional estimates provide an interesting picture of the dynamics that underlie fMRI signals. Here, we see that afferent visual activity (upper panel) drives regional neuronal activity (second row, blue line), which induces transient bursts of vasodilatory signal (green), which are suppressed rapidly by the resulting increase in blood flow (third row, blue line). The increase in flow dilates the venous capillary bed to increase blood volume (green) and dilute deoxyhemoglobin (red). Volume and deoxyhemoglobin content determine the predicted fMRI response (lower row). As expected, the predicted response is generally less than the observed response. This reflects the fact that there are shrinkage priors on the hidden causes and states. Summary In summary, we have seen that modelling endogenous fluctuations using DCMs based on random differential equations is possible and, indeed, provides conditional estimates of parameters that are comparable to deterministic schemes. This is the first time that stochastic DCM has be used to explain fMRI responses in a distributed network of coupled regions and suggests that the numerics are computationally feasible and the results are consistent with
448
B. Li et al. / NeuroImage 58 (2011) 442–457
Fig. 4. This figure unpacks the conditional estimates of the hidden states in the previous figure for the first (early visual) area V1. These estimates are shown for the GF scheme (left) and the DEM scheme (right) that makes additional mean-field assumptions about the posterior density. The top row shows the conditional estimates of the hidden cause, elicited by visual input. This is very similar to the prior expectation in Fig. 1, based on the known experimental design. The second row shows the resulting response in terms of regional neuronal activity (blue) and consequent vasodilatory signal (green). Note the transient changes in signal, following a shift in neuronal activity. The third row shows the expected time course of blood flow (blue), volume (green) and deoxyhemoglobin content (red). Finally, the lower panels show the predicted (green) and observed (blue) regional responses. The two schemes give very similar estimates, with the exception of neural activity and ensuing signal. These are quantitatively larger (up to 10% changes) in the DEM scheme, relative to the GF scheme. This reflects the greater influence of the parameter estimate C from the DEM scheme (see previous figure).
deterministic schemes. We have seen that stochastic DCMs reduce to deterministic DCMs when the amplitude of state-noise falls to zero. One interesting consequence of this is that the stimulus functions used in conventional analyses take on the role of prior expectations about exogenous influences on neuronal dynamics. This means that when one inverts stochastic DCMs one obtains conditional estimates of hidden neuronal causes. In other words, it is possible to estimate the neuronal inputs to a region elicited experimentally, before convolution with a hemodynamic operator. This may be useful in identifying systematic adaptation and other fluctuations over the course of trials or blocks. All the analyses of this section used assumed fixed values (through infinitely precise hyperpriors) for the noise on hidden causes and states. The next section describes how these values were chosen. The nature of noise In this section, we characterise the random fluctuations in terms of their amplitude, smoothness and form. These are interesting issues
from several perspectives. Physiologically speaking, a large number of biophysical and empirical studies suggest quantitative bounds on the excursion of hemodynamic states that generate fMRI signals. These provide a quantitative reference when assessing the validity of any model that accommodates these fluctuations. In brief, we know that typical fMRI signals are caused by changes in physiological states that seldom exceed about 20% of their baseline values. If we assume that about 10% of the variation in these states is due to autonomous (random) fluctuations (cf, Eke et al., 2006), then we would expect a standard deviation of about 2%, which corresponds to a log precision of about 8≈-2ln(2%). The value of 10% is based on common sense, in that if (non-neurogenic) hemodynamic fluctuations approached their maximum amplitude, they could not report neuronal activity and fMRI would not work. The argument here is a bit more involved for hidden states because the random fluctuations are on their motion. The resulting variance of hidden states scales with both the variance of these fluctuations and the time constants of the associated dynamics. However, there is a quantitative correspondence when the time constants are about one unit of time, which is largely the case
B. Li et al. / NeuroImage 58 (2011) 442–457
for both neuronal and hemodynamics (noting that the time constants of neuronal population dynamics are much greater than for single neurons). These quantitative arguments mean that if we compared the log evidence of DCMs with different hyperpriors on the amplitude of state-noise, we would hope to find that the best models assumed a log precision of around eight. This provides a test of construct validity, i.e. whether the hyperparameters of state-noise actually represent what they should represent. This analysis is pursued below and can be regarded as a validation in relation to known neurophysiological constraints. From a technical perspective, the issue of smoothness in noise is fundamental. Nearly all conventional approaches to the estimation of dynamic (state-space) models assume that random fluctuations are Markovian (i.e., they conform to a Wiener process). This means the models are implicitly or explicitly based on stochastic differential equations (in the Ito sense; Itō, 1951). This contrasts with the models used by generalised filtering and DEM, which do not make Wiener assumptions and use random differential equations (in the Stratonovich ˜ ðt Þ sense; Stratonovich, 1967). This is why we use generalised states; e.g., ω and smoothness above (see Friston, 2008 and Carbonell et al., 2007 for a more detailed discussion). Although there are compelling arguments (Stratonovich, 1967) that suggest real biophysical fluctuations are analytic (differentiable) and correlated, the nature and extent of these correlations in fMRI is unknown. This is because no one has tried to invert stochastic DCMs of fMRI time series to remove the correlations induced by the hemodynamic response function. Model comparison To quantify the precision and smoothness of physiological statenoise, we inverted two series of DCMs using GF and the empirical data for the previous section. The DCMs had a range of infinitely precise hyperpriors; in other words, each DCM assumed a fixed level of statenoise (resp. smoothness). This allowed us to compare the evidence for different levels of state-noise (resp. smoothness) using Bayesian model comparison. This comparison is based on the free-energy bound F ≈ ln p(y|πm⊂m) on the log evidence for a model that entails the prior belief that the log precisions are πm (resp. smoothness is σm). The first series of DCMs assumed log precisions πm = 2,3,…10 � 1 � that ranged � 1 from � high levels 36%≈ exp − 2 2 to low levels 0:6%≈ exp − 2 10 of state-noise (with a fixed smoothness of σm = 12). The second used a log precision of eight but varied the smoothness 1 σm = 12 ; 13 ; …; 10 . We repeated the search over smoothness assumptions, using two forms for the autocorrelation functions of state-noise; a Gaussian and a Lorentzian form
n
ρðωðt + Δt Þ; ωðt ÞÞ = 2
� 1 2 2 exp − Δt = σm 2 � � 2 2 σm = Δt 2 + σm
:: 1 0 ρð0Þ 6 :: 6 0 −ρð0Þ 0 6 V ðσ Þ = 6 :: :: 6 ρð0Þ 0 ρð0Þ 4 ⋮
5
⋯
3 7 7 7 7 7 5
⋱
These correlation functions determine the correlations V(σ) among generalised states (see Friston et al., 2008). Fig. 5 shows the profile of log evidences over log precisions (upper panel) and smoothness (lower panels). One can see immediately that there is much more evidence for models with nontrivial levels of state-noise. This is because the evidence for models with intermediate levels of state-noise (log precision) is much greater than the evidence for alternative models (a difference in log evidence of about five is
449
generally considered very strong evidence for the better model; Penny et al., 2004). As anticipated by quantitative physiological arguments above, the optimum model has a log precision of about eight. This result constitutes one piece of collateral evidence for the form of these DCMs and the assumptions on which they rest. In terms of smoothness, we again see clear evidence of substantial smoothness. Fig. 5 (lower panels) shows a peak at around a smoothness of a half of a time bin (TR). Crucially, there is very strong evidence against Markovian noise (i.e., fluctuations that conform to Wiener processes with no smoothness). Furthermore, the correlations appear to be modelled better with a Gaussian form (left), compared to a Lorentzian form (right). This may reflect the fact that long range correlations in the data were removed by regressing out drift terms during preprocessing. These results do not mean random fluctuations are necessary Gaussian, just that assuming they are Gaussian provides a better model of these data. Note we have simplified things here by assuming all the fluctuations (observation and state-noise) have the same correlation function. This assumption is easily relaxed and will be revisited in future work. Summary In summary, this section has addressed the nature of physiological noise in fMRI, insofar as it can be inferred with stochastic DCMs. We have seen that Bayesian (i.e., evidence-based) model comparison can be used to search over the space of unknown hyperparameters, while implicitly accommodating uncertainty about other model unknowns. The conclusions of this section are that state-noise conforms quantitatively to physiological predictions and that it is serially correlated. These correlations are almost impossible to avoid, in that fluctuations of this sort are themselves generalised convolutions of mesoscopic dynamics and must therefore be analytic (continuous and smooth). They also counsel against procedures (or their implementation) based on Markovian assumptions, like Granger causality and Kalman filtering. It is well known that Granger causality is not valid when data are generated by hidden states. This is because Granger causality effectively conflates observation and state-noise (Newbold, 1978; Nalatore et al., 2007). The results of this section introduce a new dimension (one which motivated the inception of DEM and generalised filtering), namely serially correlated state-noise, which confounds the use of Kalman filtering to finesse the application of Granger causality to systems with hidden states (e.g., Nalatore et al., 2007). Face validity and synthetic data In this section, we apply generalised filtering to simulated data to ensure that veridical parameters can be recovered in the presence of state-noise and that the levels of state-noise do not confound this accuracy. Using a DCM with the same structure and inputs as in Fig. 1, we simulated data with high (stochastic) and low (deterministic) levels of state-noise and then inverted both sorts of data using deterministic (EM) and stochastic (GF) schemes. We hoped to see that the appropriate DCM provided conditional densities on the parameters, whose 90% confidence intervals contained the true values. We were also interested in the accuracy of stochastic model inversion given data with negligible (deterministic) levels of state-noise; i.e., when πm = 32. This is the situation assumed by conventional deterministic DCMs, and we wanted to ensure valid inference with stochastic DCMs in this limiting case. This rather limited set of analyses is not meant to constitute an exhaustive face validation of the approach but simply to ensure stochastic DCM is not cofounded by data that conform to the usual deterministic assumptions. More extensive simulations looking at different levels of noise and graph size (number of edges or connections) will be presented elsewhere.
450
B. Li et al. / NeuroImage 58 (2011) 442–457
Fig. 5. These bar graphs report the results of a model search over models with different precisions on the hidden states (upper panel) and smoothness on the random fluctuations (lower panels). The form of the autocorrelation function of the fluctuations was assumed to be either Gaussian (lower left) or Lorentzian (lower right). The key thing to take from these results is that the optimal log precision (in terms of log-model evidence) is rather high, as would be anticipated by quantitative arguments based on known physiology (see main text). Second, there is very strong evidence for nontrivial smoothness that appears to be modelled better with a Gaussian form, compared to a Lorentzian form: The horizontal line marks the maximum log evidence over both forms.
Synthetic data Fig. 6 shows the simulated deterministic data y˜ low under very low levels (left panels: πm = 32) of state-noise and stochastic data y˜ high under realistic levels (right panels: πm = 8). The format of this figure follows Fig. 3. These simulated responses illustrate, quantitatively, how state-noise affects the hidden states and its relative contribution to the measured respond, in relation to observation noise (here with a log precision of four). These two synthetic data sets were inverted using EM and GF to examine the conditional densities on parameters and models. Comparative evaluations Fig. 7 reports the conditional estimates of the parameters using the same format as Fig. 2. However, here we have the true values (black bars) in addition to the conditional expectations and confidence intervals. These estimates derive from applying deterministic (EM) and stochastic (GF) schemes to the synthetic deterministic and stochastic data above. The main things to take from these estimates
are that the GF schemes provide smaller (but veridical) values than the EM scheme but with a greater conditional precision. This means the stochastic scheme was more accurate. The effect of state-noise (stochastic data) is almost imperceptible but results in a very slight increase in conditional uncertainty for both schemes. This is most evident for parameters 4 and 5. With few exceptions, the true values lie in the 90% confidence regions for all parameters, for all combinations of data and schemes. The notable exceptions are largely in the deterministic (EM) scheme (for deterministic data), which estimates the transit time to be too small and the intrinsic (self) inhibition of neuronal activity to be too high in one (early visual) region. Interestingly, most of the coupling parameters are overestimated in relation to their true values. Conversely, the stochastic GF scheme provided slight underestimates in relation to the true values and is slightly overconfident about these underestimates. This bias or shrinkage of the GF parameter estimates to their prior mean (also seen in Fig. 2) is characteristic of all our simulations. This shrinkage may reflect the fact that stochastic schemes can explain data with changes in both the parameters and hidden states, from their prior values. In general, these changes are minimised when optimising free
B. Li et al. / NeuroImage 58 (2011) 442–457
451
Fig. 6. These plots show the simulated data under very low levels (left panels) of state-noise and realistic levels (right panels). The format of this figure follows Fig. 3. These dynamics illustrate, quantitatively, how state-noise affects the hidden states and the relative contribution to stochastic components of the measured respond, in relation to observation noise (here with a log precision of four). These two synthetic data sets were inverted using EM and GF (see next figure).
energy, because they entail a complexity cost. In short, although the conditional estimates may be biased in relation to the ‘true’ values, they offer a more parsimonious explanation for the data. Having said this, in all cases, non-zero parameters are detected with 90% confidence or more by either scheme. Fig. 8 shows the log precision (hyperparameter) estimates of observation noise in relation to their true values. For stochastic data (left panel), the stochastic DCM (GF) furnished slight overestimates of the correct precision (with a mild overestimation), while the deterministic EM scheme underestimates precision (overestimates noise variance), presumably because it cannot model the effects of state-noise and their contribution to observed signals. Conversely, when the data are deterministic, the deterministic scheme (EM) provides the best estimates, while the stochastic scheme overestimates precision, presumably because it has explained a component of the true observation noise with fluctuations on hidden states. In terms of model comparison, there is a slight problem comparing the log evidence from deterministic and stochastic schemes. This is because the contribution from the conditional density on the hidden causes and states is impossible to evaluate under deterministic schemes (because it has infinitely low entropy due to deterministic assumptions about the states). To circumvent this comparison problem, we adopted priors p(m) on each model that rendered their posterior probabilities, given both sets of data, the same. We then compared the log posteriors ln pðm j y ˜ iÞ = ln pð y ˜ i jmÞ + ln pðmÞ of both models for a given data set y˜ i . This is equivalent to looking at the difference in differences of log evidences. These log posteriors suggested that the deterministic DCM is better for deterministic data ln pðmEM j y ˜ low Þ− ln pðmGF j y ˜ low Þ = 95:6, while �the � stochastic DCM� is better for the stochastic data ln p mEM j y ˜ high − � ln p mGF j y ˜ high = −95:6, as one might hope.
Summary In this section, we have seen that veridical parameter estimates can be recovered by generalised filtering, even if deterministic assumptions hold. Furthermore, (after suitable adjustments) the log evidence furnished by deterministic and stochastic DCMs appears to select models with and without random fluctuations correctly. These results are a provisional attempt to establish face validity (i.e., the scheme does what it is meant to), or at least to describe a procedure for establishing face validity with synthetic data generated using conditional estimates from empirical data. Construct validity and real data In this section, we apply the EM, DEM and GF schemes to empirical data acquired from two clinically distinct groups of subjects, internet addiction (IA) patients and matched healthy controls, during performance of a Go/Stop task. Having optimised all three sorts of DCM for each subject, we harvested the coupling parameter estimates as subject-specific summary statistics. We then used classical inference to look for group differences that would distinguish between the two groups. Our reasoning here was that there are true differences between the groups and that veridical effective connectivity estimates would disclose this difference. This is the construct we used to establish construct validity. In brief, we will see that generalised filtering enabled at least one extra connection to be identified as differing significantly between the two groups, compared to estimates provided by EM and DEM. To assess the impact of the mean-field approximation on the log evidence bound, we also examined the free energy from DEM and GF schemes over subjects.
452
B. Li et al. / NeuroImage 58 (2011) 442–457
Fig. 7. These bar graphs report the conditional estimates of the DCM parameters using the same format as Fig. 2. However, here, we have the true values (black bars) in addition to the conditional expectations and confidence intervals. These estimates derive from applying deterministic (EM) and stochastic (GF) schemes to the deterministic and stochastic data from the previous figure. The main conclusion to take from these estimates is that the GF schemes provide smaller (but veridical) values than the EM scheme but with a greater conditional precision. This means the stochastic scheme was more accurate. The effect of state-noise is not enormous but results in a slight increase in conditional uncertainty for both schemes. With occasional exceptions, the true values lie in the 90% confidence regions for all parameters, for all combinations of data and schemes. The notable exceptions are largely in the deterministic (EM) scheme (for deterministic data), which estimates the transit time to be too small in one region and the intrinsic (self) inhibition of neuronal activity to be too high in the same (early visual) region. Interestingly, most of the coupling parameters are slightly overestimated in relation to their true values. The stochastic scheme (for stochastic data) is overconfident about the input coupling (and underestimates it).
Fig. 8. The figure shows the log precision (hyperparameter) estimates of observation noise in relation to their true values, using the inversion of synthetic data reported in the previous figure. For stochastic data (left panel), the stochastic GF furnished slight overestimates of the correct values, while the deterministic EM scheme underestimates precision (overestimates noise variance), presumably because it cannot model the effects of state-noise and their contribution to observed signals. Conversely, when the data are deterministic, the deterministic scheme (EM) provides the best estimates, while the stochastic scheme overestimates precision, presumably because it has explained a component of the true observation noise with fluctuations in hidden states.
B. Li et al. / NeuroImage 58 (2011) 442–457
We first describe the study design and data, and then turn to the results of the comparative analyses. The analyses in this section are not presented to establish the functional architecture of internet addiction (a full analysis and discussion of these data will be presented elsewhere). They are used to illustrate how the procedures of the previous sections can be applied in a practical setting and to provide a preliminary construct validation of the approach. This validation rests only on the existence of some difference between the groups of subjects studies. Under the null hypothesis of no difference, none of the DCM schemes can provide estimates of coupling that show systematic group differences and, crucially, no differences among the schemes. Empirical data Twenty right-handed Chinese subjects participated in the study (for details, see Li et al., under review). Eleven of the subjects were IA patients and the other nine were matched control subjects. There were no group differences in gender, race (all of the subjects were Chinese), age (mean ± S.D., IA: 13.1 ± 0.7 years versus control: 12.9 ± 0.8 years) or education. The fMRI study used a block design (Fig. 9). At the beginning of the scan, each subject had a 12 s period of preparation before implementing a block of a Go/Stop task for 30 s (task condition). This was followed by a rest block, in which the word ‘rest’ was fixated for 30 s (rest condition). The rest condition was then followed by another block of the task condition for 30 s. Rest and task blocks were repeated five times in each experiment and the whole scanning session lasted 5 min and 12 s. Go/Stop is a procedure for assessing the capacity to inhibit an initiated response. We presented five-digit numbers in black on a white background. The randomly generated five-digit numbers appeared for 500 ms, once every 2 s (500 ms on, 1500 ms off). There were three trial types: go, stop and novel trials. On go trials, participants are told to respond when the number they see is identical to the previous number. A stop trial consists of a stimulus that matches the one before it, but it changes unpredictably from black to red at some specified interval (50, 150, 250, or 350 ms) after stimulus onset. The participants are instructed to
453
withhold their response when a number turns red. Novel trials present non-matching numbers. Go and stop trials each occurred 25% of the time. MRI scanning was performed using a GE 1.5 T whole-body scanner. Blood oxygen level-dependent (BOLD) responses were measured with a T2*-weighted gradient-echo EPI sequence (TR/TE = 3000/ 60 ms, 5 mm slice thickness, 1.5 mm gap, with 18 axial slices, 64 × 64 matrix size, 24 × 24 cm FOV, 90°-flip angle). Model architecture and inversion Functional data were analysed with SPM2. After pre-processing (i.e. realignment, spatial normalization and smoothing), subjectspecific responses were modelled using a general linear model (GLM) for block designs. The ensuing contrast (i.e. “task minus rest”) images were then entered into a second-level (between-subject) two-sample t-test to determine group activation differences in the Go/Stop task. fMRI studies have revealed that response inhibition is largely accomplished by a network of right lateralized regions (Chevrier et al., 2007; Garavan et al., 1999; Konishi et al., 1999; Liddle et al., 2001); therefore, our DCM analysis was restricted to the right hemisphere for simplicity. Based on the group analysis results, three regions of interest (ROI) were defined: the right ventrolateral prefrontal cortex (VLPFC), the supplementary motor area (SMA), and the basal ganglia (BG). Visual input entered a fourth node of the DCM (visual area V3) from which activity was propagated to the motor system. Subject-specific ROI were centred on the subjectspecific local maximum of SPMs testing for “task minus rest” that was nearest to the maxima in the equivalent group SPM (within the same anatomically defined region). For each subject, the principal eigenvariates for all ROI were extracted from a spherical region (radius = 6 mm). In this study, we were primarily interested in the differences in coupling between the two groups. The SPM analysis used to define the ROI therefore focussed on group effects by simply comparing “task” vs. “rest” contrasts (activations) across subjects. The ensuing SPM is shown in Fig. 10 (left panel). In our subsequent DCM analyses, we did
Fig. 9. This figure illustrates the nature of the Go/Stop task, which assesses the capacity to inhibit an initiated response. Five-digit numbers were presented serially. The numbers appear for 500 ms, once every 2 s (500 ms on, 1500 ms off). There are three trial types: go, stop and novel. Participants are told to respond when the number they see is identical to the previous number; this is a go trial. A stop trial consists of a stimulus that matches the one before it but changes from black to red at some interval (50, 150, 250, or 350 ms) after stimulus onset. Participants are instructed to withhold response to a number that turns red. A novel trial presents a non-matching number. Go and stop trials each occur 25% of the time. The remaining 50% are novel trials.
454
B. Li et al. / NeuroImage 58 (2011) 442–457
Fig. 10. This figure summarizes the nodes and architecture of the DCM used for the group study. Left panel: This shows the SPM testing for an effect of motor inhibition over both groups. This is a second (between-subject) level SPM thresholded at p = 0.001 (uncorrected) for display purposes. Right panel: DCM network or graph based on the group analysis (left) and on previous studies of motor inhibition. Three key ROI were defined: the right ventrolateral prefrontal cortex (VLPFC), the supplementary motor area (SMA), and the basal ganglia (BG). Because subjects responded to visual stimuli, the activity within the cortical motor system was assumed to be driven by the visual system. In our model, the visual input entered a fourth node (visual area V3) from which activity was propagated to the motor system.
not model any bilinear or modulatory effects. This means the estimates of connectivity pertain to coupling during the processing of visual stimuli under the task set induced by the Go/Stop task instructions. Fig. 10 (right panel) shows the architecture of the DCM
for this study, with full connectivity among the four regions and visual stimuli driving activity in area V3. Fig. 11 reports the conditional estimates of the parameters of the EM, DEM and GF schemes, respectively, for an exemplar subject. As
Fig. 11. This figure reports the conditional estimates of the parameters under the EM, DEM and GF schemes, respectively, for a single subject. The log precision or hyperparameter estimates from the three schemes, for each area (1–3), are shown on the lower right. The grey bars are the conditional means or expectations, and the red bars correspond to 90% conditional confidence intervals.
B. Li et al. / NeuroImage 58 (2011) 442–457
455
Fig. 12. This figure shows those connections in the control group that were found to be significant across subjects, using one sample t-tests (p b 0.05), applied to the maximum a posteriori (MAP) estimates from each of the three schemes. The numbers denote the group mean connection strengths. Overall, the three schemes yield comparable results; the EM and the DEM schemes providing particularly similar estimates. Compared to EM and DEM, GF detects a significant negative connection from VLPFC to BG, while this connection is not significant in the other two schemes. On the other hand, the connection from BG to V3 is significant in the EM and DEM schemes but not in the GF scheme.
seen in the first section, the parameters are remarkably similar, especially the conditional means of the EM and the DEM schemes. However, the conditional means from the GF schemes are much smaller and more precise than that from the other two schemes. In terms of the estimates of region-specific observation noise (lower right panel), the EM scheme yields much lower precision estimates than the stochastic schemes (because it cannot model endogenous fluctuations in hidden states). Between-subject analyses Fig. 12 shows those connections in the control group that were found to be significant across subjects, using one sample t-tests (p b 0.05), applied to the conditional means or maximum a posteriori (MAP) coupling estimates from each of the three schemes. This between-subject (second-level) analysis can be regarded as a summary statistic approximation to a random effects analysis, where the MAP estimates summarize subject-specific effects. The numbers alongside the arrows denote the mean connection strengths over subjects. Overall, the three schemes yield comparable results; the EM and the DEM schemes provide particularly similar estimates. Generalised filtering detects significant negative coupling from VLPFC to BG while this connection is not significant in the other two (EM and DEM) schemes. On the other hand, the connection from BG to V3 is significant in the EM and DEM schemes but not in the GF scheme. In
the patient group (Fig. 13), the results provided by the EM and the DEM schemes are again highly similar, while two connections (from BG to SMA and between VLPFC and SMA) do not reach significance under the GF scheme. We then compared the connectivity between the control group and the IA group using two-sample t-tests (p b 0.05). The results are shown in Fig. 14. It is apparent that only under the GF scheme significant group differences in the bidirectional connections between BG and VLPFC are detected, while this difference is not found by either EM or DEM schemes. In other words, by relaxing the conditional independence (mean-field) assumptions implicit in variational schemes like DEM, the GF scheme was able to detect two additional connections exhibiting significant group differences. Finally, to assess the impact of the mean-field approximation on the log evidence bound, we compared the (negative) free energy from the DEM and GF schemes over subjects (Fig. 15). In each and every subject, the negative free energy of models inverted under the GF scheme is much higher than when inverted by DEM. In other words, GF provides a much tighter (better) bound on the log evidence than DEM, at least in this example. As noted by our reviewers, this is mandated theoretically by the nature of the free-energy objective function used to optimise the conditional densities: The free energy is the log evidence minus the Kullback–Leibler divergence (difference) between the true and approximating conditional density. The factorisation of the approximate density, under mean-field (conditional independence)
Fig. 13. This figure shows significant connections for the patient group (one sample t-test on MAP estimates across subjects, p b 0.05, from the three different inversion schemes). As in Fig. 12, the results provided by the EM and the DEM schemes are very similar, while two connections (from BG to SMA and between VLPFC and SMA) do not reach significance under the GF scheme.
456
B. Li et al. / NeuroImage 58 (2011) 442–457
Fig. 14. This figure shows differences in connectivity between the control and patient groups, using a two-sample t-test (p b 0.05) on subject-specific MAP estimates. Only the GF scheme provides significant group differences in bidirectional connections between BG and VLPFC. In other words, by relaxing the conditional independence (mean-field) assumptions implicit in variational schemes like DEM, the GF scheme enabled the detection of two additional connections exhibiting significant group differences.
assumptions, means that there will generally be a greater divergence (that reduces the bound), because the true posterior contains conditional dependencies among states, parameters and hyperparameters that DEM cannot model. Summary The comparison of model inversion results under the EM, DEM and GF schemes for the empirical fMRI data set in this section showed that stochastic schemes (DEM, GF) generally resulted in more precise conditional estimates than deterministic (EM) ones. GF yielded numerically smaller estimates than DEM, but the most precise conditional estimates of all the schemes considered. More importantly, the GF scheme showed the highest sensitivity to detecting group differences in connectivity (in terms of classical inference) and provided a much tighter (better) bound on the log evidence than DEM. This anecdotal analysis is not meant to suggest that generalised filtering is superior to DEM in general; it simply serves to show that examples exist where GF can be better. Discussion In this paper we have tried to establish the face and construct validity of generalised filtering and stochastic DCM, when applied to fMRI time
series. We have shown that Bayesian model comparison can recover the underlying level of endogenous fluctuations in hidden states (statenoise). We then went on to show, that in at least one case, relaxing the mean-field assumption implicit in variational schemes like DEM leads to better estimates of effective connectivity. In what follows, we will focus on the fundamental differences between generative models based upon random differential equations (stochastic DCMs) in relation to their deterministic counterparts. The introduction of endogenous activity into a model is potentially risky from the point of view of parameter estimation. This is because, in principle, one can explain observed data completely by endogenous and random fluctuations in the hidden states of each region; even in the absence of coupling among regions. In other words, the inclusion of state-noise will not necessarily improve sensitivity, when one is primarily interested in the underlying parameters that determine distributed responses or functional architecture. On the other hand, models that include endogenous activity are clearly more plausible models (i.e., have higher a priori probability). Our initial experience with these sorts of models made us re-examine some of our preconceptions about the generation of neuronal activity: For example, the results of the stochastic DCM analyses of the attentional data suggest that direct visual stimulation of V1 is less important when compared to the equivalent deterministic model (compare the relative strength of the exogenous coupling parameter, C11 in Fig. 2, where it is about half the size under generalised filtering). This makes perfect sense from a physiological perspective, when one recalls that the number of top-down or backward connections to early visual structures greatly outnumber the forward geniculostriate connections. This means that activity in V1 may be determined, to some extent, by top-down and lateral interactions, whose effective connectivity is modulated by visual information and attentional set. In other words, the recurrent exchange of endogenous activity between regions (that is enabled during specific conditions) may contribute substantially to measured responses. Whether this sort of behaviour is characteristic of stochastic models in general remains to be seen. It does, however, provide an interesting and alternative perspective on how we think about self-organised activity in the brain and the influence of experimental manipulations on endogenous activity (Curto et al., 2009; Nadim et al., 2009; van Dijk et al., 2008). Conclusion
Fig. 15. This figure compares the free energy from the DEM and GF schemes over subjects to assess the impact of the mean-field approximation on the log evidence bound. For each and every subject, the free energy provided by GF is much higher than that by DEM, providing a much tighter (better) bound on log evidence.
In conclusion, we have established initial face and construct validity of stochastic DCM that accommodates random fluctuations in hidden states, such as neuronal activity or hemodynamic states like local perfusion and deoxyhemoglobin content. We performed comparative inversions on two empirical data sets, using a deterministic scheme (EM) as well as stochastic schemes with (DEM) and
B. Li et al. / NeuroImage 58 (2011) 442–457
without (GF) a mean-field approximation. We have seen that modelling endogenous fluctuations of physiological states underlying fMRI data is possible by using DCMs based on random differential equations. Furthermore, we have characterised the nature of the noise in terms of the evidence for models with different prior beliefs about its amplitude and form. Initial face validity was established using simulated data with high (stochastic) and low (deterministic) levels of state-noise. We have seen that veridical parameter estimates can be recovered by generalised filtering, even if deterministic assumptions hold. Finally, we applied the EM, DEM and GF schemes to empirical data acquired from two groups of subjects during performance of a Go/Stop task. We have seen that relaxing the mean-field approximation can be advantageous in that generalised filtering showed higher sensitivity to detecting group differences than alternative schemes. Furthermore, GF provided a tighter bound on the log evidence, compared to the DEM scheme. This paper is a first step towards introducing practical applications of stochastic DCMs. Clearly, many questions for the pragmatic use of stochastic DCM remain open. For example, how do DCMs for different data modalities (e.g., fMRI, EEG, local field potentials) benefit, comparatively speaking, from modelling endogenous fluctuations in neuronal states? Are stochastic DCMs better for certain types of experimental design than for others? Do stochastic DCMs confer robustness to missing neuronal populations? Finally, the opportunity to model endogenous fluctuations means that one can, in principle, identify the functional architectures (effective connectivity) subtending endogenous dynamics observed in resting-state studies (e.g., Damoiseaux and Greicius, 2009): we are currently pursuing this (Friston et al., 2011). Software note The schemes described in this paper are implemented in Matlab code and are available freely as part of the open-source software package SPM8 (http://www.fil.ion.ucl.ac.uk/spm). A DEM toolbox provides several demonstrations of DEM and generalised filtering from a graphical user interface (see spm_DEM.m and spm_LAP.m and ancillary routines). Furthermore, the attentional data set used in this paper can be downloaded from the above website for people who want to reproduce the analyses reported in this paper. Acknowledgments This work was funded by the Wellcome Trust (K.F., W.P.), National Basic Research Program of China (L.B. and D.H. for 2011CB707802), the NEUROCHOICE project by SystemsX.ch (J.D., K.E.S.) and the University Research Priority on “Foundations of Human Social Behaviour” at the University of Zurich (K.E.S.). We are indebted to Marina Anderson for help in preparing this manuscript and our two reviewers for guidance in clarifying and elaborating this report. References Billock, V.A., de Guzman, G.C., Scott Kelso, J.A., 2001. Fractal time and 1/f spectra in dynamic images and human vision. Physica D: Nonlinear Phenomena. 148 (1–2), 136–146. Biswal, B., Yetkin, F.Z., Haughton, V.M., Hyde, J.S., 1995. Functional connectivity in the motor cortex of resting human brain using echo-planar MRI. Magn. Reson. Med. 34 (4), 537–541 Oct. Büchel, C., Friston, K.J., 1997. Modulation of connectivity in visual pathways by attention: cortical interactions evaluated with structural equation modelling and fMRI. Cereb. Cortex 7, 768–778. Büchel, C., Friston, K.J., 1998. Dynamic changes in effective connectivity characterized by variable parameter regression and Kalman filtering. Hum. Brain Mapp. 6, 403–408. Buxton, R.B., Wong, E.C., Frank, L.R., 1998. Dynamics of blood flow and oxygenation changes during brain activation: the Balloon model. Magn. Reson. Med. 39, 855–864.
457
Carbonell, F., Biscay, R., Jimenez, J.C., De la Cruz, H., 2007. Numerical simulation of nonlinear dynamical systems driven by commutative noise. J. Comput. Phys. 226 (2), 1219–1233. Chevrier, A.D., Noseworthy, M.D., Schachar, R., 2007. Dissociation of response inhibition and performance monitoring in the stop signal task using event-related fMRI. Hum. Brain Mapp. 28, 1347–1358. Curto, C., Sakata, S., Marguet, S., Itskov, V., Harris, K.D., 2009. A simple model of cortical dynamics explains variability and state dependence of sensory responses in urethane-anesthetized auditory cortex. J. Neurosci. 29, 10600–10612. Damoiseaux, J.S., Greicius, M.D., 2009. Greater than the sum of its parts: a review of studies combining structural connectivity and resting-state functional connectivity. Brain Struct. Funct. 213 (6), 525–533 Oct. Daunizeau, J., Friston, K.J., Kiebel, S.J., 2009. Variational Bayesian identification and prediction of stochastic nonlinear dynamic causal models. Physica D 238 (21), 2089–2118 Nov 1. Eke, A., Hermán, P., Hajnal, M., 2006. Fractal and noisy CBV dynamics in humans: influence of age and gender. J. Cereb. Blood Flow Metab. 26 (7), 891–898 Jul. Friston, K.J., Büchel, C., Fink, G.R., Morris, J., Rolls, E., Dolan, R.J., 1997. Psychophysiological and modulatory interactions in neuroimaging. Neuroimage 6, 218–229. Friston, K.J., Harrison, L., Penny, W., 2003. Dynamic causal modelling. Neuroimage 19, 1273–1302. Friston, K., Mattout, J., Trujillo-Barreto, N., Ashburner, J., Penny, W., 2007. Variational free energy and the Laplace approximation. Neuroimage 34 (1), 220–234 Jan 1. Friston, K.J., Trujillo-Barreto, N., Daunizeau, J., 2008. DEM: a variational treatment of dynamic systems. Neuroimage 41 (3), 849–885 Jul 1. Friston, K., 2008. Hierarchical models in the brain. PLoS Comput. Biol. 4 (11), e1000211 Nov. Friston, K., Stephan, K.E., Li, B., Daunizeau, J., 2010. Generalised filtering. Math. Probl. Eng. Article ID 621670. Friston, K., Li, B., Daunizeau, J., Stephan, K.E., 2011. Network discovery with DCM. NeuroImage 56 (3), 1202–1221. Garavan, H., Ross, T.J., Stein, E.A., 1999. Right hemispheric dominance of inhibitory control: an event-related functional MRI study. Proc. Natl Acad. Sci. 96, 8301–8306. Harrison, L.M., Penny, W., Friston, K.J., 2003. Multivariate autoregressive modeling of fMRI time series. Neuroimage 19, 1477–1491. Itō, K., 1951. On stochastic differential equations. Mem. Amer. Math. Soc. 4, 1–51. Konishi, S., Nakajima, K., Uchida, I., Kikyo, H., Kameyama, M., Miyashita, Y., 1999. Common inhibitory mechanism in human inferior prefrontal cortex revealed by event-related functional MRI. Brain 122, 981–999. Krüger, G., Glover, G.H., 2001. Physiological noise in oxygenation-sensitive magnetic resonance imaging. Magn. Reson. Med. 46 (4), 631–637 Oct. Liddle, P.F., Kiehl, K.A., Smith, A.M., 2001. Event-related fMRI study of response inhibition. Hum. Brain Mapp. 12, 100–109. Makni, S., Beckmann, C., Smith, S., Woolrich, M., 2008. Bayesian deconvolution of fMRI data using bilinear dynamical systems. Neuroimage 42 (4), 1381–1396. Nadim, F., Brezina, V., Destexhe, A., Linster, C., 2009. State dependence of network output: modeling and experiments. J. Neurosci. 28, 11806–11813. Nalatore, H., Ding, M., Rangarajan, G., 2007. Mitigating the effects of measurement noise on Granger causality. Phys. Rev. E Stat. Nonlin. Soft. Matter. Phys. 75 (3 Pt 1), 031123 Mar. Newbold, P., 1978. Feedback induced by measurement errors. Int. Econ. Rev. 19 (3), 787–791 Oct. Penny, W.D., Stephan, K.E., Mechelli, A., Friston, K.J., 2004. Comparing dynamic causal models. Neuroimage 22, 1157–1172. Penny, W.D., Ghahramani, Z., Friston, K.J., 2005. Bilinear dynamical systems. Phil. Trans. R. Soc. B 360 (1457), 983–993. Riera, J.J., Watanabe, J., Kazuki, I., Naoki, M., Aubert, E., Ozaki, T., Kawashima, R., 2004. A state-space model of the hemodynamic approach: nonlinear filtering of BOLD signals. Neuroimage 21 (2), 547–567 Feb. Sotero, R.C., Trujillo-Barreto, N.J., Jiménez, J.C., Carbonell, F., Rodríguez-Rojas, R., 2009. Identification and comparison of stochastic metabolic/hemodynamic models (sMHM) for the generation of the BOLD signal. J. Comput. Neurosci. 26 (2), 251–269 Apr. Stephan, K.E., Weiskopf, N., Drysdale, P.M., Robinson, P.A., Friston, K.J., 2007. Comparing hemodynamic models with DCM. Neuroimage 38, 387–401. Stephan, K.E., Kasper, L., Harrison, L.M., Daunizeau, J., den Ouden, H.E.M., Breakspear, M., Friston, K.J., 2008. Nonlinear dynamic causal models for fMRI. Neuroimage 42, 649–662. Stratonovich, R.L., 1967. Topics in the theory of random noise. Gordon and Breach Science Pub. Valdes-Sosa, P.A., 2004. Spatio-temporal autoregressive models defined over brain manifolds. Neuroinformatics 2 (2), 239–250. Valdés-Sosa, P.A., Sánchez-Bornot, J.M., Lage-Castellanos, A., Vega-Hernández, M., Bosch-Bayard, J., Melie-García, L., Canales-Rodríguez, E., 2005. Estimating brain functional connectivity with sparse multivariate autoregression. Philos. Trans. R. Soc. Lond. B Biol. Sci. 360 (1457), 969–981 May 29. van Dijk, H., Schoffelen, J.M., Oostenveld, R., Jensen, O., 2008. Prestimulus oscillatory activity in the alpha band predicts visual discrimination ability. J. Neurosci. 28, 1816–1823. Zeki, S., Watson, J.D., Lueck, C.J., Friston, K.J., Kennard, C., Frackowiak, R.S., 1991. A direct demonstration of functional specialization in human visual cortex. J. Neurosci. 11 (3), 641–649 Mar.