Gene Selection via Matrix Factorization Fei Wang State Key Lab of Intelligent Technologies and Systems Department of Automation Tsinghua University
Tao Li School of Computer Science Florida International University Miami, FL 33199, U.S.A.
[email protected]
[email protected]
Abstract The recent development of microarray gene expression techniques have made it possible to offer phenotype classification of many diseases. However, in gene expression data analysis, each sample is represented by quite a large number of genes, and many of them are redundant or insignificant to clarify the disease problem. Therefore, how to efficiently select the most useful genes has been becoming one of the most hot research topics in the gene expression data analysis. In this paper, a novel unsupervised gene selection method is proposed based on matrix factorization, such that the original gene matrix can be optimally reconstructed using those selected genes. To make our algorithm more efficient, we derive a kmeans preclustering approach to accelerate our algorithm, and we also prove theoretically the optimality of this approach. Finally the experimental results on several data sets are presented to show the effectiveness of our method. Keywords. Gene Selection; Matrix Factorization; Kmeans Clustering
1. Introduction The DNA arrays, pioneered in Chee et al. [4] and Fodor et al. [8], are novel technologies that are designed to measure gene expression of tens of thousands of genes in a single experiment. A DNA array reflects the state of the cell with different protein and mRNA compositions. Thus gene expression profiles of samples corresponding to different pathological states of the same tissue provide molecular rather than morphological signature of the malignancy [1][11]. When analyzing those gene expression profiles, an important issue is how to select a small subset of genes that are useful for the classification of the target phenotypes. Typically, there exists much redundancy in the gene expression
data. For example, for a two-way cancer/non-cancer diagnose, usually 50 informative genes are sufficient [11]. From the machine learning perspective, gene selection is just a feature selection problem. It is conventional to categorize the feature selection process into wrapper and filter modes. Wrapper methods contain a well-specified objective function, which should be optimized through the selection procedure. One can often obtain a very small subset of features with relatively high accuracy using the wrapper methods since the usefulness of features is usually directly determined by the estimated accuracy of the learning algorithm [16][20]. Feature filtering is a process of selecting features without referring back to the data classification or any other target function and it ranges from simple methods such as information gain [3], statistical tests (t-test)[11] to more sophisticated methods such as Markov blanket based on conditional independence [15]. However, most of the state-of-the-art gene selection methods are supervised, i.e. they assume the class information of the samples are already known. The unsupervised methods, although which are relatively scarce, are also important to biological data analysis since (1) they are unbiased, since they analyze the data purely based on the data themselves, no prior knowledge from the expert or dataanalyst is necessary [14]; (2) they can reduce the risk of overfitting the data set (e.g. the supervised methods cannot with data of new unknown types[7]). Based on the above considerations, in this paper, we propose a novel unsupervised feature selection algorithm, i.e. our method can select genes without any prior knowledge on the sample class (phenotype) information. Our algorithm is based on the basic assumption that the selected genes should be representative enough, i.e. the data (gene) matrix can be reconstructed from those selected genes with minimum loss. In our algorithm, such loss is measured by the Frobenius norm of the difference between the original and reconstructed gene matrix. We show that the minimization of such loss can be carried out by an iterative matrix updating procedure. Moreover, to make our algorithm scale to
the large number of genes, we derive a kmeans preclustering method to accelerate the algorithm, and we prove theoretically the optimality of such method from the matrix approximation perspective. Finally, experiments on several gene data sets are conducted to show the effectiveness of our method. The rest of this paper is organized as follows. Section 2 introduces our algorithm in detail, and the kmeans preclustering method is introduced in section 3. The experimental results are presented in section 4, followed by the conclusions and discussions in section 5.
2. The Algorithm Basically, the target of gene selection is to select a number of most representative genes. Here representative can be understood from different perspectives, for example, the selected genes should have the maximum mutual information with the data labels [5], or the selected genes should maximize the feature margin as defined in [9]. However, most of these gene selection methods are supervised, i.e., we should know the labels of the data before we run the algorithm. This may make those algorithms impractical since the collection of labelled data is usually expensive and time consuming. Therefore, we propose a novel unsupervised gene selection method in the following. Here we define representative genes as that the whole data matrix can be optimally reconstructed using those genes. Mathematically, assume that we are given N data sample, and X = {xi } denotes the set of N -dimensional gene vectors with 1 6 i 6 M . Our goal is ˜ j ∈ X , 1 6 j 6 K such that the loss to select x °2 XK XM ° ° ° ° ˜j° δij x xi − J = ° ° j=1 i=1
(1)
is minimized, where δij > 0 are the reconstruction coefficients. Written in its matrix form, Eq.(1) can be reexpressed as ° °2 ° ˜ T° J = °X − X∆ (2) ° ,
W of size M × K and rewrite Eq.(3) as ˜ = XW, X
where Wij = wji . Therefore, the optimization problem that we want to solve ultimately becomes minW,V s.t.
˜i = x
XM
j=1
wij xj ,
(3)
where wij ∈ {0, 1}, and for each specific i, there is only one j such that wij = 1. Then we can define a 0-1 matrix
° ° °X − XW∆T °2
F
δij > 0, wij ∈ {0, 1},
(5)
W T 1M = 1 K ,
where 1M ∈ RM ×1 , 1K ∈ RK×1 are column vectors with all their elements equaling to 1. Clearly, from the matrix factorization perspective, the goal our method is just to seek an optimal factorization of the gene matrix X such that (6)
X ≈ XW∆T .
Therefore we call our method a matrix factorization (MF) approach. The problem is that Eq.(5) is a complicated combinatorial optimization problem needs integer programming, which is known to be NP-hard. Hence we will introduce a relaxation scheme in the following to make it solvable.
2.1
Problem Relaxation
A common trick to make the integer programming problem as Eq.(5) solvable is to drop the constraint that wij ∈ {0, 1}, which means that wij can take continuous real values. In our approach, we also apply this trick and further constrain that wij > 0, such that wij can be regarded as the possibility that xj is selected as the i-th representative gene (note that we can also post-normalize the columns of W to make WT 1N = 1K , then Wij can be regarded as the probability of selecting xi as the j-th representative gene). After the relaxation, our optimization problem becomes
F
where X = [x1 , x2 , · · · , xM ] ∈ RN ×M is the feature ma˜ = [˜ ˜ 2, · · · , x ˜ K ] ∈ RN ×K is the selected gene trix, X x1 , x matrix, and ∆ is an M × K nonnegative coefficients matrix with its (i, j)-th entry ∆ij = δij , k · kF is the Frobenius norm of a matrix. To minimize J and solve for the op˜ and ∆, we introduce a set of auxiliary variables timal X ˜ i as {wuv } (1 6 u 6 K, 1 6 v 6 M ) and expand x
(4)
minW,V s.t.
° ° °X − XW∆T °2
F
δij > 0, wij > 0.
(7)
Based on the equality that kAk2F = tr(AT A), where tr(·) denotes the trace of a matrix, we can expand the objective function of Eq.(7) as J
= = =
° ° °X − XW∆T °2 F ³¡ ¢T ¡ ¢´ tr X − XW∆T X − XW∆T ³¡ ¢T ¡ ¢´ tr I − W∆T XT X I − W∆T .
Let K = XT X be the M × M gene similarity matrix, then ³¡ ¢´ ¢T ¡ J = tr I − W∆T K I − W∆T ¢ ¡ = tr K − 2∆WT K + ∆WT KW∆T =
Table 1. Matrix Factorization Gene Selection Input: gene matrix X, number of desired features K, convergence threshold θ. Output: continuous nonnegative matrix W ∗ . 1. Let θold = 104 , θnew = 0, ∆θ = |θnew − θold |; 2. Compute the gene similarity matrix K; 3. Initialize W to be a M × K nonnegative matrix; 4. Initialize ∆ to be a M × K identity matrix; 5. While ∆θ > θ (a). Update W using Eq.(13); (b). Update ∆ using Eq.(14); ° °2 (c). Compute θnew = °X − XW∆T °F ; (d). Compute ∆θ = |θnew − θold |; 4. Output W∗ .
tr(K) − 2tr(WT K∆) + tr(∆WT KW∆T ),
which is a standard quadratic form of ∆ if we fix W, and a standard quadratic form of W if we fix ∆. Therefore, the alternative optimization technique can be adopted to solve for the nonnegative solution that minimizes J . More concretely, we have the following theorem: Theorem 1[13]. Define the standard nonnegative quadratic form as 1 F(x) = xT Ax + bT x, (8) 2 T
where x = (x1 , x2 , · · · , xn ) is a nonnegative n × 1 vector, A is an arbitrary n × n semi-definite positive matrix, T b = (b1 , b2 , · · · , bn ) is an arbitrary n × 1 vector. Let + − A = A − A , where A+ and A− are two symmetric matrix with all their elements nonnegative. Then the solution x that minimizes F(x) can be obtained by the following update rule à ! p −bi + b2i + 4 (A+ x)i (A− x)i , (9) xi ←− xi 2 (A+ x)i where (·)i represents the i-th element of a vector. For a general quadratic expression F(y) which does not take the standard form as shown in Eq.(8), we can solve for its corresponding A and b for updating y by Aij
=
bi
=
∂ 2 F(y) ∂yi ∂yj ¯ ∂F(y) ¯¯ ∂yi ¯y =0
(10) (11)
Based on the above theorem, we can also derive the updating rule of Wij and ∆ij for minimizing J . First let’s decompose the gene similarity matrix as K = K + − K− ,
(12)
where K+ and K− are symmetric matrices with all their elements nonnegative. Then the updating rules of Wij and ∆ij can be derived as [21] (K∆)ij + Wij
←−
Wij (KW)ij +
∆ij
←−
∆ij
q
− (K∆)2ij + 4P+ ij Pij
2P+ ij
q − (KW)2ij + 4Q+ ij Qij 2Q+ ij
(13)
(14)
where P+
=
(15)
K+ W∆T ∆
−
P Q+
= =
K W∆ ∆ ∆WT K+ W
(16) (17)
Q−
=
∆WT K− W
(18)
−
T
Therefore, we can first initialize W and ∆ to some arbitrary nonnegative matrix, and use Eq.(13) and Eq.(14) to update them until convergence. Table 1 summarizes the main procedure of our matrix factorization gene selection algorithm. However, we have the following non-unique solution theorem. Theorem 2. For any W∗ , ∆∗ that is the optimal solution to problem (7), then W∗ R, ∆∗ R are also solutions to that problem, where R is a K × K square matrix subject to Rij > 0, RRT = I. Proof. Clearly, if W∗ and ∆∗ are the solutions to prob∗ lem (7), then Wij > 0, ∆∗ij > 0. Then for any nonnegative matrix R, let W0 = W∗ R, ∆0 = ∆∗ R, we have 0 Wij > 0, ∆ij > 0, which satisfies the nonnegative constraints in problem (7). Furthermore, if RRT = I, then J0
= =
T
T
tr(K) − 2tr(W0 K∆0 ) + tr(∆0 W0 KW0 ∆0T ) tr(K) − 2tr(K∆∗ RRT W∗ T )
+ tr(∆∗ RRT W∗ T KW∗ RRT ∆T )
= =
tr(K) − 2tr(W∗ T K∆∗ ) + tr(∆∗ W∗ T KW∗ ∆∗ T ) J∗ (19)
That is, W∗ R, ∆∗ R are also the optimal solutions to problem (7). ¤. Recalling that the final goal of our method is to find an optimal 0-1 matrix W satisfying the constraints in problem
(5), we need to discretize the continuous W after solving problem (7). In the next section we will introduce an optimal discretization method to achieve this goal.
2.2
Table 2. Discretization Input: continuous nonnegative matrixW ∗ , convergence threshold θ. ˜ Output: discretized 0-1 matrix W. 4 1. Let θold = 10 , θnew = 0, ∆θ = |θnew − θold |; 2. Let ωold = 104 , ωnew = 0, ∆ω = |ωnew − ωold |; 2. Initialize R to be a K × K identity matrix; 3. While ∆θ > θ ˜ ∗ using Eq.(22); (a). Solve W (b). While ∆ω > θ (i). Update R using Eq.(24); ˜ ∗ − W∗ Rk2 ; (ii). Compute ωnew = kW F (iii). Compute ∆ω = |ωnew − ωold |; ˜ − W ∗ R∗ k2 ; (c). Compute θnew = kW F (d). Compute ∆θ = |θnew − θold |; ˜ ∗. 4. Output W
Optimal Discretization
From theorem 2 we can see that the problem of optimal discretization of W∗ (assuming W∗ is the optimal solution to problem (7)) is just to solve the following problem minW,R ˜ s.t.
˜ − W∗ Rk2 ε = kW F
˜ ij ∈ {0, 1}, W ˜ T 1M = 1, W Rij > 0,
(20)
RRT = I
Clearly, this is a bilinear program with two matrix variables ˜ and R), therefore we can also adopt the alternative op(W timization scheme to solve for a local optimum of this problem. ˜ Given a specific R∗ , probStep 1. Fix R = R∗ , solve W. lem (23) becomes minW,R ∗ ˜ s.t.
˜ − W ∗ R∗ k2 ε1 = k W F
˜ ij ∈ {0, 1}, W ˜ T 1M = 1 W
(21)
ˆ = W∗ R∗ , then the optimal solution to problem (21) Let W is just given by E D ¯ uv ˜ ∗ = i = arg max W (22) W ij u
where hei = 1 if e is true, and hei = 0 if e is false.
˜ = W ˜ ∗ , solve R. Given a specific W ˜ ∗, Step 2. Fix W problem (23) becomes minW,R ˜ s.t.
˜ ∗ − W∗ Rk2 ε2 = k W F Rij > 0, RRT = I.
(23)
This problem has been well studied in [6], and the elements in R can be updated by ³ ´ ˜∗ W∗ T W ij ´ Rij ←− Rij ³ (24) T ˜ ∗ T ∗ W W R R ij
It can be easily shown that if we keep on alternating the above two steps, then the loss function ε will decrease ˜ and W∗ R monotonically so that the difference between W will become smaller and smaller. Finally we can get the ˜ ∗ and R∗ when such an alternative procedure optimal W converges. The basic algorithm of discretizing W is summarized in table 2.
3
Acceleration via Kmeans Preclustering
Till now we have introduced our basic algorithm on selecting representative genes. However, in typical microarray data analysis problems each sample is usually represented by a large number of genes, i.e. M is very large. This may cause our algorithm very time consuming (e.g. we need to compute the m × M gene similarity matrix K, M ×K gene significance matrix W) and inefficient in practical problems. In the following, we will introduce a kmeans preclustering method to accelerate our algorithm and we also prove theoretically the optimality of it. As its name suggests, kmeans preclustering approach is just to first clustering the gene set into C clusters {πi }C i=1 using the kmeans algorithm, and then select a representative gene r i for each cluster πi , finally we can apply our matrix factorization algorithm to select K representative genes from R = {r i }C i=1 . Although this approach seems intuitive and heuristic, we can prove the optimality of this approach in the following from the feature similarity matrix approximation perspective. First we will introduce the definition of duplicate data set (DDS). Definition (Duplicate Data Set DDS). Denote the data set as X = {xi }M i=1 , which has been clustered into C clusters , and assume we have constructed a representative {πi }C i=1 r i for cluster πi , (1 6 i 6 C). Then the duplicate data set for X is a just data set with all the data points in the same cluster replaced by the same corresponding cluster representative. Let X¯ be the DDS of the feature set X , and R be the cluster representative set of X , then it would be equivalent to select genes on X¯ and on R, since there are unique genes
of X¯ are the same as the genes in R. Let’s return to our matrix factorization algorithm. The only thing that our algorithm needs to precompute is just the gene similarity matrix K (the matrix W and ∆ is first randomly initialized and then updated successively). Therefore, if we want to select genes from the duplicate data set ¯ then we should select the cluster representatives such X, ¯ constructed that the resultant feature similarity matrix K ¯ on X can have a good approximation to K. Consider the special structure of X¯ , after careful re-ordering (.e.g., the ¯ should data in the same cluster are indexed successively), K have the following form a a a b b ··· c c a a a b b ··· c c ¯ K = a a a b b ··· c c , (25) .. .. . . . . . . . . e e e f f ··· g g
which is block-constant, since the similarities of the data in the same cluster πi are all r Ti r i , (1 6 i 6 C), and the data similarities between cluster πi and πj are all r Ti r j , (1 6 i 6 C, 1 6 j 6 C). Then we have the following theorem.
Theorem 3. Assume the feature set X has already been partitioned into C clusters {π1 , · · · , πC }, then the representative point r i for each πi satisfying ¶ µ 1 X (26) xj , ri = xj ∈πi ni where ni = |πi | is the cardinality of πi , can make η = ¯ − Kk2 minimum. kK F Proof. Since η
= =
¯ − Kk2 = kK F X X p,q
X
i,j
¯ ij )2 (Kij − K
xi ∈πp ,xj ∈πq
(Kij − Spq )2 ,
(27)
where Spq represents the similarity between πp and πq (i.e. r Tp r q ). Then letting ∂J/∂Spq = 0, we can get 1 K xi ∈πp ,xj ∈πq ij np nq µ X ¶T µ X ¶ 1 1 = xi xj xi ∈πp xj ∈πq np nq ³P ´ Since Spq = r Tp r q , then r i = n1i x xj ∈πi j can make J minimum. ¤ Spq
=
X
Theorem 3 tells us that the cluster means are the best representatives from the feature similarity matrix approximation perspective. However, the mean of a gene cluster is just a linear combination of all the genes in that cluster,
which is meaningless in real cases. Therefore, we select the gene in each cluster that is closest to the cluster mean as the representative of that cluster, which is usually referred to as the cluster medoid. Now the only remaining problem is how to partition the data set into clusters. We have the following theorem. ¯ Theorem 4.The optimal partition for minimizing η = kK− Kk2F can be achieved by k-means clustering. Proof. Based on theorem 3, we can expand J = kW − W0 k2F as follows. X X ¯ − Kk2 = (K − Spq )2 J = kK F p,q xi ∈πp ,xj ∈πq ij X X ¢ ¡ T xi xj − cTp cq = p,q xi ∈πp ,xj ∈πq =
kXT X − (XPPT )T (XPPT )k2F ,
where X = [x1 , x2 , · · · , xM ] is the feature matrix, and P is an M × C scaled cluster indication matrix such that √ Pij = 1/ nj if xi ∈ πj , and Pij = 0 otherwise, cp , cq are the cluster means of πp , πq . Using the fact that PT P = I and trace(AT A) = kAk2F , we can derive that ¡ ¢ J = trace (XT X)T XT X − (PT XT XP)T (PT XT XP) .
Therefore, the minimization of J is just equivalent to the maximization of J 0 = trace(PT XT XP). According to the analysis in [19], this criterion is equivalent to the relaxed criterion of kmeans. Therefore kernel k-means is an optimal choice for partitioning the data set in the sense of minimizing J. ¤
Therefore, combining theorem 3 and theorem 4, we can draw the conclusion that kmeans clustering together with the cluster medoids are the optimal choices for constructing the duplicate data set X¯ if we want to select genes from X¯ . As we have discussed before, selecting genes from X¯ is equivalent to select genes from the data set that is composed of the cluster medoids, in such a way the data scale is greatly decreased so that our algorithm can run more efficiently.
4. Experiments In this section we will present the experimental results of our algorithm on several public data sets. First let’s describe the basic information of those data sets.
4.1. The Data Sets • ALL. The ALL data set [18] is a data set that covers six subtypes of acute lymphoblastic leukemia: BCR (15), E2A (27), Hyperdip (64), MLL (20), T (43), and TEL (79), where the numbers in the parentheses are the numbers of samples. The dataset is available at http://www.stjuderesearch.org/data/ALL1/.
Table 3. Data Set Information Data set ALL GCM LYM NCI60 MLL HBC
#Samples 248 198 62 60 72 22
#Genes 12558 16063 4026 1123 12582 3226
#Classes 2 14 3 9 3 3
• GCM. The GCM data set [17] consists of 198 human tumor samples of 15 different types. • LYM. The lymphoma data set is a data set of the three most prevalent adult lymphoid malignancies and available at http://genome-www.stanford.edu/lymphoma. The data set was first studied in [1]. • NCI60. The NCI60 data set was first studied in [12] cDNA microarrays were used to examine the variation in gene expression among the 60 cell lines from the National Center Institutes anticancer drug screen. The dataset spans nine classes and can be downloaded at http://genomewww. stanford.edu/nci60/. • MLL. The MLL-leukemia data set consists of three classes and can be downloaded at http://research.dfci.harvard.edu/korsmeyer/Supp pubs/ Supp Armstrong Main.html. The data set was first studied in [2]. • HBC. The HBC data set consists of 22 hereditary breast cancer samples and was first studied in [10] The dataset has three classes and can be downloaded at http://www.columbia.edu/xy56/project.htm. The basic information of the above data sets are summarized in table 3.
4.2. Experimental Setup In our experiments, all observed genes are normalized to have the zero mean and unit variance. We first select genes from the gene data set, and then split each data set into a training set and a testing set with size 4:1. Then the following two classifiers will be trained on the training set and then classifying the testing data: • Support Vector Machine with RBF kernel (SVM); • Nearest Neighbor classifier (NN).
The splitting of training and testing set for each data set will repeat 100 times independently. Finally the average classification accuracy is used as the performance measures, and
the parameters in SVM are tuned to achieve the highest average classification accuracies. All the experiments are performed on a P4 2 GHz machine with 512M memory running MS Windows. For the feature selection process, besides our matrix factorization approach, we also conduct experiments based on two other methods as following. • Kmeans. We first use kmeans to cluster the gene set into K genes, and then select the cluster medoids as the representative genes of the whole data set. • No feature selection. We directly run SVM on the whole gene data set without gene selection. For our matrix factorization (MF) method, we first use kmeans to cluster the data set into bn/10c clusters (n is the size of the data set, bxc denotes the maximum integer that is not larger than x), and then apply MF to select genes from the cluster medoids.
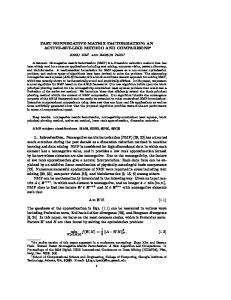
4.3. Experimental Results The experimental results are shown in figure 1 and figure 2. In all the figures, the x-axis represents the number of selected genes, and the y-axis represents the average classification accuracies of 100 independent runs. From those figures we can observe that • Generally using feature selection can produce better results than directly classifying on the original data sets. This is because there exists redundancies and noises in the original data set. • Feature selection using our matrix factorization method can produce better results compared to using kmeans, especially when the number of selected genes is small.
5. Conclusions We propose a novel unsupervised gene selection method in this paper. Based on the minimum data information loss principle, our method is able to select the most representative genes via matrix factorization. Moreover, to make our method scale well to the large gene data set, we also derive a kmeans preclustering method to accelerate our approach and we prove theoretically the optimality of such method from the gene similarity matrix approximation perspective.
References [1] A. A. Alizadeh et al. Distinct Types of Diffuse Large B-Cell Lymphoma Identified by Gene Expression Profiling. Nature, 403, 503-511. 2000.
100 90
60
100
55
98
50 80
96
45 94 40
70
92
35 60 50
MF+SVM kmeans+SVM SVM 20
40
60
80
100
MF+SVM kmeans+SVM SVM
30 25
20
(a) ALL 95
60
90
55
85
50
80
45
75
35
MF+SVM kmeans+SVM SVM 20
40
60
60
80
100
88
20
40
(b) GCM
65
40
40
MF+SVM kmeans+SVM SVM
90
80
100
80
100
(c) LYM 80 70 60 50 MF+SVM kmeans+SVM SVM
70 65
60
20
40
(d) NCI60
60
80
100
MF+SVM kmeans+SVM SVM
40 30
20
40
(e) MLL
60
80
100
(f) HBC
Figure 1. Average classification accuracy results using SVM (%).
90
60
100
85
98
55
80 75
96
50
70
94 45
65 60
MF+NN kmeans+NN NN
55 50
20
40
60
80
100
92
40 35
MF+NN kmeans+NN NN 20
(a) ALL
40
60
80
100
88
20
40
(b) GCM 85
80
50
80
75
80
100
70
75
45
60
(c) LYM
55
65
70 40
60 65
35
55
60 MF+NN kmeans+NN NN
30 25
MF+NN kmeans+NN NN
90
20
40
60
(d) NCI60
80
100
MF+NN kmeans+NN NN
55 50
20
40
60
(e) MLL
80
100
50
MF+NN kmeans+NN NN
45 40
20
40
60
(f) HBC
Figure 2. Average classification accuracy results using NN (%).
80
100
[2] S. A. Armstrong, J. E. Staunton, L. B. Silverman, R. Pieters, M. L. den Boer, M. D. Minden, S. E. Sallan, E. S. Lander, T. R. Golub and S. J. Korsmeyer. MLL Translocations Specify a Distinct Gene Expression Profile That Distinguishes a Unique Leukemia. Nat. Genet., 30, 41-47. 2002. [3] U. Alon et al. Broad Patterns of Gene Expression Revealed by Clustering Analysis of Tumor and Normal Colon Tissues Probed by Oligonucleotide Arrays. Proc. National Acadamic Science, USA, 96, 67456750. 1999. [4] M. Chee, R. Yang, E. Hubbell, A. Berno, X. C. Huang, D. Stern, J. Winkler, D. J. Lockhardt, M. S. Morris and S. P. Fodor. Accessing Genetic Information with HighDensity DNA Arrays. Science, 274, 610-614. 1996. [5] I. Dhillon, S. Mallela, and R. Kumar. A divisive information-theoretic feature clustering algorithm for text classification. Journal of Machine Learning Research, 3:1265-1287, 2003. [6] C. Ding, T. Li, W. Peng, and H. Park. Orthogonal Nonnegative Matrix Tri-factorizations for Clustering. In Proc. of the 12th ACM SIGKDD International Conference on Knowledge Discovery and Data Mining (SIGKDD), Pages 126-135. 2006. [7] C. Ding. Unsupervised Feature Selection via TwoWay Ordering in Gene Expression Analysis. Bioinformatics, v.19, 1259-1266, 2003. [8] S. P. Fodor, J. L. Read, M. C. Pirrung, L. Stryer, A. T. Lu, and D. Solas. Light-Directed, Spatially Addressable Parallel Chemical Synthesis. Science, 251, 767783. 1991. [9] R. Gilad-Bachrach, A. Navot and N. Tishby. Margin based feature selection-theory and algorithms. In Proc. of the 21st International Conference on Machine Learning (ICML), 43-50, 2004. [10] I. Hedenfalk, D. Duggan, Y. Chen, M. Radmacher, M. Bittner, R. Simon, P. Meltzer, B. Gusterson, M. Esteller, O. P. Kallioniemi et al. Gene-Expression Profiles in Hereditary Breast Cancer. N. Engl. J. Med., 344, 539-548. 2001. [11] T. R. Golub, D. K. Slonim, P. Tamayo, C. Huard, M. Gaasenbeek, J. P. Mesirov, H. Coller, M. L. Loh, J. R. Downing, M. A. Caligiuri, C. D. Bloomfield and E. S. Lander. Molecular Classification of Cancer: Class Discovery and Class Prediction by Gene Expression Monitoring. Science, 286, 531-537. 1999.
[12] D. T. Ross, U. Scherf, M. B. Eisen, C. M. Perou, C. Rees, P. Spellman, V. Iyer, S. S. Jeffrey, M. Van de Rijn, M. Waltham et al. Systematic variation in gene expression patterns in human cancer cell lines. Nat. Genet., 24, 227-235. 2000. [13] F. Sha, Y. Lin, L. K. Saul and D. D. Lee. Multiplicative Updates for Nonnegative Quadratic Programming. Neural Computation, to appear. 2007. [14] R. Varshavsky, A. Gottlieb, M. Linial, D. Horn. Novel Unsupervised Feature Filtering of Biological Data. Bioinformatics, Vol. 22, No. 14, pp. e507-e513(1). 2006. [15] E. P. Xing and R. M. Karp. CLIFF: Clustering of Highdimensional Microarray Data via Iterative Feature Filtering Using Normalized cuts. Bioinformatics, 17, 306-315. 2001. [16] M. Xiong, X. Fang and J. Zhao. Biomarker Identification by Feature Wrappers. Genome Res., 11, 18781887. 2001. [17] C. H. Yeang, S. Ramaswamy, P. Tamayo, S. Mukherjee, R. M. Rifkin, M. Angelo, M. Reich, E. Lander, J. Mesirov and T. Golub. Molecular Classification of Multiple Tumor Types. Bioinformatics, 11, 1C7. 2001. [18] E. J. Yeoh, M. E. Ross, S. A. Shurtleff, W. K. Williams, D. Patel, R. Mahrouz, and F. G. Behm. Classification, subtype diswcovery, and prediction of outcome in pediatric lymphoblasitic leukemia by gen expression profiling. Cancer Cell, 1(2):133-143, 2002. [19] H. Zha, C. Ding, M. Gu, X. He and H. Simon. Spectral Relaxation for K-means Clustering. Advances in Neural Information Processing Systems 14 (NIPS), 10571064, Vancouver, Canada. Dec. 2001. [20] H. H. Zhang, J. Ahn, X. Lin, and C. Park. Gene Selection Using Support Vector Machines with NonConvex Penalty. Bioinformatics, 22: 88-95. 2006. [21] W. Xu and Y. Gong. Document Clustering by Concept Factorization. In Proc. of the 27th Annual International ACM SIGIR Conference on Research and Development in Information Retrieval. 202-209. 2004. [22] X. Zhu, Z. Ghahramani, J. Lafferty. Semi-Supervised Learning Using Gaussian Fields and Harmonic Functions. Proc. of the 20th International Conference on Machine Learning (ICML), 912-919. 2003.