From Locality to Continent: A Comment on the Generalization of an Experimental Study
Kenju Kamei1 First version: December, 2010 This version: October, 2011 Abstract
Kocher et al. (2008) …nd that conditional willingness to contribute to a public good is considerably stronger at a U.S. research site, Appalachian State University, than at sites in Europe and Asia. I …nd that the willingness at Brown University, in Rhode Island, is not signi…cantly di¤erent from that in Europe and Asia in Kocher et al. (2008). Clear evidence on signi…cantly di¤erent demographic statistics between these two U.S. research sites is provided. This implies that in the experimental study of societies, or more generally in empirical studies, we need exercise care to generalize from results at a speci…c research site to geographically broader conclusions.
JEL classi…cation: H41, C91 Keywords: cooperation, experiment, public goods, social dilemma
1
E-mail address:
[email protected]. Deloitte Tax LLP. Tel.: 401-499-5491, fax: 401-863-1970. The research reported here was supported by the Danish research council (FSE) for …nancial support under project title “Cooperation and Institutions.”I thank Louis Putterman and Jean-Robert Tyran for allowing me to use data collected in Putterman et al. (2010) and Kamei et al. (2011) for this paper. I also thank the referee and editor whose suggestions helped me to improve the paper substantially.
1
1
Introduction
Recent advances in experimental economics enable us to study more about our society since, using experiments, researchers can observe experimental subjects’ decisions (such as collective choices) in laboratories and can measure individual attitudes and inclinations. Laboratory environments can provide an e¤ective tool not only for creating an environment essentially similar to reality, but also for testing empirically controversial or fundamental research questions by controlling for various factors by random assignment. However, in each study, since experimental subjects are local in the sense that they are from a single university, the subject pool might not be representative of a society or a nation and thus it might be di¢ cult to draw a general conclusion from a result of a speci…c study. This paper provides one example about how the di¤erence in experimental research site generates di¤erent results. Speci…cally, I compare cooperative dispositions, or the conditional willingness to cooperate, between two di¤erent research sites in the United States. One well-known result from numerous public goods experiments over the last twenty years is that some people have a preference toward cooperation. Even when subjects play a public goods game in an experimental laboratory, in which full free-riding is a strictly dominant strategy, they contribute to a public account signi…cantly more than zero percent of the time. As a tool to assess cooperative dispositions, Fischbacher et al. [4] developed a method to measure the conditional willingness of individuals to cooperate, and provided evidence on the existence of heterogenous social preferences in Switzerland. Their classi…cation consists of “conditional cooperator,”“hump-shaped cooperator,” “free rider,”and “other.”By using their method, Kocher et al. [8] studied the distributions of cooperative dispositions in the United States (North Carolina), Austria and Japan.2 Their study concludes that the distribution of cooperative dispositions varies across countries, and that the proportion of conditional cooperators is signi…cantly higher in the United States than in Austria and Japan (Table 2 For other replication studies, see Herrmann and Thöni [5] for a study in Russia, Chaudhuri and Paichayontvijit [1] for a study in New Zealand, and Thöni et al. [10] for a study in Denmark.
2
1). This paper provides a classi…cation result based on the same method for a study conducted at a university located in a di¤erent U.S. state, Rhode Island, and compares it with the result reported by Kocher et al. [8]. The comparison indicates that the proportion of conditional cooperators at the second U.S. site is similar to that in Austria and Japan and is signi…cantly di¤erent from that at Appalachian State University reported by Kocher et al. [8]. This paper also provides clear evidence that both the distribution of races and that of subjects’ home states are signi…cantly di¤erent between the two U.S. research sites. This suggests that the distribution of cooperative dispositions in the United States might di¤er by region. Furthermore, it implies that in an experimental study we need exercise care to generalize from a speci…c subject pool to a culture or a nation since subject’s characteristics might be signi…cantly di¤erent by region.
2
Experimental Results
In the experiment, each subject was randomly assigned to a group of N individuals, was given an endowment of 20 points, and made an unconditional decision on what part of their endowment to contribute. Each subject’s earnings were calculated by:
20
Ci + r
N X
Cj ;
(1)
j=1
where Ci is Subject i0 s contribution to his or her group (public account). Next, they decided the amount they would contribute to the public account conditional on twenty one possible average contribution levels (integers) of other group members. The conditional contribution schedule was payo¤ relevant, and the procedure in which the conditional contribution schedule was used was the same as in Fischbacher et al. [3]. That means, after every subject completed their conditional contribution
3
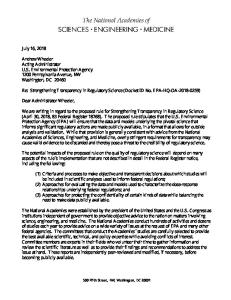
schedule, they moved on to an additional period. In that period, one subject was randomly selected, and the selected subject’s contribution was determined by his conditional contribution schedule and the average of the other members’ …rst-period contributions. As for unselected subjects, their contributions were the same as in their unconditional contribution decisions. The earnings in the additional period were calculated by formula (1) as well. The experiment was programmed in z-tree (Fischbacher, 2007 [2]). The group size was 3 at Kocher et al. [8] whereas it was 5 in the experiment at Brown University. The marginal per-capita return (MPCR), r, equaled 0.6 at Kocher et al. [8]. r equaled 0.3 in the sessions of June and July while it equaled 0.4 in the sessions of October through December in the experiment at Brown University.3 Since r < 1, contributing nothing to the public account is a strictly dominant strategy for each individual in both studies. Table 1 provides the fractions of each cooperative disposition, both for the experiments at Brown University and for Kocher et al. [8]. The fraction of conditional cooperators at Brown University is insigni…cantly di¤erent between the two MPCRs: M P CR = 0:3 or M P CR = 0:4. Figure 1 reports the average conditional contribution schedule by MPCR. Individual-level conditional contribution schedules and classi…cation results are found in on-line Appendix A. Result 1 The fraction of conditional cooperators at Brown University is not signi…cantly di¤ erent between the two conditions: MPCR = 0.3 and MPCR = 0.4. Let me compare cooperative dispositions between the two U.S. research sites. The fraction of conditional cooperators is signi…cantly lower for the Brown University undergraduates than for the Appalachian State University undergraduates whose behaviors are reported by Kocher et al. [8] 3
The experiment at Brown University was conducted at a computer lab in June, July, October, November and December, 2009. In total, 80 undergraduate students participated in sessions in June and July, and 270 undergraduate students participated in the remaining sessions. They were allowed to participate in at most one session. This experiment was conducted as one part of experiments of Putterman et al. [9] and Kamei et al. [7]. The elicitation task that generated the data reported here was included at the onset of the experiments, and thus, the results that I provide in this paper are not contaminated by the subsequent portions of the experiments in these two papers. For the detailed procedures, see instructions included in Appendices of these two papers.
4
(Panel (b), Table 1). This implies that the distributions of cooperative dispositions might vary across sites. The fraction at Brown University is statistically similar to that in Switzerland, Austria and Japan. Result 2 The distribution of cooperative dispositions at Brown University is signi…cantly di¤ erent from that at Appalachian State University reported by Kocher et al. [8]. Result 3 The distribution of cooperative dispositions at Brown University is not signi…cantly di¤ erent from that in Switzerland, Austria, Japan. MPCR and group size are di¤erent between this paper’s result and Kocher et al. [8]. Thus, one might argue that the di¤erence in the share of conditional cooperators is attributable to those di¤erences. However, Result 1 indicates that the fraction of conditional cooperators (the classi…cation method developed by Fischbacher et al. [4]) is robust to the level of MPCRs. Also note that of the fractions of conditional cooperators reported by Kocher et al. [8], only the one for the U.S. (Appalachian State University) di¤ers signi…cantly from the other sites, despite the fact that their Austrian and Japanese subjects also faced an MPCR of 0.6. Furthermore, the group size in our experiment is larger than that in Kocher et al. [8]; when MPCR is small, being in a larger group results in a stronger contribution behavior (Isaac and Walker, 1988 [6]). However, the conditional willingness to contribute to a public good is signi…cantly weaker at Brown University than at Appalachian State University. Where does Result 2 come from? One potential reason is that the observations by Kocher et al. [8] are unrepresentative, resulting from their small sample size, 36 participants. Another potential reason is that the subject pools themselves are di¤erent. Table 2 provides demographic statistics both for Brown University undergraduate students and Appalachian State University undergraduate students. At Appalachian State University, more than 90% of students (excluding non-resident aliens) are from North Carolina. In contrast, at Brown University, students are from various regions; fewer than 5% 5
of undergraduates are from Rhode Island, and only 23 % of undergraduates are from New England (Maine, New Hampshire, Vermont, Massachusetts, Rhode Island, and Connecticut); only around 1% of undergraduates are from North Carolina, and 11.0% of undergraduate students are from South Atlantic (Delaware, Florida, Georgia, Maryland, North Carolina, South Carolina, Virginia, West Virginia, and the District of Columbia). In addition, the proportion of White is signi…cantly higher at Appalachian State University than at Brown University, and thus the distribution of race is also signi…cantly di¤erent at the two universities.4 The large di¤erences in behaviors and in demographic characteristics suggest that researchers should exercise care to generalize from a speci…c university subject pool to a culture or nation.
3
Conclusions
This paper provides evidence that cooperative dispositions might di¤er by region, even in the same country. The fraction of conditional cooperators at Brown University is signi…cantly lower than that at Appalachian State University. Experimental investigations concerning an intra-country comparison on cooperative dispositions are very few. Further intra-country studies, in addition to intercountry comparisons, are desirable. This result has an implication that in the study of society or culture, or more generally, in empirical studies, we need exercise care to draw conclusions from a speci…c experimental study, since subject pools might not be representative of a society or a nation. This suggests that more replication studies might be necessary to construct a conclusion in the study of societies.
4
The proportion of White in the U.S. as a whole is 75.1% (See 2010 United States Census). According to two-sided equality of proportion z-tests, the proportion at Appalachian State University (88.2%) is signi…cantly higher than in the U.S. as a whole (p-value = 0.000), and the proportion at Brown University (46.8%) is signi…cantly lower than in the U.S. as a whole (p-value = 0.000).
6
References [1] A. Chaudhuri, T. Paichayontvijit, Conditional cooperation and voluntary contributions to a public good, Econ. Bull. 3(8) 1-14. [2] U. Fischbacher, z-Tree: Zurich Toolbox for Ready-made Economic Experiments, Exp. Econ. 10(2) 171-178. [3] U. Fischbacher, S. Gächter, Heterogeneous Social Preferences and the Dynamics of Free Riding in Public Good Experiments, Am. Econ. Rev. 100(1) 541-556. [4] U. Fischbacher, S. Gächter, E. Fehr, Are people conditionally cooperative? Evidence from a public goods experiment, Econ. Lett. 71(3) 397-404. [5] B. Herrmann, C. Thöni, Measuring conditional cooperation: a replication study in Russia, Exp. Econ. 12(2009) 87–92. [6] M. Isaac, J. Walker, Group Size E¤ects in Public Goods Provision: The Voluntary Contributions Mechanism, Q. J. Econ. 103(1) 179-199. [7] K. Kamei, L. Putterman, J.-R. Tyran, State or Nature? Formal vs. Informal Sanctioning in the Voluntary Provision of Public Goods. 2009, Unpublished working paper. [8] M. Kocher, T. Cherry, S. Kroll, R. Netzer, M. Sutter, Conditional cooperation on three continents, Econ. Lett. 101(3) 175-178. [9] L. Putterman, J.-R. Tyran, K. Kamei, Public Goods and Voting on Formal Sanction Schemes: An Experiment, J. Pub. Econ. 95(9-10) 1213-1222. [10] C. Thöni, J.-R. Tyran, E. Wengström, Microfoundations of Social Capital. Working paper 09-24, 2009, Department of Economics, University of Copenhagen.
7
Table 1: Classification of Subjects into Cooperative Dispositions (a) Classification Results
(1a) RI 0.3 5
MPCR Group Size (i) Conditional Cooperators (ii) HumpShaped Contributors (iii) Free Riders (iv) Others Total
(1) USA (4a) (4b) (2) Austria (3) Japan (1b) RI (1-2) NC Switzerland Switzerland 0.4 0.6 0.6 0.6 0.4 0.4 5 3 3 3 4 4
(5) Russia 0.4 4
41 (51%)
134 (50%)
29 (81%)
16 (44%)
15 (42%)
22 (50%)
77 (55%)
89 (55.6%)
11 (14%)
38 (14%)
0 (0%)
4 (11%)
4 (11%)
6 (14%)
17 (12%)
10 (6.3%)
24 (30%) 4 (5%) 80
66 (24%) 32 (12%) 270
3 (8.3%) 4 (11%) 36
8 (22%) 8 (22%) 36
13 (36%) 4 (11%) 36
13 (29%) 3 (7%) 44
32 (23%) 14 (10%) 140
12 (7.5%) 49 (30.6%) 160
Article
THIS PAPER
Kocher et al. Kocher et al. (2008) (2008)
Kocher et al. Fischbacher et al. Fischbacher and (2008) (2001) Gächter (2010)
Hermann and Thöni (2009)
(b) Tests of Proportions of Conditional Cooperators
(1a) RI (1a) RI (1b) RI (1-2) NC
-------
(1) USA (2) Austria (3) Japan (1b) RI (1-2) NC .799 -----
.003*** .001*** ---
.498 .559 .002***
.339 .369 .001***
(4a) Switzerland .894 .964 .005***
(4b) Switzerland
(5) Russia
.592 .799 .003***
.521 .229 .006***
Note: Panel (b) reports p-values for two-sided equality of proportion z-tests of proportions of conditional cooperators. *** indicates significance at the .01 level.
Table 2: Brown University Students vs. Appalachian State University Students
(1) Gender
(1) Appalachian State University
(2) Brown University
14,872 7,194 (48%) 7,678 (52%)
6,244 2,950 (47%) 3,294 (53%)
Student Enrollment Male Female
(2) Race#1
Student Enrollment a) Non‐Resident Alien b) Hispanic/Latino c) American Indian or Alaska Native d) Asian e) Black or African American f) Native Hawaiian or Other Pacific Islander g) White h) Mixed i) Other or Race/Ethnity unknown
(1) Appalachian State University
(2) Brown University
14,872 103 (0.7%) 367 (2.5%) 54 (0.4%)
6,244 569 (9.1%) 564 (9.0%) 29 (0.5%)
176 (1.2%) 470 (3.2%) 4 (0.0%)
950 (15.2%) 340 (5.4%) 8 (0.1%)
13,123 (88.2%) 140 (0.9%) 435 (2.9%)
2,923 (46.8%) 143 (2.3%) 718 (11.5%)
(3) The proportion of In-state (Out-of-state) students#2
(1) Appalachian State University
(2) Brown University
13,591 (92%) 1,281 (8%)
352 (5%) 5,892 (95%)
a) In-State students b) Out-of-State students
(4) Brown undergraduate students’ hometown
a) New England#3 b) New York, New Jersey and Pennsylvania c) South Atlantic#4
The number of students
Proportions
1,463
23.4%
1,470
23.5%
686
11.0%
d) Midwestern#5 e) West Coast#6 f) Other#7 Total
498 900 1,227 6,244
8.0% 14.4% 19.7%
Note: Data as of fall 2009. Data was collected from each school’s website. #1 A two-sided equality of proportion z-tests for proportions of white students between two universities indicates that two student populations are significantly different, regarding race (p-value = .000, 2-tailed). #2 Non‐Resident Aliens are counted as Out-of-State students. A two-sided equality of proportion z-test for proportions of students from the State of North Carolina indicates that the two student populations are significantly different, regarding students’ origin (p-value = .000, 2-tailed). 53 students are from North Carolina at Brown University. #3 New England consists of Maine, New Hampshire, Vermont, Massachusetts, Rhode Island, and Connecticut. #4 South Atlantic consists of Delaware, Florida, Georgia, Maryland, North Carolina, South Carolina, Virginia, West Virginia, and the District of Columbia. #5 Midwestern consists of Illinois, Indiana, Iowa, Kansas, Michigan, Minnesota, Missouri, Nebraska, North Dakota, Ohio, South Dakota and Wisconsin. #6 West Coast consists of California, Oregon, Washington, Alaska and Hawaii. #7 Other includes students whose hometowns are unknown.
1 0 0 1 2 3 4 5 6 7 8 9 10 11 12 13 14 15 16 17 18 19 20
20 19 18 17 16 15 14 13 12 11 10 9 8 7 6 5 4 3 2 1 0
Conditional cooperators Free riders Hump-shaped contributors Average
Own contribution
Own contribution
Figure 1: Conditional Contribution Schedule of Brown contributions University students Average other members'
45°
0 1 2 3 4 5 6 7 8 9 10 11 12 13 14 15 16 17 18 19 20
Average other members' contributions
(a) MPCR = 0.3
20 19 18 17 16 15 14 13 12 11 10 9 8 7 6 5 4 3 2 1 0
Conditional cooperators Free riders
Hump-shaped contributors Average
45°
0 1 2 3 4 5 6 7 8 9 10 11 12 13 14 15 16 17 18 19 20
Average other members' contributions
(b) MPCR = 0.4
Note: An supplementary Appendix, providing each individual’s conditional contribution schedule, is available online.