From Baghdad to London The dynamics of urban growth in Europe and the Arab world, 800-1800
“The more numerous and the more abundant the population in a city, the more luxurious is the life of its inhabitants” Ibn Khaldûn (c. 1375)
Maarten Bosker, Eltjo Buringh and Jan Luiten van Zanden Utrecht University/IISH Email:
[email protected] First draft, please do not quote
2
Abstract On the basis of a large (new) dataset of cities in Europe, North Africa and the Middle East in the millennium between 800 and 1800, we try to provide an answer to the question why, during this millennium, the urban center of gravity moved from Iraq (or more generally the Arab world) to Western Europe and the shores of the Atlantic (during the 17th and 18th century) in particular. We study the characteristics of the European and Arab urban systems involved, amongst others focusing on the interaction between cities, and explain why one system was much more dynamic in the long run than the other. Also we assess the importance of various geographical, religious and institutional factors as the driving forces of urban expansion. Overall, we provide a better understanding of the dynamics of urban growth in the centuries leading up to the Industrial Revolution and an answer to the question why London, an economic backwater in 800, was able to overtake Baghdad, in 800 the thriving capital of the Abbasid caliphate, as the largest city in this part of the world.
Introduction Why did the Industrial Revolution begin in North-Western Europe, and not in China, Japan, India or the Middle East? At about 1000, the latter regions – in particular China and the Middle East - were clearly more advanced than Western Europe, which was still a rather backward part of the world economy with low levels of urbanization and income. Understanding why between 1000 and 1800 Western Europe developed from a backwater of the world economy into its most dynamic region, is a major challenge for economists and economic historians. The question is not only academic, as it deals with the preconditions for the genesis ‘modern economic growth’, a process that since the early 19th century has spread to large parts of the world, but not quite to all corners. This paper focuses on the divergence that occurred between the Middle East and Western Europe in the millennium between 800 and 1800. On the basis of a large dataset of cities in Europe, North Africa and the Middle East we will try to understand why in the course of time the urban center of gravity moved from Iraq (or more generally the Middle East) to Western Europe and in particular the shores of the Atlantic (during the 17th and 18th century). We will study the characteristics of the two urban systems involved, amongst others focusing on the interaction between cities, and explain why one system was much more dynamic in the long run than the other. The big question is: why did the urban center of this part of the world move from Baghdad in 800 to London in 1800? One of the key issues is: was it geography or institutions that caused the divergence between the Middle East and the Latin West? Was the relative decline of the Middle East caused by the overseas expansion of Western Europe, which, after Portugal found the ‘direct’ route to India and China, side-tracked the main trading routes which had been the engines of the economies of the Middle East? Or was it the inability of this part of the world to develop more efficient institutions, and was this inability linked to ‘cultural’ and ‘religious’ factors, to Islamic institutions perhaps, as for example Kuran (2003) and Greif (2006) argue? 3
A related debate is about origins of Europe’s dynamic development. Is it the Industrial Revolution of the late 18th century that made de difference between the west and ‘the rest’, as for example has been argued by a number of scholars working on comparative Chinese economic history such as Pomeranz (2000) and Bin Wong (1997)? Or are the roots of Europe’s advance to be sought the gains it made after the Great Discoveries of about 1500, leading to the development of the Atlantic economy (Acemoglu et.al 549-50)? Or should we follow Weber (1922, 1958), or more recently Landes (1998) and Greif (2006), who find the roots of European modernity in the specific institutions that emerged in the Middle Ages. The dataset and the ways of analyzing these data presented here, will allow us to study the genesis of the dynamic development of European urbanization, and to study the interaction between Western Europe and the Arab world – between Christian and Muslim cities for example – contributing to the understanding of the relative influence of institutions and geography on the patterns found.
Theoretical framework Much of the recent work done in this field has concentrated on urbanization as a proxy for economic development, and used data on the number and size of cities and/or the urbanization ratio as indicators of the economic success of regions and countries (Acemoglu et.al. 2005; De Long and Shleifer 1993). Estimates of the size of cities are indeed among the few more or less reliable data available for the pre industrial age, making it possible to chart and analyse long term trends and spatial structures (see De Vries 1984 for a seminal example). Data on city growth are therefore arguably the best starting point of an inquiry into the determinants of economic change in the pre industrial era. Given the scarcity of other data, it is however difficult to explain the trends found in urbanization processes in the pre 1800 period. Recent work has attempted to use certain proxies of the quality or the character of institutions as independent variables. Dummies of the type of state (a Republic or an Absolutist Monarchy) (De Long and Shleifer 1993), or proxies of the strength of constraints on the executive and the degree of protection of ‘capital’ are used to explain growth in terms of the increase of the size of cities and/or the urbanization ratio (Acemoglu et.al. 2005). Our approach differs in that we try to go inside the ‘black box’ or urban growth, and aim at understanding its dynamics in time and space; we will, for example, develop a new method of analyzing the spatial dynamics of the urban system by focusing on the positive (and possible negative) feedbacks between cities. Also, starting from a Weberian typology of urban systems, we try to understand the processes underlying city growth: to what extent where they dependent on longdistance trade? which transport systems (via the sea, roman roads or caravan routes) were crucial and what was their dynamics? The comparison between Western Europe and the Middle East will demonstrate that urban growth as such is not always clearly linked to economic development. We will show that the Islamic world was continually characterized by relatively high levels of urbanization, but the urban system lacked the dynamism characteristic of Western Europe. In order to more fully understand this point, and go inside the ‘black box’ of the urbanization process, we use a typology of cities based on Weber’s distinction between 4
‘producer’ and ‘consumer’ cities. Weber contrasted the ‘industrial’ or ‘producer’ cities of Medieval Europe with the ‘consumer’ cities of Antiquity, a distinction that has been rather fruitful, both for understanding the economic history of Antiquity and that of the Middle Ages (Finley 1985). It has however (as far as we are aware) not been attempted to translate the distinction into measurable variables or testable hypotheses. The classical consumer city is a center of government and military protection (or occupation), which supplies services – administration, protection – in return for taxes and land rent (or more in general: non-market transactions). This kind of city is intimately linked to the state is in embedded in – the flowering of the state, the expansion of its territory and population, will lead to urban growth, in particular of the capital city, which is the consumer city par excellence. Moreover, the most efficient location of such a city is in the middle of the territory it controls; capital cities such as Damascus, Madrid, or Agra/Delhi (the center of the Moghul Empire), Moscow or Beijing, can be considered ideal-typical examples. Closeness to the sea, or to rivers, is not a necessity, as the underlying rationale of such a city is not to exchange goods at relatively low transaction costs. Commercial activity will of course take place – for the feeding of the city and the supply of other consumption goods it has to resort to its surroundings – but this function is secondary, derived from its political and military role. The economic basis of the producer city, on the other hand, is the production and exchange of goods and commercial/marketed services for and with a/ its immediate hinterland and b/ other (producer) cities at a greater distance. Its links with the state are typically much less close, and its fate can to some extent be more or less independent of the political entity it is part of because it has an economic basis of its own. There is clearly no reason to be in the spatial center of this state, in fact, near its borders – profiting from trade flows there - is more likely to be a good location of such a city. Given the importance of access to long-distance markets, the ideal producer city will therefore be either located near the sea or at a navigable river, or at a hub of overland routes. Linked to this typology, Weber speculated about the complex links between state formation and the character of cities. Consumer cities are directly dependent on the state they are part of. For producer cities this is not evident: the interest of the urban (commercial) elite may well diverge from the interests of the state it is part of, and it may well want to organize its own protection and collect its own protection rents. In fact, under certain circumstances a strategy aimed at forming a city-state may well be a more efficient way of creating efficient institutions for regulating exchange than being or becoming part of a large centralized state which has strong incentives to tax its rich inhabitants (eg. the merchants) and may not have equally strong incentives to protect their property rights. But the ability of cities to form their own states will also be dependent on the strength of competing states: when they are large and strong, it may simply be impossible to carry out the city-state strategy. A fragmented state system, as occurred in post-Carolingian Europe, with many relatively weak territorial states competing with each other, may be the right set of circumstances for cities to acquire the independence – the city-state status – which may enhance their development.1
1
There is an obvious link here to the distinction between Republics (which developed out of the city-states of Medieval Europe) and Monarchies used by DeLong and Shleifer 1993.
5
The difference between consumer and producer cities may also express itself in the structure of the urban system. Capital cities are typical consumer cities: when they dominate the urban landscape (as Rome with its million inhabitants dominated Ancient Italy) the degree of ‘consumerism’ of the urban system is probably quite high. Ades and Glaeser (1995) for example demonstrate that high levels of urban concentration are not only linked to low levels of international trade and an inward looking economy (high tariffs), but also to political instability and lack of democracy: ‘Urban giants ultimately stem from the concentration of power in the hands of a small cadre of agents living in the capital. This power allows the leaders to extract wealth out of the hinterland and distribute it in the capital’ (Ades and Glaeser 1995: 224). By contrast, producer cities will probably be part of a more balanced urban system. The positive interactions between producer cities (on which more below) will ideally lead to a dense urban system, whereas consumer cities compete for the same scarce resources – basically taxes and other forms of surplus extraction from the surrounding countryside – and will therefore tend to keep a certain distance from each other. Summing up, by analyzing the location of cities (in particular near the sea), the structure of the urban system (the share of the largest and/or the capital city in total urban population), and the polity they are part of (city-states or republics versus Monarchies) we can find out what kind of forces are driving the urbanization process, whether we are dealing with producer or consumer cities, and therefore whether market forces or nonmarket transactions are behind urban expansion. A second way of linking the structure of the urban system to the underlying institutional framework is via the analysis of the interactions between cities. The idea is that one city is the market for another, and that therefore urban growth is, to some extent, self-reinforcing. The hypothesis is that when institutions governing transactions between cities are efficient and transaction costs are low, the interaction effect between cities will be positive (growth of the surrounding urban system is good for a city’s own development). Conversely, if, as a result of poor institutions transaction costs are high, the growth of one city will not have a big effect on another city because it is very costly to carry out transactions between them. Whereas the locational structure of the cities tell us something about the economic basis underlying them – taxation and other forms of surplus extraction versus market exchange - the effect of developments in other cities on a particular city itself informs us about the efficiency of their interaction: will the growth of one city stimulate urban growth elsewhere?2 Looking at the effect of surrounding cities on growth of a city itself can also answer the question to what extend a group of cities functions as an integrated urban system; if we find a positive (and significant) interaction effect, feedbacks between cities are strong, pointing to the existence of such a system; when instead this interaction coefficient is zero or negative, the cities apparently do not interact to such a degree that one can speak of the existence of such a system. In other words, this approach allows us to find out whether Muslim and Christian cities formed 2
Theoretically agglomeration effects may work the other way around: the growth of a certain city – in particular when it surpasses a certain threshold – may have a negative effect on other cities as it because more attractive to concentrate activities in the metropolis. This may occur independent of the type of city (consumer versus producer). For instance, in 18th century Holland, a typical example of an urban system dominated by producer cities, a process of ‘ internal contraction’ occurred as more and more commercial activity was concentrated in the largest city, Amsterdam (and other cities saw their trading activities shrink relatively) (De Vries 1959; De Vries 1974).
6
one integrated system, of separate sub-systems, and how these evolved in time (when they came into existence as a system, and how strong their interaction was).3 The hypothesis that is central to this paper is that Muslim cities (or cities outside Western Europe) were embedded in different institutional structures and therefore tended to be more like the typical ‘consumer’ city, whereas Christian cities (the cities of the Latin West) were typical producer cities. We can rely on a large but mainly qualitative literature arguing both parts of this hypothesis. Hugh Kennedy for example in a recent contribution argues that the spectacular growth of Muslim cities after the conquest by Islamic forces was mainly the result of the fact that the state decided to pay its military in cash, and rewarded its soldiers with handsome profits from the conquest and from the new taxes it introduced. Big Muslim cities were, in the first place, military encampments, spaces housing large numbers of (retired) military. Because the state managed to pay them in cash, this led to a sudden increase in demand for goods in these areas, which stimulated the growth of a commercialized economy (Kennedy 2002). Accounts of the rise of the Arab economy in the century after the Conquests have however also stressed other factors. The conquests created a large, unified empire characterized by common language (Arabic), common beliefs and institutions; in fact, it can been argued that Islam was a religion of merchants, as Mohammed was himself a merchant (employed by his first wife), and introduced institutions favoring trade and exchange. Similarly, the degree to which cities in Western Europe were really focused on productive activities is also a matter of some debate – both for cities before 1000, when the institutions typical for the Latin West (such as guilds and communes) were simply not there yet, and for the period after 1300, when cities in parts of Western Europe concentrated on exploiting the countryside (see Epstein 1991 and Epstein 2000). By analyzing the various dimensions of the two urban systems, we hope to be able to further test these ideas to better understand the dynamics of urban growth in the centuries leading up to the Industrial Revolution.
Dataset of cities in Europe and the Middle East 800-1800 Where did we find the information for this analysis? The threshold for a city used in this study is 10,000 inhabitants, so we needed data on the numbers of inhabitants in cities housing 10,000 people and more and the total numbers of inhabitants in a country to calculate its percentage of urbanization. We have to realise that in the medieval period a criterion of ten thousand inhabitants to characterize a residential area as a city is a rather hefty one. Towns often had not more than a few thousands, and sometimes only a few hundreds, inhabitants, but it is impossible to trace and quantify the development of these minor towns in the period under review. Therefore, only the really large centres of population qualify our criterion (Ennen 1972, 199). Because of the gradually increasing population and urbanization, the number of cities included in the analysis, which starts from 53 in the year 800, grows continually to 603 cities in 1800 (the total number of cities included in the analysis is somewhat larger because a number of cities only qualified for some of the time periods as their population first rose and then later dropped below the size limit again). 3
How we measure the effect of surrounding cities on a city itself will be extensively discussed in the next section.
7
The population data has been collected for European countries and the Mediterranean area including the Middle East for the years around whole centuries starting in the year 800 and ending in 1800. We excluded the area of the former Soviet Union from our analysis, furthermore using the geographical borders of the countries as they where around 1990 (the same units were used by De Long and Shleifer, 1993 and by Acemoglu et.al., 2005). Apart from population data we also collected administrative information concerning the functions of the various cities. For instance, was it a capital city, was it a bishopric or archbishopric, did it have a university; what is the religious orientation of its inhabitants (or that of the state it is part of: was it predominantly Muslim or Christian)? Additional data were collected concerning the precise geographical location of the different cities the location of previous Roman roads leading to the city and the availability of navigable waterways or of a local seaport. We also discerned a number of larger subsamples of cities: Christian cities versus Muslim cities (the religious component) and cities in the Latin West versus cities in the non-Latin West (the spatial component). These partly overlapping categories were necessary to allow a comparison between on the one hand the geographical locations of cities, which of course do not change over time, and on the other hand the main religious orientation of the inhabitants of a city, which may have changed during this millennium. Especially in the Iberian Peninsula, Italy (Sicily), in the Balkans and Turkey (former Byzantine Empire) and during the crusades the religious affiliation in a number of cities shifted between Muslim and Christian or vice versa (the main source was Jédin et al 1980). The cities categorized as belonging to the Latin West were generally, but not necessarily always, in the sphere of influence of the medieval Roman Catholic Church. In this article the Latin West comprises the larger cities in Scandinavia (Norway, Sweden and Finland), Poland, Germany, Czech Republic, the Low Countries (Belgium, Luxembourg and the Netherlands), France, Great Britain, Ireland, Switzerland, Austria, Italy and those located on the Iberian Peninsula (Portugal and Spain). The non-Latin West comprises the larger cities of the Balkans (Hungary, Slovakia, former Yugoslavia, Albania, Rumania, Bulgaria and Greece), Turkey, and the Middle East (Lebanon, Israel, Jordan, Syria and Iraq) and North Africa (Egypt, Libya, Tunisia, Algeria and Morocco, all above 30 degrees latitude). Population For European cities with 10,000 inhabitants or more we used the dataset published by Bairoch et al (1988). To update it, we scanned recent literature concerning the major cities covered by the dataset, in particular all cities which during some point in time were larger than 60.000 inhabitants. This led to a number of important revisions concerning Cordoba and the other Muslim cities in medieval Spain (estimates were corrected downwards on the basis of Glick (1979)), and Palermo and London in the same period.4 4
Bairoch et.al. (1988) estimates were corrected for a number of extreme outliers, Cordoba (on the basis of Glick 1979) and Palermo (email exchanges with Jeremy Johns and S.R. Epstein); according to Bairoch et.al. Cordoba was supposed to have 450.000 inhabitants at about 1000 (but only 110.000 according to Glick), Palermo’s size was 350.000 according to Bairoch et.al., whereas our estimate (following Epstein and Johns) is 60.000; London was the only city for which estimates were revised upwards following Campbell 2000.
8
For the year 1100 Bairoch’s population data have been linearly interpolated between those of the years 1000 and 1200. The numbers of inhabitants in millions of persons in the different countries for the eleven time periods of our analysis have been derived from McEvedy and Jones (1979) either directly from their figures or by interpolation (when no data was provided). For all cities we also established their different Roman, Arabic, Byzantine, Christian and later local names or synonyms. For the non-European cities in North Africa and in the Middle East and for the cities in Turkey we first established a list of some fifty of the most important ones from Roolvink’s historical atlas (1957) and afterwards used Chandler and Fox (1974) to fill in the population data of these non-European cities as far as was possible. Next we used the old and the new editions of the Encyclopaedia of Islam (EoI) (Houtsma et al., 1993 and Gibb et al. 1975-2005) to find population estimates for the missing dates and places. For the then still missing periods or cities we additionally used the two editions of the EoI , Woodford (1990), Escher and Wirth (1992) and various Baedeker travel guides of the areas to establish more or less hard physical data as the surface area of the specific city in medieval times in hectares from excavations or maps, the numbers of local mosques or the numbers of public hammams in the various cities and time periods in order to use such physical data as an indicator of the otherwise not-available numbers of inhabitants. Generally we used a number of 150 inhabitants per hectare of surface area of a medieval city, except for “garden” cities as Baghdad for which we used a lower number of 75 inhabitants per hectare; 150 is the standard used by other authors (Chandler and Fox 1974), but for Baghdad this leads to population estimates that are too high (also compared with the estimated population of ‘ Iraq’ in that period); we therefore have come to a lower population estimate (half) than the one presented by Chandler and Fox (1974). We additionally used a number of roughly one thousand inhabitants per mosque or public hammam when these entities had to be taken as a basis for the population estimates (this ratio was based on data for other Muslim cities, for which we had estimates of both population size and hammam or mosque). Furthermore we used two accounts made by Arabic travelers in North Africa and the Middle East, that of Al Muqaddasi around the year 1000 (Collins, 1994) and that of Ibn Battuta in the first half of the 14th (Dominique, 1995) to fine tune the various population estimates made above in order to prevent conflicts with contemporary observations made by these two local travellers. Of course with the procedure that we followed we may have missed a number of the cities in North Africa, Turkey and the Middle East, which at some moment during the millennium of our analysis would have qualified for the size criterion, but the same problems apply to some extent also to the data on Europe, especially when considering the pre 1200 period. These possible omissions could seriously affect our results, especially when calculating urbanization ratios. However, we think that we have not missed many cities; moreover, if we missed a city (both in Europe and in the Arab world) this is most likely a small city with no significant political, religious or economic function. Also, most of our results are based on regression analysis, so that, as long as we randomly missed some of the (smallest) cities, we are confident about the conclusion that we draw on the basis of our collected data set.
9
Map 1. Cities in the sample
Map 1 presents an overview of the cities for which estimates have been included in the dataset because they at some point in time between 800 and 1800 have a population larger than 10,000 inhabitants. A few clusters can be distinguished: Italy, which has a clear cluster in the north, but also the south (and in particular Sicily), southern Spain, the Low Countries, and (central) England; smaller clusters can be found in Israel/Lebanon, and Tunisia, both old centers of urbanization predating even the Roman Empire Both the northern and the southern shores in the Mediterranean seem to be favourable locations of cities. Foreign Urban Potential and distances To analyze the importance of interaction effects between cities we follow insights from the economic geography literature (see e.g. Redding and Venables, 2004; Krugman, 1993; Harris, 1954), and construct a measure of each city's so-called 'foreign urban potential' (FUP) and include this variable as one of the explanatory variables in our regressions. The foreign urban potential of city i is defined as the distance weighted sum of the size of all other cities, where we measure distance in terms of relative transport costs. To be precise, we follow De Vries (1984) and calculate a city's foreign urban potential at time t as follows: (1)
n
pop jt
j ≠i
wij Dij
FUPit = ∑
where popjt is the population of city j at time t, Dij is the great-circle distance between city i and city j and wij is a distance weight that we use to take a city’s ease of access, depending on a city’s geographical conditions, into account. Hereby we distinguish 10
between three different modes of transport – via the sea, river or road – and use the estimate of Masschaele (1993) for the differences in relative transport costs, i.e. 1:4:8 (i.e. road transport is 8 times as expensive, and river transport 4 times as expensive as sea transport). This results in the following definition of wij:
(2)
⎧ 0.125 ⎪ 0.25 ⎪ ⎪ 0.375 wij = ⎨ ⎪ 0.75 ⎪0.875 ⎪ ⎩1
if city i and city j located at sea if city i and city j on a river if city i located at sea and city j on a river or vice versa if city i located at sea and city j not at sea nor on a river or vice versa if city i on a river and city j not at sea nor on a river or vice versa if city i and city j not at sea nor on a river
Note that we do not include own city population when calculating FUP. This is different from de Vries (1984) who does include own city population in his measure of urban potential. We do not do this here, because we are interested in the effect of developments in the urban system around a city on the development of the city itself. To be able to calculate the great-circle distance between all pairs of cities, we collected each city coordinates, i.e. its degrees of longitude and latitude, from www.heavens-above.com, a website that provides the coordinates of over 2 million places in the world. Regarding our choice of distance weights, we are well aware that the data of Masschaele apply to the situation around the 14th century, more or less in the middle of our period of analysis. Naturally it is highly unlikely for transport costs to have remained exactly the same over a period of a millennium and we may assume that the various modes of transport will not have all developed equally in this period. For instance Austen (1990, 341) indicates that for caravan transport by camel the relative efficiency has remained rather constant between 850 and 1830. On the other hand we may expect quite some gains in efficiency in transport by sea between 800 and 1800, where technological innovations have played a considerably larger role than in the caravan transport.5 The influence of our choice of measuring the relative transport efficiency will later on be analysed separately, by looking at the robustness of our results when using unweighted distances in the calculation of FUP.
5
See the discussion in Menard (1991), Ballaux and Blonde (2007) and Van Tielhof and Van Zanden (2007); it may well be that in the centuries between 800 and 1300 transport costs declined and that perhaps transport costs overseas went down more than that of other modes of transport, but this cannot be estimated accurately; the Romans already knew however that transport by sea was much cheaper than overland; Diocletian’s famous price edict states that it costs less ‘to ship grain from one end of the Mediterranean to the other than to cart it 75 miles’ (McCormick 2001: 83), which suggests a ratio which is even higher than 1:8 (in fact, of at least 1:13 as the distance from one end of the Mediterranean to another was at least 1000 Roman miles; see ‘travel and distances in the Roman Empire at http://www.csun.edu/~hcfll004/travel2.html); comparing the speed and ton per man ration of camel transport (from Austen 1990) with similar data of medieval road transport (using horse drawn carts) (from Masschaele 1993) suggests that costs of these two modes of transport may have been rather similar: camels were somewhat faster than horses (30 versus 20 miles per day), but had a lower labour productivity (tonnage per man was 0.6 versus 0.8); therefore we did not make a separate category for camel transport.
11
Administrative Data The administrative information (capital city, university, local bishopric, historic membership of the Hanseatic league) has been mainly collected from the Lexikon des Mittelalters (LdM) (Auty, 1980-1999) and for the non-European cities from the two editions of Encyclopedia of Islam. For some medieval empires as the German where there were no natural administrative centers during a large part of their history this leads to the situation that capital cities there only start to develop at the end of the Middle Ages. During the period of our analysis the nation state and with it a capital city comes into being. In the early medieval period for instance Charlemagne did not have a specific capital city and due to the size of his realm his court used to travel from place to place. In medieval kingdoms as France en England the local royals settled down at one specific place, which afterwards developed into an administrative centre and a capital city. The numbers of universities in the various cities and their dates of foundation have been mainly characterized from the ninth edition of the Encyclopaedia Britannica (1898) and Jédin et al (1980). For the Islamic countries the there prevailing and sometimes high numbers of madrasas (e.g. 150 in Damascus in 1500), which by some authors have been classified as universities (Eche, 1967, 150), have not been classified by us as such because the higher education they offered was more comparable to that at a western college than that at a real university (Huff, 2003, 77). In the Arab world, we only classify Baghdad, Fez and Cairo as university cities. Geographical information The geographical information concerning navigable waterways, seaports and the presence of a Roman road or a hub of Roman roads (three or more coming into one city) was collected from Hammond (1981) and Talbert (2000); information on caravan routes from Barraclough (1981), Rostovtzeff (1971) and Roolvink (1957). To determine if a (medieval) city was lying on a Roman road (or within a mile of it), a caravan route or was having a seaport the original location of the city was used as a criterion and not the current sometimes much more extensive surface that a city occupies. Reliability of our dataset As a reliability check of our dataset we first compared our (corrected and expanded) Bairoch dataset with other similar datasets. For Western Europe between 1500 and 1800 we can compare it with Jan de Vries’ compilation of similar estimates; the differences are small: the correlation between his and our dataset ranges from 0.986 (for both 1500 and 1800) to 0.992, showing how close the two datasets are. A similar comparison with the Malanima (1998) dataset of Italian cities in the period 1300-1800 shows somewhat larger differences, but still the correlation is as high as 0.903 (1300), 0.900 (1400), 0.983 (1500), 0.990 (1600), 0.979 (1700) and 0.981 (1800) (note that the fit is somewhat lower for the pre 1500 period, for which in general the data are less good). The very high correlations between our data and the other datasets by De Vries and Malanima enhance our confidence in the data that underlies our paper.6 6
For the non-European data we can compare with the estimates of the share or urbanization in the Ottoman Empire by Sevket Pamuk (unpublished data, kindly made available to us), which are generally higher than our estimates. Similarly, the estimates of the urbanization ratio published by Malanima (1998) for Italy are
12
Second, we used a medieval Catalan world map (Paris, BnF, Esp 30) that describes the world known around 1375, as a touchstone of our database. Grosjean (1977) gives a detailed description of this mapa mundi. His description shows that in 1375 on this map the most important residencies or capital cities have been indicated in red with a flag, the somewhat less important cities were indicated in red too but without a flag while even smaller cities were indicated in black. The average numbers of inhabitants in 1400 in our database is 59,100 for the cities indicated in red with a flag on the Catalan world map, 19,400 inhabitants for the cities only indicated in red and on average a mere 8,700 for the cities with a name in black. Indicative for the situation regarding a capital city in Germany is that none of the German cities has got a flag with it on the Catalan world map of 1375, while for instance the not too distant capital cities of Prague (Bohemia) and Krakow (Poland) were both indicated in red with a flag on this map.
Descriptive statistics Before immediately going into the determinants of the development of the urban system(s) in Europe and the Arab world, we first discuss some descriptive statistics that already reveal several interesting things about the evolution of the size and number of cities in the two regions and about the overall structure of the urban system(s). The different dynamics of the two main regions distinguished here – Western Europe and the Arab world (Middle East/North Africa) – is immediately clear from the tables presented in Appendix A. Table A1 shows that between 800 and 1800 the urban population of Western Europe (and the Balkan) increases more than twentyfold, whereas it is more or less stable in the long term in the Arab world.7 Similarly, Table A4 shows that the number of cities with more than 10,000 inhabitants increases from 30 to 522 in the West, whereas it remains stationary at about 25 in the East. The differences in terms of rates of urbanization (see Table A2) are perhaps equally striking: in Western Europe this ratio increases from 3% to 11% (with jumps in 1000-1200, 1500-1600 and 17001800), in the Arab world it remains stable at about 8%, with only a small increase during the flowering of its economy in the 10th/11th centuries, when it went up to almost 10% (but at that time the region was still more urbanized than Western Europe in 1700!). The Balkan was and remained an area with a relatively low urbanization ratio, increasing from 1% in 800 to 4.5% in 1800 (but the comparison is not completely fair, as Byzantium/Istanbul is here included in the Arab world – including the city in the Balkan would clearly lift its urbanization ratio a lot). Underlying trends in the total population (urban and non-urban combined) are also quite different (see Table A3): the total population of the Arab world increases ‘only’ from 19 to 22 million. In Western Europe, which in 800 has about the same population as the Middle East (22 million), it increases dramatically to 130 million in 1800; already in 1200 the Latin West has a population that is more than double that of higher than those arrived at here, probably because we miss some of the smaller cities just above the 10,000 threshold. 7 This is consistent with the detailed discussion of demographic trends in the Middle East between 800 and 1500 in Ashtor 1976.
13
‘the East’. The Balkan, where the population increased from about 5 million in 800 to almost 25 million in 1800, again follows trends in Western Europe. In all these respects, trends in Western Europe and the Middle East/North Africa are quite different from the 9th/10th century onwards – in fact, it is difficult to find a ‘decisive’ acceleration in either urban or population growth in the estimates about Western Europe. Similarly, the curves for both urban and total population of the Arab world are almost ‘flat’ from the very beginning – as already mentioned, only the years 1000 and 1100 are a bit higher in terms of urbanization ratio. It appears as if the ‘Great Divergence’ between the two regions already began quite early. During the 800-1000 period the urban core of the whole region was in Iraq, where the rate of urbanization was a staggering 20 to 30%; the biggest cities in 800 were Baghdad, Constantinople and Antiochia (Ashtor 1976: 89-91 a discussion of the high level of urbanization in 9th/10th century Iraq). Iraq continues to be the most urbanized region until 1400, when the Low Countries take over this position. The Latin West in this period did not produce the giant cities characteristic of the Middle East, however; after the decline of Baghdad (between 1100 and 1300), Cairo takes over de position as biggest city (during the period 1200-1500), followed after 1500 by Constantinople. In between we witness the flowering or urban centers in Spain (between 1000 and 1200) and Italy (1200-1500). The urban core then moves to the North Sea area, where, in 1800, Great Britain becomes the most densely urbanized country in the world economy – at the end of our period London has become the largest city in the region, a thousand years after Baghdad … Another statistic that provides interesting information about the structure of the urban system is the share of the largest city in the total urban population: a high urban primacy ratio reveals that the urban landscape of a particular country/region is characterized by the presence of one urban giant (see Ades and Glaeser, 1995); the lower the urban primacy ratio, the more balanced the urban system will be. Table A5 shows that again trends in the two parts of Eurasia distinguished here are very different: in Western Europe this share declines from 12% in 800 to 6% in 1000 and 4% in 1200, after which a slight increase begins (6% in 1400, 7% in 1700 and 1800). In the Arab world the trend is downward initially as well, but from a much higher level: 22% in 800, 12% in 1200, after which it jumps up to 24% in 1300, and continues to increase – after 1500 thanks to Istanbul – to 38% in 1700 and 34% in 1800. Again we find large differences in (the development of) the urban structure between the Latin West and the Arab world.
Determinants of city growth in Europe and the Arab world To look for the important factors that drive urban development we estimate the following regression equation: (3)
ln popit = α i + X i' β + X it' γ + ε it
where popit is the population of city i at period t, Xi are city specific variables that do not change over time, Xit are city specific variables that do vary over time and εit is a 14
disturbance term that we allow to exhibit both autocorrelation and heteroscedasticity. Also, in our baseline specifications the αi denote a city-specific random effect that is uncorrelated with the regressors (allowing us to include the time-invariant city-specific variables in the regressions), but in subsequent robustness tests we also allow αi to be a city-specific fixed effect, or include a country-specific fixed effect and/or centuryspecific effects. The estimated coefficients on the included city specific variables, β and γ are our main point of interest. We operationalize the Weberian approach sketched in our theoretical framework by analyzing the relative importance of different factors that in principle could leave their effect on city growth. These factors can grosso modo be classified in three groups: geographic variables unchanging in time (location), specific institutional and religious features of cities that can change over time (being a capital city, an (arch)bishopric, religious orientation, having a university), and our measure of FUP that aims to capture the strength and direction of cities’ interaction. More in detail the different variables are: -
-
their location at the sea (also distinguished in being located at the Atlantic, the Mediterranean or the Baltic or North Sea coast), at a navigable river, at a hub of roman roads, at a roman road, at a caravan route, or at a hub of caravan routes. their status as the seat of a bishop or an archbishop, or the capital of a large territory the presence of a university their religious denomination: dummies have been included for all Muslim cities, and for cities with a predominantly protestant population the ‘foreign urban potential’ measuring the size of the urban market to which they had access (taking into account transport costs), a variable that is split in the ‘foreign urban potential’ of Muslim and of Christian cities8
Table 1 shows our baseline results, which captures the most important underlying forces causing cities to growth. Besides showing the results when considering all cities in the sample, we also show the results when considering four different subsamples. We divide the total sample of cities either according to predominant religion: Christian cities versus Muslim cities; or according to geographic location: the cities in the Latin West (Europe to the west of the line Petersburg-Triest)9 versus cities outside the Latin West. These subsamples overlap to some extent (most cities in the Latin West are Christian and vice versa), but the religious orientation of a city might change (as happened to e.g. Palermo, Cordoba, or even Jerusalem during the Crusades), whereas location obviously is fixed.
8
For each city in the sample we calculate the part of the foreign urban potential that can be ascribed to (nearby and distant) Christian and to (nearby and distant) Muslim cities respectively. 9 This line is well known from the literature on the European Marriage Pattern (see Hajnal 1965) and is probably the best approximation of the historical border of Western Europe/the Latin West; it coincides with the border of the Catholic Church during the Middle Ages.
15
Table 1 The baseline model: explaining city size dependent variable sample:
ln city size all cities
ln city size Christian
ln city size Muslim
ln city size latin west
ln city size non latin west
Sea
0.049 0.474
0.127 0.056
-0.297 0.103
0.139 0.042
-0.228 0.253
River
0.008 0.849
-0.008 0.851
-0.071 0.589
0.022 0.608
-0.160 0.119
Hub
0.074 0.204
0.090 0.101
0.037 0.805
0.112 0.057
-0.064 0.668
roman road
0.026 0.557
0.048 0.255
0.037 0.803
0.043 0.321
0.076 0.575
caravan hub
0.609 0.002
0.900 0.016
0.716 0.003
-
0.639 0.002
Caravan
0.044 0.778
0.113 0.249
0.051 0.802
-
-0.050 0.784
Bishop
0.165 0.000
0.141 0.000
0.206 0.246
0.139 0.000
0.205 0.134
archbishop
0.438 0.000
0.457 0.000
0.339 0.067
0.463 0.000
0.334 0.032
Capital
0.828 0.000
0.812 0.000
0.818 0.000
0.822 0.000
0.832 0.000
University
0.292 0.000
0.287 0.000
0.153 0.545
0.265 0.000
0.400 0.045
Muslim
0.297 0.000
-
-
0.587 0.000
0.090 0.339
Protestant
0.125 0.033
0.080 0.166
-
0.069 0.238
-
0.072 0.116 0.072 0.007
-0.037 0.389 0.151 0.000
0.430 0.001 -0.097 0.180
-0.056 0.234 0.175 0.000
0.348 0.002 -0.157 0.023
FUP Muslim Christian
16
p-value time-dummies p-value random effects nr. observations R2
0.514 0.000 2273 0.414
0.381 0.000 1873 0.384
0.680 0.000 400 0.410
0.416 0.000 1831 0.362
0.498 0.000 442 0.361
Notes: p-values below the coefficients. The standard errors used to calculatethe p-values are corrected for heteroscedasticity and autocorrelation. Bold faced coefficients are significant at the 5% level, and bold faced ànd italic coefficients are significant at the 10% level.
The results of the baseline model shown in Table 1 are quite striking. Theoretically we expect producer cities to profit from having a port and being on a hub or (roman) roads: cities in the Latin West are like this (both coefficients are positive and significant). Cities in the Muslim world are the opposite though: the sea coefficient is strongly negative (and significant), implying that port cities are on average smaller than inland cities; indeed, the really big cities are almost all of them inland: Baghdad, Damascus, Cordoba, Cairo – Istanbul is the exception here, but it became a Muslim city only in 1453. Being on a hub of caravan roads has a strong positive effect; but being on a hub of Roman roads, or at a river, has a negative effect on Muslim cities – in contrast to cities in the Latin West. These differences are related to a number of underlying factors: there appears to be more continuity between the Roman past and the urban system in Western Europe: this is clear from the effect a hub (of roman roads) has on city size, it is also clear from the positive effect of (arch)bishoprics on city size.10 The governance structure of the Catholic Church was rather immobile, and (arch)bishops were almost always seated in towns that had been important urban centers in Roman times. These coefficients therefore tend to confirm the Verhulst-hypothesis that there was a large degree of continuity in the structure of the urban system between the Roman Empire and the Middle Ages (Verhulst 1999). This appears to have been less the case in the Arab world, where the effect of Roman roads and of (arch)bishops was much smaller (and insignificant), and we see a strong influence of caravan roads and hubs. Caravan roads are however not exogenous was location factors (as in a way Roman roads were), but at least to some extent endogenous: one would expect caravan trails, which may have come into existence after the Islamic conquest, to link the big cities that grew up at the same time. Being a capital city has a huge impact on cities in all regions, and it is striking that this impact seems to be almost exactly the same in the Middle East and the Latin West; a coefficient of 0.82 points to an increase of the size of the city by 130% as a result of being the capital of a large state. Furthermore, Muslim cities appear to be on average larger than non-Muslim cities, a factor that is probably linked to the less balanced structure of the urban system that was already noticed before (big cities form a much higher share of the total urban population). But also protestant cities appear to be on average larger than catholic ones, although the effect is much less significant. Perhaps the most remarkable finding concerns the interaction between cities: Muslim cities have a strong positive impact on other Muslim cities, and the effect of Christian cities on each other is also positive and significant, but the interaction across religious borders is consistently negative! In the neighbourhood of (big) Muslim cities, Christian cities are significantly smaller than they would be under other circumstances, and the same, negative interaction effect applies to Muslim cities close to Christian cities! 10
Glick 1979: 23 gives examples of policies by medieval Spanish states and cities to maintain the system of Roman roads.
17
Moreover, this effect is independent of the specification of the FUP-coefficient (as Tables B6b and B6c demonstrate).11 Our interpretation of this is that trade across the borders of religions seems to be a problem – is constrained by high transaction costs – and that Muslim and Christian cities seem to be crowding out each other, perhaps because these border regions are war zones in which cities do not flourish well. The Balkan with its low urbanization ratio – in between two regions with a much higher level of urbanization – is perhaps the best example. One reason for this may be that they had one rule in common: slaves could not be recruited from their ‘own’ population: Christians could not enslave Christians and neither were Muslims allowed to enslave their brethrens in faith. As a result, the demand for slaves had to be satisfied by raiding others, which had negative consequences for people living near the borders of the two religious systems (these slave raids could however extend deep into each other’s territory – the south coast of England even fell a few times victim to them, and the Saracens even reached to Iceland at one occasion).12 When we ignore the religious composition of cities and simply estimate the Foreign Urban Potential irrespective of the religious orientation of cities, the results are quite different: insignificant for Muslim cities (coefficient: 0.129), and still strongly significant for Christian cities (0.164) and for cities in the Latin West (0.184) (see appendix Table B8a). So Muslim cities only profit from the neighborhood of other Muslim cities, and not from Christian cities (in fact, they may be even harmed by them), and vice versa. It is strong evidence that Muslim and Christian cities formed two separate urban systems, which did not really interact with each other (and this interaction, when it occurred, was even negative), but which did indeed interact quite strongly with cities of the same religious denomination.13 It demonstrates that the literature suggesting the importance of religion for the kind of institutions that were used for regulating international trade is probably correct. As mentioned before our baseline estimations only allow for a city-specific random effect that is uncorrelated with the variables of interest. It can be argued that by doing this we are not controlling for unobserved time-invariant city-specific variables that are correlated with some of the variables of interest (an example would be being located in the mountains or being surrounded by a fertile agricultural hinterland). If this were the case, our estimates could be misleading. A complication with allowing for such cityspecific fixed effects is that it would leave us unable to say something about the relevance our variables of interest that are not changing over time (basically all the geographical variables) for cities’ development. Allowing for such city-specific fixed effects can be used however as a robustness check for the results regarding our timevarying variables. Table B1 and B2 in Appendix B, show the results when allowing for 11
When, for example, transport costs per km on all routes are taken as identical, and no correction is made for lower transport costs via the sea, the same pattern emerges, as Table B6b demonstrates; Table B6c shows that when we assume that the relationship between transport costs and distance of not linear but that transport costs vary with the root of distance, we get again very similar results. 12 Davis 2003; the Ottomans for example recruited a large part of their slaves from the Balkans (see Erdem 1996); but see below, Table …., for developments before 1000, when European cities profited very much from the slave trade with the Islamic world. 13 A number of authors also suggest that Arab merchants generally lacked the knowledge to trade with the West (Ashton 1976: 105; Inalcik 1994: 188); but it is also suggested that these information problems were to some extent solved by intermediaries such as Jews and Christian minorities living in the Arab world.
18
such fixed effects using either first-differenced or fixed effects estimation. Except for our results regarding the two bishop variables (that become insignificant14), the main results are qualitatively robust to the inclusion of city-specific fixed effects. A way to keep the city-specific time-invariant variables in the regression would be to include country- instead of city-specific fixed effects (see also Acemoglu, et al. 2005). This only controls for country-specific time-invariant variables, but it does allow the inclusion of our geographical variables in the regressions. The results (that do also control for random city-specific effects) are shown in Table B3 in Appendix B. Comparing them with our baseline estimates in Table 1 shows that mainly the results regarding the geographical variables are somewhat different. The hub and roman road variables are now significant in the Christian and Latin west samples, on the one hand strengthening the notion of the high degree of continuity in the urban system as it was in Roman times, and on the other hand showing the importance of road transportation links in Europe. Location at sea loses its significance, however the results in Table B4 show that once distinguishing between location at the Atlantic, Mediterranean and the Baltic or North sea coast, location at the Atlantic remains positively significant (see also Acemoglu et al., 2005)15. The results regarding the institutional, religious variables and also that on FUP are very similar to our baseline results; the only main difference being that our (city-specific) protestant dummy becomes significant, to some extent (as do the first-differenced estimates in Table B2) the evidence in those theories stressing the positive effect of the protestant spirit on economic development (following another famous Weberian thesis; see Weber 1904). Despite these differences, we will consider the results in Table 1 as our baseline estimates. Given the fact that our country classification is based on the 1990 countryborders, including dummies on the basis of these borders is quite arbitrary. Almost all countries did not exist as these dummies would suggest (sometimes not even at any point during the millennium that we consider), making it hard to conceive of country-specific, time-invariant variables that we are capturing by these country dummies. The fact that our main results are nevertheless robust to (or even strengthened by) the inclusion of such country-specific effects, is however giving additional confidence in our results. Overall, our baseline results provide clear evidence on the important factors that are behind urban development in both Europe and the Arab world. Given the size of our dataset, the next section(s) try to establish whether the found effects of some of the variable may have been of changing importance over the centuries.
14
We think that looking at the within-city-variation only (as when controlling for city-specific fixed effects) leaves us too little variance (a city for example never loses its (arch)bishop status) to identify the effect of these two variables on city size. 15 We come back to this finding in more detail in the next section.
19
The importance of geographical, institutional and religious factors over the centuries How do the locational factors change in time? Does location at sea have a consistent positive effect, or maybe even increasingly so, on city growth – and do different seas (the Atlantic, the Baltic and the Mediterranean) have similar effects (see Acemoglu et al., 2005 and also our results in Table B4)? Does the importance of being a capital city, or archbishopric for urban development change over time? Given the evidence provided by our baseline results that different variables are related to urban development in Europe and the Arab world, we focus on each of these regions seperately in this section (again making the distinction between the two on the basis of either geographical or religious boundaries). Both in case of Europe and the Arab world, we limit the presentation of results to regressions that show time trends that are significant/interesting from a theoretical point of view16. First the results when focusing on Europe, i.e. our Latin West and Christian samples. As can be seen in Table 2a and 2b, allowing the effect of some of the variables to be century-specific leads to a number of new insights into the dynamics of urban growth. Being located at the Atlantic was not an asset before 1300; in fact, during the 9th and 10th century the Atlantic effect is negative, exactly in the years that the Vikings were a constant threat to cities in North West Europe, and some bishoprics (such as Utrecht) were even relocated inland in order to cope with this (Weiler 2003). This changes from 1500 onwards, exactly in the period of the Great Discoveries when trade over the Atlantic is booming; for the 1600-1800 period we find the same strong positive correlation between being an Atlantic seaport and urban growth identified by Acemoglu et.al. (2005). The Baltic-sea dummy tells another story: here trade boomed during the period of the Hansa (1300-1500), but after 1500 this trade was increasingly dominated by Dutch merchants and ships (and its size became less significant in terms of the overall expansion of international trade), leading to a decline of the coefficient. Being on the shores of the Mediterranean had a strong positive effect on Christian cities, especially during the Middle Ages (900-1200), but not, during the same period, on non-Christian cities; the positive effect of being on the Mediterranean returned in the early modern period (remarkably, it was not significant in 1300 and 1400, at the height of the flowering of the Italian economy, perhaps as a result of the impact of large ‘industrial’ cities such as Florence and Milan). But in contrast to the Muslim world, where the ‘sea’ variable is consistently negative, in Western Europe from about 1000 onwards being close to the sea is a big bonus (when the three seas are lumped together, the sea variable for Christian cities is always positive, and significant from 1000 onwards). This different relationship with the sea is a fundamental difference between the two urban systems. Another important result of looking at these time trends is the change in the coefficient of the capital city: it is quite high in 800 (when Continental Europe was united in the Carolingian Empire), collapses between 800 and 1000 (when Western Europe underwent a process of political fragmentation), and afterwards slowly increased to a level which was even higher than in 800, thereby reflecting the process of state formation 16
Results regarding the insignificance of the century-specific impact of other variables are available upon request.
20
that began at about 1000 and resulted in the formation of new and strong territorial states afterwards (Tilly 1990). Whereas the capital variable declines strongly between 800 and 1000, the coefficient of the archbishopric becomes positive and significant in the same period, after some delay also followed by the bishoprics. This is evidence for the hypothesis that, after the desintegration of the Carolingian Empire in the 9th and 10th centuries, the Church to some extend stepped in and formed an alternative power structure stabilizing social-political relationships during the High Middle Ages (an hypothesis formulated by a.o. Berman 1983 and Mann 1986; see also Van Zanden 2007). During the rest of the period being a bishopric or an archbishopric strongly increases the size of the city, which is an indication of the continuing power of the Catholic Church.17 Table 2a dep. variable sample: year 800 900 1000 1100 1200 1300 1400 1500 1600 1700 1800
ln city size Christian Atlantic -0.582 -0.132 -0.051 -0.070 0.068 0.458 0.213 0.303 0.424 0.473
Mediterranean 0.133 0.658 0.454 0.355 0.254 0.143 0.136 0.284 0.128 0.306 0.321
Baltic 0.240 0.239 -0.101 0.365 0.117 -0.059
hub 0.282 -0.014 0.111 0.268 0.153 0.066 0.057 0.172 0.168 0.127 0.081
coefficient p-value
river 0.058 0.163
roman road 0.054 0.198
caravan 0.071 0.541
caravan hub 0.984 0.014
year 800 900 1000 1100 1200 1300 1400 1500 1600 1700 1800
bishop -0.107 -0.106 -0.142 -0.054 0.076 0.213 0.133 0.057 0.105 0.134 0.208
archbishop -0.055 0.149 0.273 0.094 0.262 0.379 0.232 0.411 0.491 0.473 0.594
capital 1.302 0.553 0.319 0.542 0.514 0.693 0.633 0.598 1.005 1.328 1.517
Muslim -
university 0.214 0.000
FUP Muslim -0.066 0.190
FUP Christian 0.036 0.277
protestant 0.110 0.064
coefficient p-value 17
In a future paper we hope to elaborate on this, also by analyzing the differences between protestant and catholic cities in the post1517 period.
21
p-value time-dummies p-value random effects
0.352 0.000
nr. observations R2
1873 0.436
Notes: p-values below the coefficients. The standard errors used to calculate the p-values are corrected for heteroscedasticity and autocorrelation. Bold faced coefficients are significant at the 5% level, and bold faced ànd italic coefficients are significant at the 10% level.
Table 2b dep. variable sample: year 800 900 1000 1100 1200 1300 1400 1500 1600 1700 1800
ln city size latin west Atlantic 0.130 -0.275 -0.021 0.076 0.082 0.102 0.536 0.300 0.363 0.466 0.483
Mediterranean 0.109 0.029 0.267 0.220 0.217 0.088 0.254 0.378 0.187 0.388 0.378
Baltic 0.286 0.347 -0.011 0.473 0.210 -0.013
hub 0.481 0.225 0.276 0.159 0.139 0.100 0.104 0.163 0.161 0.133 0.063
coefficient p-value
river 0.092 0.044
roman road 0.050 0.279
caravan -
caravan hub -
year 800 900 1000 1100 1200 1300 1400 1500 1600 1700 1800
bishop -0.068 0.066 -0.188 0.140 0.112 0.193 0.115 0.086 0.128 0.150 0.206
archbishop -0.146 0.141 0.205 0.364 0.291 0.369 0.230 0.440 0.495 0.466 0.578
capital 0.977 0.271 0.305 0.489 0.548 0.822 0.684 0.573 1.029 1.366 1.536
Muslim 0.306 0.494 0.718 0.598 0.514 1.037 0.955 -0.559 -1.412 -
university 0.212 0.001
FUP Muslim -0.129 0.032
FUP Christian 0.089 0.009
protestant 0.074 0.236
coefficient p-value
p-value time-dummies p-value random effects
0.276 0.000
nr. observations R2
1831 0.429
Notes: p-values below the coefficients. The standard errors used to calculatethe p-values are corrected for heteroscedasticity and autocorrelation. Bold faced coefficients are significant at the 5% level, and bold faced ànd italic coefficients are significant at the 10% level.
22
If we differentiate the locational factors in time for the Muslim/non Latin West cities, we broadly get confirmation of previous results. From the very beginning (800) being a caravan hub has a very big impact on the size of cities (or alternatively: all big cities are caravan hubs), whereas the effect of Roman roads is even negative initially. The other effect that dominates here is the capital dummy: its size is constantly very large during the flowering of the Umayyad and Abbasid Caliphates (661-1258), declined strongly with the gradual fragmentation of the latter state in the 12th/13th century, and returned to previous high level with the rise of Istanbul as the new urban center of the Middle East after 1453. Sea and river variables are consistently non-significant and often negative, indicating that sea trade did not become an important source of economic growth in the millennium after 800. Table 3a dep. variable sample: year 800 900 1000 1100 1200 1300 1400 1500 1600 1700 1800
ln city size Muslim roman road -0.313 -0.329 -0.076 -0.028 0.100 0.249 0.180 0.138 0.315 0.335 0.372
caravan hub 0.737 0.702 0.499 0.575 0.687 0.633 0.488 0.506 0.591 0.602 0.533
capital 0.927 1.128 1.075 0.507 0.530 0.851 0.769 0.962 0.905 0.888 1.059
coefficient p-value
Sea -0.032 0.873
river 0.000 1.000
hub 0.007 0.966
coefficient p-value
bishop 0.278 0.081
archbishop 0.360 0.054
university 0.367 0.076
FUP Muslim 0.355 0.024
FUP Christian
coefficient p-value
p-value time-dummies p-value random effects
caravan 0.031 0.150
-0.267 0.014 0.423 0.000
nr. observations R2
400 0.457
Notes: p-values below the coefficients. The standard errors used to calculatethe p-values are corrected for heteroscedasticity and autocorrelation. Bold faced coefficients are significant at the 5% level, and bold faced ànd italic coefficients are significant at the 10% level.
23
Table 3b dep. variable sample: year 800 900 1000 1100 1200 1300 1400 1500 1600 1700 1800
ln city size non latin west roman road -0.427 -0.210 -0.075 -0.175 0.098 0.192 0.034 0.238 0.478 0.590 0.274
caravan hub 0.382 0.386 0.508 0.512 0.530 0.577 0.492 0.512 0.563 0.600 0.542
capital 1.237 1.340 1.018 0.615 0.589 0.662 0.697 0.942 1.092 1.136 1.060
Muslim 0.262 0.013 -0.010 0.047 0.096 -0.006 -0.035 -0.135 -0.147 -0.228 0.115
coefficient p-value
Sea 0.031 0.896
river -0.107 0.295
hub -0.116 0.466
caravan -0.023 -0.110
coefficient p-value
bishop 0.327 0.006
archbishop 0.469 0.002
university 0.563 0.000
FUP Muslim 0.279 0.038
FUP Christian
coefficient p-value
p-value time-dummies p-value random effects
-0.312 0.000 0.130 0.000
nr. observations R2
442 0.548
Notes: p-values below the coefficients. The standard errors used to calculatethe p-values are corrected for heteroscedasticity and autocorrelation. Bold faced coefficients are significant at the 5% level, and bold faced ànd italic coefficients are significant at the 10% level.
Focus on Foreign Urban Potential One of the most interesting findings in our baseline results are those regarding the interaction of cities; in particular the finding of a positive interaction effect between cities of the same religious denomination and a nonsignificant or even negative interaction effect between cities whose population belong to different religions. This section provides some robustness checks of this finding, and also looks for evidence regarding the evolution of the importance (and direction) of cities’ interaction over the centuries. First one may be concerned that the transport costs weights, see (2), that we use to weight bilateral distances between cities are the main drivers of our results. To check for this we also calculated (the Muslim and Christian) version of FUP using unweighted distances (i.e. taking wij = 1 for all i and j when calculating FUP as in (1)). The results when including this unweighted FUP measure are shown in Table B8b in Appendix B. 24
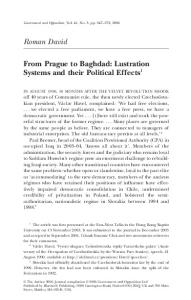
They clearly show that it is not the case that the significance of the FUP variable in our baseline results is due to the weighting scheme that we use. The results in Table B8b are again vary similar to those presented in Table 1, confirming the notion of a positive interaction between cities adhering to the same religion, and insignificant or even negative between cities of different religious denomination. Also note that the effect of including unweighted instead of weighted FUP is to increase the size and significance of both the sea and river variable (in case of Latin West and Christian cities only), exactly those variables on which we base the weights when calculating FUP in (1), see (2). Next, we check whether the split of FUP in Muslim and Christian FUP is driving our results. Table B8a in Appendix B shows that when considering total FUP instead, this variable is only significant in the Christian and Latin West sample. Figure 2, showing the average Muslim and Christian FUP for both a Christian and a Muslim city, provides some rationale for this finding.
Figure 2. Average Christian and Muslim FUP for Christian and Muslim cities
0
1
2
3
4
FUP
800
1000
1200
1400
1600
1800
year muslim FUP - muslim muslim FUP - christian
christian FUP - christian christian FUP - muslim
Notes: The figure depicts the natural logarithm of each of the FUP, i.e. ln(FUP). Muslim FUP – Muslim denotes the average Muslim FUP for a Muslim city, and similarly for the other FUP categories shown.
It shows that the contribution of Christian cities to total FUP is for most part of the sample larger than that of Muslim cities. When considering total FUP in case of both the Muslim and the non Latin-West sample, this results into the insignificance of total FUP, only when considering the variation in Muslim FUP separately (so that it does not get ‘swamped’ by Christian FUP) does its significance show up (see Table 1). The results on the other variables are almost exactly the same as those in our baseline estimates, with again the sea-variable being the exception. It is no longer significant; however as when 25
including country dummies, this insignificance again disappears when distinguishing between cities on the Atlantic, Mediterranean and Baltic or Northsea coast.18 The development of the various FUP variants shown in Figure 2 do also by themselves give interesting information. It clearly shows the steady rise of the importance of the European urban system over the millennium we consider (the only drop in the Christian FUP between 1300 and 1400 is the result of the Black Death that swept through Europe after 1347). It also shows the cycle of the urban system in the Arab world: its (increasing) strength at the beginning of our sample period, after its zenith in the 11th and 12th century followed by a decline as a result of the political fragmentation of the Umayyad and Abbasid caliphates during the 14th – 16th centuries, and a renewed increase with the rise of the Ottoman Empire. To see if we can also find evidence on a possibly strengthening or weakening of cities’ interaction over the centuries, we also allowed the different FUP variables to have a century specific and thus possibly changing effect over time. The results, shown in Table 4 suggest a number of important changes in the institutional structure of the urban system of Western Europe. Table 4: Time specific Foreign Urban Potential dependent variable sample: Sea
ln city size ln city size ln city size ln city size all cities Christian Muslim latin west 0.234 -0.458 0.209 0.116 0.013 0.043 0.038 0.203
ln city size non latin west -0.139 0.613
River
0.027 0.581
0.038 0.455
-0.145 0.316
0.049 0.386
-0.129 0.241
Hub
0.086 0.155
0.098 0.083
0.077 0.631
0.123 0.047
-0.040 0.808
roman road
0.030 0.532
0.054 0.210
0.042 0.786
0.049 0.302
0.120 0.365
caravan hub
0.576 0.004
0.807 0.021
0.710 0.005
-
0.581 0.007
Caravan
0.026 0.874
0.159 0.207
0.051 0.810
-
-0.095 0.655
Bishop
0.190 0.000
0.144 0.000
0.200 0.267
0.139 0.001
0.239 0.045
Archbishop
0.459 0.000
0.455 0.000
0.368 0.054
0.446 0.000
0.366 0.024
Capital
0.861 0.000
0.836 0.000
0.819 0.000
0.867 0.000
0.860 0.000
University
0.279 0.000
0.276 0.000
0.167 0.521
0.248 0.000
0.482 0.009
18
Results available upon request.
26
Muslim foreign urban potential Muslim 800 900 1000 1100 1200 1300 1400 1500 1600 1700 1800 Christian 800 900 1000 1100 1200 1300 1400 1500 1600 1700 1800 Protestant
p-value time-dummies p-value random effects nr. observations R2
0.266 0.001
-
-
0.643 0.000
0.123 0.245
0.412 0.264 0.300 0.114 0.071 0.009 0.000 -0.078 0.031 0.055 0.002
0.087 0.044 0.114 -0.132 -0.181 -0.147 -0.184 -0.208 -0.074 -0.017 -0.029
0.777 0.597 0.598 0.625 0.444 0.675 0.621 0.211 0.195 0.311 0.384
-0.057 -0.199 0.025 -0.152 -0.236 -0.139 -0.096 -0.239 -0.123 -0.016 -0.019
0.496 0.392 0.447 0.398 0.375 0.289 0.422 0.107 0.029 0.243 0.260
-0.114 -0.198 -0.158 0.001 0.044 0.078 0.054 0.079 0.057 0.058 0.076
-0.047 -0.065 -0.086 0.089 0.097 0.107 0.093 0.108 0.095 0.090 0.095
0.092 -0.170 -0.081 -0.190 0.100 -0.055 -0.102 0.170 0.188 0.072 -0.001
0.182 0.090 0.021 0.184 0.173 0.157 0.141 0.169 0.152 0.131 0.127
-0.342 -0.324 -0.281 -0.341 -0.169 -0.107 -0.350 -0.064 0.076 -0.101 -0.133
0.107 0.083
0.088 0.157
-
0.079 0.207
-
0.000 2273 0.430
0.000 1873 0.389
0.000 400 0.422
0.000 1831 0.372
0.000 442 0.518
Notes: p-values below the coefficients. The standard errors used to calculatethe p-values are corrected for heteroscedasticity and autocorrelation. Bold faced coefficients are significant at the 5% level, and bold faced ànd italic coefficients are significant at the 10% level.
The century specific FUP coefficients in Table 3 show that the patterns found for the period as a whole – positive feedbacks between Christian cities and between Muslims cities but negative feedbacks over the border of religions – do not appear to be in place before 1100. The sign of the coefficient measuring the effect of Muslim cities on Christian cities is even positive (but not significant) between 800 and 1000, which may indicate that in that period Christian cities did profit from the booming economy of the Muslim world19 and that typically ‘Christian’ norms and institutions only became more 19
See McCormick 2001: before 1000, cities in the Latin West profited from the exports of large numbers of slaves to the booming cities of the Arabic world, which were mainly taken from the population of nonChristian ‘Slavs’ in central and eastern Europe; their adoption of Christianity and the greater influence of
27
important as a barrier to trade with the Islamic world after 1000.20 Similarly, also the coefficient measuring the interacting between Christian cities (within the Latin West) only becomes positive (and significant) after 1000, suggesting that these cities did not form a coherent system before 1100, and that the real breakthrough towards such a system occurred in the High Middle Ages. This all is consistent with the view that the institutions typical for the Latin West (such as the merchant guilds and the communes) emerged in the High Middle Ages – between 900 and 1200 – as is suggested by Weber and others in his footsteps (a summary of the debate in Van Zanden 2007). In other words, before 1000 city growth in Western Europe was more or less dependent on stimuli from outside the region – from the Arabic world – but between 1000 and 1300 an integrated urban system emerged with strong feedbacks between cities of the Latin West. At the same time, the coefficients of the FUP between Muslim cities shows a somewhat declining tendency during the Middle Ages; 1500 seems to be a break here, which may be related to the capture of Constantinople in 1453, which drastically changed the structure of the urban system. The alternative interpretation would be that the Great Discoveries and the sidetracking of the Middle East already in 1500 has strong effects on the urban system, leading to a loss of coherence resulting in a sudden decline of the FUP coefficient, but this would be in conflict with the established view that only after 1600 the effects of the rounding of Africa were really felt in the Mediterranean (Inalcik 1994: 319360). Comparing the estimated coefficient on the interaction between Muslim cities with that between Christian cities also shows some interesting things. The size of the Christian FUP coefficient is (if significant) usually lower than the size of the MuslimMuslim interaction coefficient (if significant). This does not immediately show that the effect of a 1% population increase in a Muslim city will always have a larger effect on another Muslim city, compared to the effect of a 1% population increase in a Christian city on another Christian city21. Instead, the interpretation of the coefficient on a FUP variable is somewhat more nuanced: as explained in Appendix B, it is also affected by the density of the urban system (which was much higher in the Latin West), and by the appearance of new cities (which ocurred more often in Western Europe than in the Arab world).
Country specific institutional variables Besides focusing on city-specific variables affecting urban development as we have done up to now, two influential papers in the literature (DeLong and Shleifer (1993) and the Catholic Church in the period after 1000 imposing the ban on enslaving other Christians meant that this trade dried up after 1100 (McCormick 2001: 752-777). 20 Glick 1979: 21 argues that the ‘identity’ of Christendom emerged as a result of its confrontation with the Islam: ‘Indeed medieval people tended to think of culture and religion as coextensive or coterminus categories, and therefore of a unified Christianitas in opposition to Islam. In reaction to the Islamic conquests, impinging upon the European heartland from two directions, there emerged the notion of Europe as a geographical entity which was also the seat of Christianity’ 21 In this paragraph we focus on the interaction between Christian and Muslim cities, it also applies to the results when looking at our Latin West and non-Latin West samples.
28
Acemoglu et.al. (2005)) suggest that city growth is to a large degree caused by the institutional environment of the countries cities are part of. On the basis of various indicators that they have constructed for the quality of these institutions, these two papers show o.a. that the better a country's institutions, the higher the urbanization rate in such a country. In this section we study whether these country specific institutional variables help to understand the dynamics of the urban systems in Western Europe and the Arab world. In order to do that, we extended the DeLong and Shleifer classification to also cover Western Europe between 800 and 1300 (their classification begins in 1300). Between 1100 and 1500 Western European countries were almost always classified as ‘free’ feudal states (that is, states with more or less autonomous cities and with institutions for consultation and negotiations such as estates or parliaments); the literature suggests that these feudal socio-political structure emerged in the 10th/12th centuries (we choose the year 1100 as the break point (a review in Van Zanden 2007). Although there is some discussion on the emergence of feudal institutions in the Arab world as well, their character is so different – and they in particular lack the dimension of fragmented sovereignty that is characteristic for the Latin West in the Middle Ages - that we assume that the Arab world was continually ‘unfree’ in the meaning of DeLong and Shleifer (1993) (see the discussions in Ashort 1976 and Inalcik 1994). After 1500 only two ‘free’ states remain: the Dutch Republic and (after 1688) England; the rest of Western Europe then consists of unfree ‘monarchies’ (see De Long and Shleifer 1993). Two set of dummies were entered in the baseline model representing 1/ before 1500 ‘feudal’ sociopolitical institutions, and 2/ after 1500: the two Republics.22 Table 5 shows that the ‘free dummy’ is clearly significant, in particular in the period before 1500, but also has a strong effect on the ‘sea’ variable, which becomes insignificant. Comparing the coefficients on the other variables to our baseline results, furthermore shows that especially the ‘sea’-variable seems to be affected by the inclusion of the country-specific institutional variables. Apparently there is a strong correlation between ‘free’ and ‘sea’ as determining factors of urban growth – in particular after 1500 (when only the Netherlands and after 1688 England are free). However, when subdividing the sea-variable into location on the Atlantic, Mediterranean or Baltic-North Sea coast, being located on the Atlantic still has a significant positive impact on population size (see Table B9 in Appendix B). Since the free/prince variable is defined at the country level, one may especially be concerned whether or not the results shown in Table 7 hold up to the inclusion of country (or even city) specific effects. Table B10 and B11 in Appendix B, show that they do, the free/prince variable is always significant during 800-1500 and sometimes it is also significant in the 1600-1800 period (if so always smaller that in the 800-1500). The results of adding the proxies developed by Acemoglu et.al. (2002; 2005) for the quality of institutions (either ‘constraints of the executive’ or ‘protection of capital’) to the model were disappointing; coefficient were generally insignificant, although most of the time they had the right sign; again they ‘conflict’ with the sea variable appears (results not shown here). Table 5 Focus on adding country-specific institutional variables: 22
It was assumed that states outside Western Europe were never’ free’ but always governed by a ‘prince’.
29
dependent variable sample:
ln city size all cities
ln city size Christian
ln city size Latin west
Sea
0.002 0.974
0.087 0.236
0.094 0.202
River
-0.017 0.692
-0.028 0.541
0.002 0.971
Hub
0.071 0.227
0.088 0.108
0.111 0.059
roman road
0.022 0.622
0.045 0.290
0.039 0.381
caravan hub
0.611 0.002
0.910 0.014
-
Caravan
0.061 0.697
0.112 0.272
-
Bishop
0.165 0.000
0.139 0.000
0.136 0.001
Archbishop
0.439 0.000
0.458 0.000
0.460 0.000
Capital
0.834 0.000
0.813 0.000
0.823 0.000
University
0.293 0.000
0.289 0.000
0.267 0.000
Muslim
0.278 0.001
-
0.567 0.000
0.114 0.025 0.068 0.010
0.000 0.997 0.148 0.000
-0.014 0.780 0.171 0.000
0.108 0.068
0.076 0.197
0.064 0.274
0.110 0.003 0.071 0.083
0.082 0.033 0.035 0.380
0.092 0.011 0.038 0.340
0.236 0.000
0.116 0.000
0.008 0.000
foreign urban potential Muslim Christian
Protestant
free/prince DLS 800-1500 1600-1800
p-value time-dummies p-value random effects
30
nr. Observations R2
2273 0.418
1873 0.386
1831 0.366
Notes: p-values below the coefficients. The standard errors used to calculatethe p-values are corrected for heteroscedasticity and autocorrelation. Bold faced coefficients are significant at the 5% level, and bold faced ànd italic coefficients are significant at the 10% level.
City Growth So far, we have concentrated on explaining, for ten cross sections (one per century) and for the dataset as a whole, why some cities are big and others even bigger. The models presented explain to a certain extent which factors determine the size of cities at these points in time, but do not really analyse their growth. One way to make the analysis more dynamic is to find out which factors explain city growth: what is the effect of being a capital – or becoming a capital – on the growth of the city in the next century, does FUP have a dynamic effect, and does city size affect the growth performance of cities? The results are presented below. Firstly, city size has a negative effect on city growth, which is not unexpected: cities tend towards a certain average, and do not grow explosively. But this effect is stronger (the coefficient is larger) for Christian cities than for Muslim cities, indicating that the latter are less restrained – and tend to grow bigger – than in Western Europe, where the moderating effect of past city size is stronger (this is analogous to the finding that the biggest cities are a much larger share of total urban population in the East than in the West). The negative coefficient is important, however, because it implies that agglomeration effects are limited. The findings of previous regressions concerning capitals – that their effect in city growth in the Middle East and the Latin West is very similar – is again confirmed by the dynamic model. The most interesting finding is probably that FUP has a positive impact on city growth in the west – between Christian cities – but hardly between Muslim cities. But this result is rather sensitive to the specification of the model; when other variables are added to the model (such as ‘sea’) the link disappears, however. Other experiments with the country specific institutional variables produce results which are consistent with the findings of the static model. In general, the results of the dynamic analysis are very preliminary and need more careful analysis. Table 6 Explaining city growth dependent variable
city growth
city growth
city growth
city growth
sample:
all cities
Christian
Muslim
latin west
city growth Non latin west
-0,219 0,000
-0,249 0,000
-0,164 0,000
-0,243 0,000
-0,151 0,000
0,031 0,098 0,051 0,002 0,350
0,036 0,139 0,061 0,010 0,399
0,003 0,957 0,073 0,144 0,220
0,036 0,122 0,050 0,038 0,405
0,023 0,566 0,046 0,256 0,195
city size (t-1) foreign urban potential (t1) Muslim Christian capital (t-1)
31
becomes a capital
0,000 0,402 0,000
0,000 0,393 0,000
0,000 0,373 0,007
0,000 0,367 0,000
0,000 0,391 0,010
p-value time-dummies p-value random effects nr. observations R2
0,000 0,877 1473 0,194
0,000 0,652 1152 0,197
0,001 0,023 321 0,193
0,000 0,555 1131 0,200
0,004 0,091 342 0,177
Notes: p-values below the coefficients. The standard errors used to calculate the p-values are corrected for heteroscedasticity and autocorrelation. Bold faced coefficients are significant at the 5% level, and bold faced ànd italic coefficients are significant at the 10% level.
Conclusion In this paper we have developed a powerful tool for the analysis of long term economic change in the pre modern era: we presented a new dataset about the growth of cities in Europe (except for Russia) and the Arab world between 800 and 1800, and we offered new ways of analyzing those data, in particular focusing on geographic location of these cities and on the interactions between them. At the moment the main problem is perhaps to digest the many results that can be acquired, and to more fully develop the dynamic analysis briefly presented here. What do these results tell us about the divergent development of the urban systems in West and East? A striking result is the negative interaction between the two systems, between the Islamic and the Christian cities, in particular in the period after 1000. It is strong evidence that culture does matter, that these two cultures had and/or developed different institutions that facilitated exchange amongst them, but hindered exchange over the borders of the urban system. Moreover, it also explains why the Arab world could continue to stagnate, in spite of the enormous growth of the European economy and urban system – it simply did not get the positive stimuli from Europe. On the contrary, if these regressions tell the whole story, European growth may have had negative effects on development in the Arab world. However, the negative interaction is a phenomenon of the post-1000 period; before 1000 Christian cities probably profited from the urban dynamism in the Islamic world, and only after about 1000 they developed the institutions which explain the negative interaction that dominates developments since.23 A second conclusion is that from the start the Islamic urban system was quite different from that found in the West. Whereas in the West we find a high degree of continuity with the Roman past, the Islamic urban system appears to be different from what was found before. The most radical change with the past was that it turned away from the seas and, linked to this, replaced the system of Roman roads for Caravan Routes. In the new transport system the cart drawn by oxen or horses was replaced by the 23
The changing evolution of the slave trade may also have played a role in this, as we have seen; before 1000 the European cities helped to satisfy the strong demand for slaves from the South and slaves were probably the main commodity exported to the Islamic world; after 1000 this stream dried up, because of the conversion of the Slavs to Christendom and the increasing role of the Church which forbid the taking of slaves among Christian populations.
32
camel packed with goods.24 The reasons for turning its back to the seas may initially have been related to the fact that during the Conquest of the Middle East and North Africa Christian powers – in particular Byzantium – still dominated the Mediterranean, which made sea transport more risky than overland trade.25 But between 900 and 1100, when the Arabs controlled the Eastern, Southern and Western shores of the Mediterranean, including Sicily, Sardinia, and the Baleares, and it was almost an inner lake of the Islam, this orientation did not change fundamentally. It were traders from Italy – Pisa, Genova, Venice - who filled the gap left by the Byzantines. Part of the explanation is that the Arabs were caravan traders by origin, their conquests were conducted on the backs of camels, so the choice for this mode of transport was logical, but in the Mediterranean they somehow lacked the flexible institutions and incentives to develop large-scale sea transport when the changes for doing this emerged. However, in the Indian Ocean Muslim traders and shippers did develop a strong control over sea routes, suggesting that it may have been competition with the more efficient European merchants who blocked them in the Mediterranean (Chaudhuri 1985). This choice for camels and caravans as the key mode of transport had long term consequences. Given its technology, prospects for productivity growth were meager; in fact, the productivity of camel transport may not have changed at all during the ten centuries under study. The West, on the other hand, continued to use the Roman roads and the sea. The potential for productivity growth in sea transport proved to be very large, and one of the explanations for the increased strength of the ‘sea’ variable through time is the fact that transport costs overseas declined much more than via other modes of transport.26 One of the factors explaining dynamic growth of the urban system in the West and stagnation in the East is therefore this – perhaps to some extent fortuitous – choice of the key mode of transport and its long term growth possibilities – the Muslim world became locked in into the camel-overland trade, whereas the Latin West could profit from the productivity growth of seaborn trade. Let us now turn to the central question: were Muslim cities typical consumer cities and Christian cities typical producer cities? By and large, this hypothesis seems to be confirmed, but the analysis also suggests that the story is more complex. We have tried to test this hypothesis in a number of ways yielding different results. When we look at the structure of the urban system, the differences are indeed quite big: the share of the primate city was much higher in the Arab world than in the Latin West; the urban density of the system was much lower in the east than in the west, and in the Arab world the seavariable was consistently negative, indicating that big cities did not owe their prosperity to long-distance, overseas trade. Moreover, the growth cycles of the Islamic urban system was closely linked to the rise and decline of bit territorial entities – first flourishing under the Umayyad and Abbasid Caliphates (661-1258), followed by a desintegration of the 24
Hourani 2002: 44: ‘In the greater part of the Near East wheeled transport disappeared after the rise of the Muslim Empire, not to come back until the nineteenth century, and various reasons have been suggested for this: Roman roads decayed, the new Arab ruling groups had an interest in the rearing of camels, and transport on camel-back was more economical than by cart’; according to Glick 1979: 24 the disappearance of wheeled transport antedated the Arabic expansion by several centuries, but also stresses the link with the military use of the camel. 25 Ashtor 1976 …… 26 This may have been scale-dependent: whereas sea transport was subject to strong economies of scale, land transport (by cart and by camel) probably was much less so.
33
Islamic state system in the 13th-14th centuries, again followed by a reconsolidation linked to the rise of the Ottoman Empire. Big cities were the centers of big states, and when the big states collapsed, the level of urbanization went down. In Western Europe this was much less the case; in particular in the period between 900 and 1300 the rise of cities ran parallel to a collapse of the Carolingian Empire and the desintegration of its successor states, suggesting that the new cities of the Latin West were not dependent on large territorial states (which is reflected in the decline of the capital coefficient). After 1300 state formation and urban growth went hand in hand again, however. This all is strong evidenced confirming the original hypothesis. But at the same time we found that being a capital had a huge effect on the size of cities in both regions (although between 900 and 1200 this effect was rather small in Western Europe). Perhaps more importantly, the FUP variable was quite high for the Muslim world (although it tended to decline there) indicating high levels of interaction between cities. In fact during the Middle Ages interaction between Muslim cities appears to have been more efficient than between Christian cities. How to explain these seemingly conflicting results? The solution to this apparent paradox is that indeed cities in the Muslim world (or outside the Latin West) tended to be consumer cities, which were part of states that manipulated large streams of income from the countryside to the urban areas. But these cities were also part of a relatively efficient system of (international) exchange, made possible by the introduction of institutions facilitating trade between the different parts of the Arab world. The efficiency of the network of trade explains the high levels of ‘static’ interaction found (the high FUP coefficient); the fact that the dynamic effects of these institutions were rather limited is related to the fact that these consumer cities were not based on some kind of equal exchange between town and countryside, but dependent on the coercive power of the state to extract a surplus from this countryside. In this respect Western Europe – in particular between 900 and 1300 – was different. In the centuries from 800 to 1200 we find a transition towards a very dense urban system in which the primate city is relatively small, with increased levels of interaction between cities and a growing impact of the sea (indicating the effects of long distance trade) on city growth (at the same time, as already suggested by Van Zanden 2007, we find traces of a growing power of the Church which filled in part of the power vacuum created by the desintegration of the Carolingian Empire, leading to a fall in the capital coefficient and a rise of the coefficients of bishoprics and archbishoprics). In short, between 900 and 1300 an urban system emerged - before 1000 Western Europe in fact did not have an integrated urban system - that was clearly ‘producer-based’. The preliminary analysis also suggests that from the High Middle Ages onwards feedbacks between cities were positive, in particular in a dynamic sense: city growth led to more city growth, an effect that is less strong in the Arab world. The explanation is that the political economy of the relatively small and competitive cities that emerged between 900 and 1300 was radically different from what we found in the Arab world; they were not part of an ‘predator’ state, but had to compete for resources, and established new institutions (guilds, communes) to protect their property rights in the political vacuum that emerged, and organize the competitive quest for trade and resources (cf Greif 2006). However, in the early modern period, with the process of state formation that gained ground, opposite tendencies became stronger again. This is most evident from the rise of the coefficient of the capital city and the increase share of the biggest cities in the total 34
urban population; as a case study of Italian urbanization has demonstrated, in southern Italy this was largely dominated by the growth of a typical consumer city such as Naples (Bosker et.al. 2007). We also found that the country-specific institutional variables linked to the political economy of the emerging states before 1500 pointed at a strong effect of ‘feudalism’ (a situation of fragmented authority, characterized by independent states, parliaments etc.) on city growth, whereas after 1500 this effect was much less in evidence. One of the reasons was that the only Free ‘Republics’ that remained (the Netherlands) or came into existence (Britain after 1688) were located at the Atlantic ocean; as Acemoglu et.al.(2005) we found strong evidence for the effect of the Atlantic economy emerging after 1500. Summing up, the Arab world was in a way quite innovative (it adopted a ‘new’ mode of transport replacing the Roman infrastructure), exchange between Muslim cities was highly efficient, but at the same time these ‘consumer’ cities remained locked in into the basic institutions of states which were (because of their basically predatory nature) unable to generate long-term economic growth. The urban system that arose in Western Europe between 900 and 1300 was by contrast geared towards generating its own resources via market exchange; it was highly competitive, much less dependent on states (which were quite weak between 900 and 1300, anyway) and orientated towards longdistance trade via the sea. It was this ‘new’ urban system that generated the long term economic development that was characteristic of Western Europe in the millennium after 900.
References:
Acemoglu, D. and Johnson, S. and Robinson, J. (2002). ‘The Rise of Europe: Atlantic Trade, Institutional Change and Economic Growth’. Working Paper, NBER 9378. Acemoglu, D., S.Johnson, and J.Robinson (2005), 'The Rise of Europe: Atlantic Trade, Institutional Change, and Economic Growth', American Economic Review, 95, (3), 546579. Ashtor, E. (1976) A social and economic history of the Near East in the Middle Ages. London: Collins. Austen, Ralph A. (1990) ‘Marginalization, stagnation, and growth: the trans-Saharan caravan trade in the era of European expansion, 1500-1900’, in James D. Tracy (ed.) The rise of merchant empires, long-distance trade in the early modern world, 1350-1750. Cambridge University Press, Cambridge, pp 311-50. Auty, Robert (ed) (1977-1999) Lexikon des Mittelalters. Metzler, Stuttgart. Baedeker, Karl (1906) Palestine and Syria. Verlag Karl Baedeker, Leipzig. Baedeker, Karl (1911) The Mediterranean. Karl Baedeker publications, Leipzig. Baedeker, Karl (1914) Konstantinopel und Kleinasien. Verlag Karl Baedeker, Leipzig. Baedeker, Karl (1914) Egypt and the Sudan. Verlag Karl Baedeker, Leipzig. Bairoch, Paul, Jean Batou and Pierre Chèvre (1988) La population des villes Européennes, 800-1850. Librairie Droz, Genève. Ballaux, Bart en Bruno Blondé (2007), ‘Landtransportprijzen en de economische ontwikkeling van Brabant in de lange zestiende eeuw. Een braakliggend stuk prijzengeschiedenis’, TSEG 4/2, pp. 57-85. 35
Barraclough (ed.) G. (1981) Spectrum Times Atlas van de wereldgeschiedenis. Spectrum, Utrecht. Berman, H. (1983). Law and Revolution: the formation of the western legal tradition. Cambridge (Mass.): Harvard U.P. Bosker, Maarten, Brakman, Steven, Garretsen, Harry, de Jong, Herman and Schramm, Marc (2007), "The Development of Cities in Italy 1300 – 1861”. CESifo Working Paper Series No. 1893 Campbell, B.M.S. (2000). English Seigniorial Agriculture 1250-1450. Cambridge University Press, Cambridge. Chandler, Tertius and Gerald Fox (1974) 3000 years of urban growth. Academic Press, New York. Chaudhuri, K.N. (1985) Trade and Civilisation in the Indian Ocean: An Economic History from the Rise of Islam to 1750. Cambridge University Press 1985 Collins, Basil Anthony (1994) Al-Muqaddasi, the best divisions for knowledge of the regions. Garnet Publishing Ltd, Reading. Davis, Robert C. (2003) Christian Slaves, Muslim Masters. White slavery in the Mediterranean, the Barbary Coast and Italy. London: Macmillan. DeLong, J. B. and Shleifer, A. (1993). ‘Princes and Merchants: City Growth Before the Industrial Revolution.’ Journal of Law and Economics 36, 671-702. Dominique, Paul Charles (1995) Voyageurs Arabes, Ibn Fadlan, Ibn Jubayr, Ibn Battuta et un auteur anonyme. Gallimard, Paris. Eche, Youssef (1967) Les bibliothèques Arabes, publiques et semi-publiques en Mésopotamie, en Syrie et en Egypte au moyen-âge. Institut Français de Damas, Damas. Encyclopaedia Britannica (1898), ninth edition, Black, Edinburgh. Ennen, Edith (1972) Die europäische Stadt des Mittelalters. Vandenhoeck und Ruprecht, Göttingen. Epstein, S.R. (1991) Cities, Regions and the Late Medieval Crisis: Sicily and Tuscany compared’. Past and Present, 130, pp. 3-50. Epstein, S.R. (2000) Freedom and growth: the rise of states and markets in Europe 13001750. London: Routledge Erdem, Y. Hakan (1996) Slavery in the Ottoman Empire and Its Demise, 1800-1909. London: McMillan. Escher, Anton and Eugen Wirth (1992) Die Medina von Fes. Palm und Enke, Erlangen. Finley, Moses I. (1985) The Ancient Economy. University of California Press. Glick, T.F. (1979). Islamic and Christian Spain in the early Middle Ages. Princeton: Princeton U.P. Gibb, H. A. R. (ed) (1975-2005) Encyclopaedia of Islam. Brill, Leiden. Greif, A. (2006). Institutions and the path to the modern economy: lessons from Medieval trade. Cambridge: Cambridge U.P. Grosjean, Georges (1977) Mapamundi, der katalanische Weltatlas vom Jahre 1375. Urs Graf Verlag, Zürich. Hajnal, J. (1965). ‘European marriage in perspective’. In: Glass, D.V. and Eversley, D.E.C., (Eds.). Population in history, London: Hammond, Nicholas G.L. (ed) (1981) Atlas of the Greek and Roman world in antiquity. Noyes Press, Park Ridge.
36
Harris, C., (1954), "The Market as a Factor in the Localization of Industry in the United States," Annals of the Association of American Geographers 64, 315-348. Hourani, Albert (2002) A History of the Arab Peoples. Cambridge (Mss): Belknap. Houtsma, M. Th. (ed) (1993) E.J. Brill’s First encyclopaedia of Islam 1913-1936. Brill, Leiden. Huff, Toby E. (2003) The rise of early modern science, Islam China and the West. Cambridge University Press, Cambridge. Inalcik, Halil (1994) An economic and social history of the Ottoman Empire, I, 13001600. Cambridge: Cambridge U.P. Jédin, Hubert, Kenneth Scott Latourette and Jochen Martin (1980) Atlas zur Kirchengeschichte, die Christlischen Kirchen in Geschichte und Gegenwart. Herder, Freiburg. Kennedy, Hugh (2002) ‘Military pay and the economy of the early Islamic state’. Historical Research 75 (2) 155-169. Krugman., P. (1993), ‘First Nature, Second Nature, and Metropolitan Location’, Journal of Regional Science, 33, 129-144. Kuran, T. (2003). ‘The Islamic commercial crisis: institutional roots of economic underdevelopment in the Middle East’. Journal of Economic History 63, 414-447. Malanima, P. (1998).’Italian cities 1300-1800. A quantitative approach’. Rivista di storia economica XIV, 2, pp. 91-126. Mann, M. (1986). The Sources of Social Power. I. A history of power from the beginning to A.D. 1760. Cambridge: Cambridge U.P. Masschaele, J. (1993), ‘Transport costs in medieval England’, Economic History Review, 46, 266-279. McCormick, M. (2001). Origins of the European Economy. Communications and commerce A.D. 300-900. Cambridge: Cambridge U.P. McEvedy, Colin (1977) Kosmos historische atlassen: middeleeuwen. Kosmos, Amsterdam. McEvedy, Colin (1977) Kosmos historische atlassen: nieuwe tijd. Kosmos, Amsterdam McEvedy, Colin and Richard Jones (1979) Atlas of world population history. Allen Lane, London. Menard, Russell R. (1991), ‘Transport costs and long-range trade 1300-1800: was there a European “transport revolution” in the early modern era?’ in: James D. Tracy ed., The political economy of merchant empires. State power and world trade 1350-1750. Cambridge UP, pp. 228-275. Pomeranz, K. (2000). The Great Divergence. China, Europe and the Making of the Modern World Economy. Princeton U.P. Redding, S. and A.J. Venables, (2004), ‘Economic Geography and International Inequality’, Journal of International Economics, 62(1), pp. 53-82 Roolvink, R. (1957) Historical atlas of the Muslim peoples. Djambatan, Amsterdam. Rostovtzeff, M. (1971) Caravan cities. AMS Press, New York. Talbert, Richard J.A. (ed) (2000) Barrington atlas of the Greek and Roman world. Princeton University Press, Princeton. Tilly, C. (1990). Coercion, Capital, and European States, AD 990-1990. Cambridge (Mass) Basil Blackwell.
37
Tielhof, Milja van, and Jan Luiten van Zanden (2007) Productivity changes in shipping in the Dutch Republic: the evidence from freight rates, 1550-1800. Working Paper IISG. Verhulst, A. (1999). The Rise of Cities in North-West Europe. Cambridge: Cambridge U.P.. Vries, Joh. de (1959). De economische achteruitgang van de Republiek in de achttiende eeuw. Leiden. Vries, J. de (1984) European urbanization, 1500-1800. Methuen and Co, London. Weber, Max (1904) Die protestantische Ethik und der 'Geist' des Kapitalismus Weber, Max (1922/1978), ‘The city (non-legitimate domination).’ In his Economy and Society: An Outline of Interpretive Sociology. Berkeley: University of California Press, 2 vols. Vol.2, ch. XVI: 1212-372. Weber, Max (1958) The City. Translation and edited by Don Martindale and Gertrud Neuwirth. New York, The Free Press. Weiler, A.G. (2003), ‘Sint Radboud, bisschop van Utrecht [Deventer] van 899/900 tot 917’ Trajecta, 12, 97-115. Wong, R. Bin. (1997). China Transformed: Historical Change and the Limits of European Experience. Cornell U.P. Woodford, Jerome S. (1990) The city of Tunis, evolution of an urban system. Middle East & North African Studies Press, Wisbech. Zanden, J.L. van (2007) ‘Economic Growth in a period of political fragmentation 9501300’. Paper for GEHN/Utrecht Conference on Law and Economic Development, Utrecht.
38
Appendix A. Descriptive statistics
Table A1 Total population in cities with more than 10,000 inhabitants (x1000) Country 800 900 1000 1100 1200 1300 1400 Scandinavia 0 0 0 0 0 0 0 Great Britain 0 10 62 72 84 133 77 Ireland 0 0 15 0 0 24 15 Low Countries 0 0 24 34 150 252 327 France 152 147 249 340 610 973 696 Germany 105 126 198 208 285 418 360 Austria/Switzerland 0 0 0 0 12 20 30 Italy 150 212 413 493 766 1352 900 Iberia 240 361 602 540 567 770 635 Poland 0 0 0 0 10 22 60 Czech Rep. 0 0 10 10 10 50 95 Hungary/Slovakia 0 0 0 0 0 0 0 Yugoslavia/Albania 0 30 55 20 25 73 77 Bulgaria/Rumania 30 60 70 65 95 150 103 Greece 20 60 55 53 50 75 77 Turkey 465 555 580 535 495 325 335 Lebanon/Israel 45 75 90 95 80 95 60 Syria 120 130 140 155 180 180 160 Iraq 650 690 430 340 290 190 165 Egypt 195 330 358 405 395 553 480 North Africa 90 120 165 285 290 305 315
1500 10 88 0 421 933 425 42 1281 780 131 94 37 100 168 29 467 60 157 95 450 305
1600 40 293 5 637 1291 619 77 2094 1295 232 100 39 225 164 83 798 45 160 65 220 315
1700 115 764 96 1023 1903 621 182 2037 1060 188 92 57 170 223 53 1040 45 160 65 185 355
1800 238 2430 462 1034 2610 1373 394 3281 2055 276 122 308 279 444 82 880 45 160 115 186 296
Latin-West Balkan ME-NA Total
4205 334 1534 6073
6683 511 1603 8797
8081 503 1850 10434
14275 1113 1682 17070
647 856 1573 1697 2494 4014 50 150 180 138 170 298 1565 1900 1763 1815 1730 1648 2262 2906 3516 3650 4394 5960
3195 257 1515 4967
39
Table A2 Urbanisation ratio (total population in cities >=10000 inhabitants / total population) Country 800 900 1000 1100 1200 1300 1400 1500 Scandinavia 0,0 0,0 0,0 0,0 0,0 0,0 0,0 0,5 Great Britain 0,0 0,8 3,6 3,4 2,9 3,2 2,7 2,1 Ireland 0,0 0,0 5,0 0,0 0,0 3,0 2,5 0,0 Low Countries 0,0 0,0 3,4 3,4 10,0 12,3 23,4 19,6 France 3,0 2,6 3,8 4,4 5,8 6,1 6,3 6,2 Germany 3,2 3,7 5,7 5,2 4,8 4,6 5,5 4,7 Austria/Switzerland 0,0 0,0 0,0 0,0 0,7 0,7 1,6 1,5 Italy 3,8 4,7 8,3 8,6 10,6 13,5 12,9 12,8 Iberia 5,8 8,2 13,1 10,4 8,9 8,8 9,9 10,1 Poland 0,0 0,0 0,0 0,0 0,4 0,6 2,2 3,3 Czech Rep. 0,0 0,0 0,8 0,7 0,5 1,7 3,8 3,1 Hungary/Slovakia 0,0 0,0 0,0 0,0 0,0 0,0 0,0 0,9 Yugoslavia/Albania 0,0 1,8 2,8 0,9 1,1 3,0 3,9 4,1 Bulgaria/Rumania 2,3 4,1 4,4 3,7 4,9 6,0 5,3 6,0 Greece 2,5 6,7 5,5 4,8 4,2 6,0 8,6 2,9 Turkey 7,4 8,2 7,9 10,1 7,9 4,5 5,8 7,4 Lebanon/Israel 6,3 11,5 15,0 15,8 12,9 14,6 10,3 10,0 Syria 8,0 9,8 11,2 12,4 13,5 12,3 13,7 12,6 Iraq 26,0 30,7 21,5 19,4 19,3 19,0 16,5 9,5 Egypt 5,1 7,2 7,2 9,6 9,9 11,5 13,0 11,3 North Africa 2,0 2,4 3,0 5,3 5,7 5,4 6,9 7,1 Latin-West Balkan ME-NA Total
3,0 1,0 8,1 4,9
3,5 2,7 9,2 5,8
5,8 2,9 8,1 6,4
5,3 1,9 9,8 6,3
5,8 2,1 9,2 6,3
6,5 2,9 7,9 6,4
7,2 3,1 9,0 7,2
6,9 3,2 8,8 6,9
1600 1700 1800 1,7 3,6 4,6 5,9 11,3 23,1 0,4 3,8 8,8 21,2 27,3 19,7 7,0 8,7 9,0 5,2 4,8 7,6 2,2 4,9 8,3 17,5 15,7 17,3 12,3 10,6 14,4 4,6 3,1 3,1 2,2 2,0 1,8 0,7 1,0 3,1 7,6 5,6 5,4 5,0 5,9 5,9 5,5 3,5 3,6 10,1 12,2 9,2 6,9 7,5 7,5 11,0 12,8 12,8 5,2 6,5 11,5 4,4 4,1 5,3 5,3 7,4 4,7 8,6 3,8 7,2 7,8
9,1 3,5 9,0 8,5
11,2 4,5 7,6 9,8
40
Table A3 Total population (x1000) Country 800 Scandinavia 560 Great Britain 740 Ireland 260 Low Countries 500 France 5000 Germany 3250 Austria/Switzerland 800 Italy 4000 Iberia 4150 Poland 1000 Czech Rep. 1000 Hungary/Slovakia 1300 Yugoslavia/Albania 1450 Bulgaria/Rumania 1300 Greece 800 Turkey 6300 Lebanon/Israel 720 Syria 1500 Iraq 2500 Egypt 3800 North Africa 4500 Latin-West Balkan ME-NA Total
900 630 1220 280 600 5750 3375 900 4500 4380 1125 1125 1525 1700 1450 900 6800 650 1333 2250 4600 4950
1000 700 1700 300 700 6500 3500 1000 5000 4600 1250 1250 1750 1950 1600 1000 7300 600 1250 2000 5000 5500
1100 1200 1300 1400 1500 910 1130 1300 1000 1300 2100 2900 4200 2900 4200 400 600 800 600 800 1000 1500 2050 1400 2150 7750 10500 16000 11000 15000 4000 6000 9000 6500 9000 1300 1750 2800 1850 2800 5750 7250 10000 7000 10000 5200 6400 8750 6400 7750 1500 2250 3500 2750 4000 1500 2000 3000 2500 3000 2100 2800 4250 3500 4250 2200 2330 2450 1950 2450 1760 1930 2500 1950 2800 1100 1200 1250 900 1000 5300 6300 7300 5800 6300 600 620 650 580 600 1250 1333 1458 1167 1250 1750 1500 1000 1000 1000 4200 4000 4800 3700 4000 5400 5050 5600 4550 4300
1600 1700 5000 1250 3000 18500 12000 3500 12000 10500 5000 4500 5750 2950 3250 1500 7900 650 1458 1250 5000 6000
1700 2400 6750 2500 3750 22000 13000 3750 13000 10000 6000 4500 6000 3050 3750 1500 8500 600 1250 1000 4500 4800
1800 4200 10500 5250 5250 29000 18000 4750 19000 14250 9000 6750 10000 5150 7500 2250 9600 600 1250 1000 3500 6300
21880 24645 27400 32470 43600 63250 45350 61850 78900 89950 130200 4850 5575 6300 7160 8260 10450 8300 10500 13450 14300 24900 19320 20583 21650 18500 18803 20808 16797 17450 22258 20650 22250 46050 50803 55350 58130 70663 94508 70447 89800 114608 124900 177350
41
Table A4 nr. cities >=10000 inhabitants Country 800 900 1000 1100 1200 1300 1400 1500 1600 1700 Scandinavia 2 Great Britain 1 4 4 4 6 4 4 8 12 Ireland 1 2 1 3 Low Countries 2 2 7 13 9 21 28 32 France 10 10 17 18 30 34 27 34 43 64 Germany 6 6 10 9 13 24 22 25 33 29 Austria/Switzerland 1 1 2 3 3 5 Italy 5 9 18 19 31 47 28 44 77 68 Iberia 9 15 21 19 22 24 21 34 55 35 Poland 1 2 4 6 9 8 Czech Rep. 1 1 1 3 1 3 1 4 Hungary/Slovakia 3 3 4 Yugoslavia/Albania 1 2 2 1 4 4 3 6 6 Bulgaria/Rumania 1 1 3 3 4 8 5 8 9 10 Greece 1 2 2 2 2 2 2 2 2 2 Turkey 6 8 9 9 8 10 9 9 9 6 Lebanon/Israel 2 4 4 5 3 4 2 2 1 1 Syria 3 3 3 3 4 3 2 2 2 2 Iraq 4 4 5 4 5 5 5 3 3 3 Egypt 2 4 4 4 4 3 3 3 2 2 North Africa 4 5 6 8 7 9 8 7 7 8
1800 6 65 12 37 91 58 10 128 85 8 3 18 15 22 2 7 1 2 3 1 10
Latin-West Balkan ME-NA Total
522 57 24 603
30 2 21 53
41 4 28 73
74 7 31 112
72 7 33 112
110 7 31 148
156 14 34 204
119 11 29 159
178 16 26 220
261 20 24 305
267 22 22 311
42
Table A5 Urban primacy (population largest city / total population in cities >= 10,000) Country 800 900 1000 1100 1200 1300 1400 1500 1600 Scandinavia Great Britain 1.00 0.40 0.44 0.48 0.53 0.58 0.57 0.68 Ireland 1.00 0.54 1.00 Low Countries 0.50 0.53 0.27 0.16 0.38 0.13 0.08 France 0.16 0.19 0.10 0.19 0.18 0.26 0.29 0.21 0.23 Germany 0.24 0.20 0.20 0.17 0.18 0.13 0.11 0.11 0.07 Austria/Switzerland 1.00 1.00 0.67 0.48 0.65 Italy 0.33 0.19 0.15 0.12 0.09 0.08 0.11 0.10 0.13 Iberia 0.31 0.26 0.17 0.16 0.14 0.19 0.16 0.09 0.10 Poland 1.00 0.55 0.33 0.24 0.34 Czech Rep. 1.00 1.00 1.00 0.60 1.00 0.74 1.00 Hungary/Slovakia 0.41 0.38 - 1.00 0.73 0.50 1.00 0.34 0.39 0.50 0.24 Yugoslavia/Albania Bulgaria/Rumania 1.00 1.00 0.43 0.38 0.37 0.23 0.24 0.30 0.18 Greece 1.00 0.83 0.73 0.66 0.60 0.67 0.55 0.66 0.60 Turkey 0.54 0.54 0.52 0.37 0.40 0.31 0.24 0.32 0.56 Lebanon/Israel 0.56 0.40 0.39 0.42 0.56 0.47 0.75 0.83 1.00 Syria 0.42 0.46 0.50 0.52 0.50 0.50 0.56 0.57 0.56 Iraq 0.54 0.65 0.70 0.74 0.69 0.50 0.55 0.63 0.46 Egypt 0.51 0.45 0.38 0.37 0.51 0.72 0.75 0.89 0.91 North Africa 0.56 0.46 0.30 0.25 0.28 0.23 0.32 0.33 0.32
1700 0.80 0.75 0.63 0.20 0.26 0.11 0.63 0.15 0.17 0.21 0.52 0.35 0.29 0.20 0.75 0.67 1.00 0.56 0.46 0.95 0.34
1800 0.55 0.39 0.43 0.21 0.21 0.13 0.63 0.13 0.09 0.23 0.62 0.11 0.14 0.11 0.85 0.65 1.00 0.56 0.70 1.00 0.41
Latin-West Balkan ME-NA Total
0.07 0.11 0.38 0.80
0.07 0.09 0.34 0.55
0.12 0.11 0.06 0.60 0.40 0.22 0.22 0.24 0.17
-
-
-
0.05 0.25 0.14
0.04 0.21 0.12
0.06 0.17 0.24
0.06 0.16 0.24
0.05 0.17 0.26
0.04 0.12 0.28
-
-
-
-
-
-
43
Appendix B. Robustness checks and additional regressions Fixed effects (FE) and first differenced (FD) estimation Table B1: Baseline estimation including fixed city effects dependent variable sample: estimation method
ln city size ln city size ln city size ln city size ln city size all cities Christian Muslim latin west non latin west FE FE FE FE FE
bishop
-0.094 0.490
-0.113 0.350
0.126 0.711
-0.080 0.464
-0.030 0.918
archbishop
0.239 0.074
0.268 0.113
0.501 0.252
0.324 0.030
0.048 0.878
capital
0.611 0.000
0.474 0.000
0.728 0.000
0.537 0.000
0.707 0.000
university
0.213 0.011
0.183 0.029
0.001 0.998
0.185 0.024
0.061 0.838
Muslim
0.061 0.507
-
-
0.448 0.000
-0.074 0.522
0.209 0.002 0.213 0.000
0.050 0.462 0.327 0.000
0.521 0.001 -0.027 0.778
0.056 0.371 0.322 0.000
0.433 0.001 -0.072 0.439
protestant
0.090 0.438
0.058 0.612
-
0.057 0.616
-
nr. observations R2
2273 0.138
1873 0.146
400 0.131
1831 0.190
442 0.204
foreign urban potential Muslim Christian
Notes: p-values below the coefficients. The standard errors used to calculatethe p-values are corrected for heteroscedasticity and autocorrelation. Bold faced coefficients are significant at the 5% level, and bold faced ànd italic coefficients are significant at the 10% level.
44
Table B2: First differenced estimation of the baseline model dependent variable sample: estimation method
ln city size ln city size ln city size ln city size ln city size all cities Christian Muslim latin west non latin west FD FD FD FD FD
bishop
-0.047 0.492
-0.016 0.853
-0.041 0.713
0.004 0.969
-0.039 0.706
archbishop
0.092 0.398
0.132 0.295
0.292 0.179
0.168 0.266
0.105 0.376
capital
0.293 0.000
0.268 0.000
0.364 0.000
0.227 0.001
0.343 0.000
university
0.059 0.383
0.060 0.408
-0.006 0.952
0.038 0.608
0.120 0.290
Muslim
0.073 0.360
0.281 0.000
-0.162 0.236
0.301 0.005
-0.113 0.320
0.089 0.078 0.375 0.000
-0.010 0.863 0.465 0.000
0.360 0.000 0.054 0.366
0.019 0.748 0.469 0.000
0.218 0.014 0.025 0.652
protestant
0.161 0.030
0.153 0.039
-
0.142 0.055
-
nr. observations R2
1473 0.160
1152 0.206
321 0.113
1131 0.211
342 0.095
foreign urban potential Muslim Christian
Notes: p-values below the coefficients. The standard errors used to calculatethe p-values are corrected for heteroscedasticity and autocorrelation. Bold faced coefficients are significant at the 5% level, and bold faced ànd italic coefficients are significant at the 10% level.
45
Table B3a. Including country-specific fixed effects dependent variable sample: sea river hub roman road
ln city size ln city size ln city size ln city size ln city size all cities Christian Muslim latin west non latin west -0.403 0.062 0.104 0.106 -0.152 0.030 0.414 0.169 0.190 0.390 -0.044 -0.058 -0.058 -0.037 -0.168 0.404 0.269 0.670 0.514 0.143 0.120 0.111 0.124 0.040 0.069 0.026 0.045 0.038 0.776 0.584 0.083 0.077 0.069 0.079 0.103 0.050 0.085 0.648 0.082 0.442
caravan hub
0.476 0.009
0.769 0.033
0.495 0.053
-
0.505 0.022
caravan
0.049 0.825
0.038 0.820
0.197 0.473
-
0.069 0.759
bishop
0.140 0.000
0.179 0.000
0.117 0.616
0.186 0.000
0.017 0.916
archbishop
0.383 0.000
0.462 0.000
0.372 0.067
0.478 0.000
0.192 0.220
capital
0.923 0.000
0.863 0.000
0.835 0.000
0.877 0.000
0.887 0.000
university
0.305 0.000
0.309 0.000
0.170 0.475
0.282 0.000
0.355 0.048
Muslim
0.283 0.001
-
-
0.534 0.000
0.087 0.402
0.065 0.230 0.076 0.004
-0.025 0.644 0.156 0.000
0.453 0.001 -0.025 0.779
-0.027 0.640 0.156 0.000
0.291 0.012 -0.100 0.218
0.163 0.015 0.000 0.438
0.142 0.036 0.000 0.446
0.000 0.763
0.143 0.031 0.000 0.281
0.000 0.791
2273 0.478
1873 0.420
400 0.533
1831 0.394
442 0.574
foreign urban potential Muslim Christian
protestant p-value country dummies p-value time-dummies p-value random effects nr. observations R2
Notes: p-values below the coefficients. The standard errors used to calculate the p-values are corrected for heteroscedasticity and autocorrelation. Bold faced coefficients are significant at the 5% level, and bold faced ànd italic coefficients are significant at the 10% level. p-value timedummies denotes the p-value of an F-test on the joint significance on century-dummies, the results show that these are never significant, so that we do not include them in our baseline estimates. p-value random effects denotes the p-value corresponding to a Breusch-Pagan test for random effects.
46
Table B4. Including country-specific fixed effects – sea(s) in more detail dependent variable sample: Atlantic Mediterranean Baltic
river hub caravan hub caravan roman road
bishop archbishop capital university Muslim foreign urban potential Muslim Christian
protestant p-value country dummies p-value time-dummies p-value random effects nr. observations R2
ln city size whole sample 0.172 0.050 0.014 0.873 0.129 0.487
ln city size ln city size Christian latin west 0.186 0.172 0.046 0.059 0.049 0.033 0.600 0.747 0.121 0.137 0.493 0.437
-0.032 0.543 0.111 0.038 0.458 0.014 0.061 0.784 0.086 0.060
-0.053 0.314 0.104 0.059 0.749 0.039 0.063 0.701 0.091 0.037
-0.033 0.562 0.117 0.048 0.089 0.056
0.141 0.000 0.389 0.000 0.922 0.000 0.299 0.000 0.282 0.001
0.179 0.000 0.467 0.000 0.862 0.000 0.305 0.000 -
0.187 0.000 0.484 0.000 0.876 0.000 0.277 0.000 0.532 0.000
0.068 0.208 0.073 0.006
-0.018 0.743 0.153 0.000
-0.016 0.780 0.152 0.000
0.162 0.017 0.000 0.434
0.141 0.039 0.000 0.415
0.141 0.036 0.000 0.279
2273 0.479
1873 0.421
1831 0.396
Notes: p-values below the coefficients. The standard errors used to calculate the p-values are corrected for heteroscedasticity and autocorrelation. Bold faced coefficients are significant at the 5% level, and bold faced ànd italic coefficients are significant at the 10% level. p-value time-dummies denotes the p-value of an F-test on the joint significance on century-dummies, the results show that these are never significant, so that we do not include them in our baseline estimates. p-value random effects denotes the p-value corresponding to a Breusch-Pagan test for random effects.
47
Table B5a. Time-specific results for Christian cities with the sea-variable not subdivided dep. variable sample: year 800 900 1000 1100 1200 1300 1400 1500 1600 1700 1800
coefficient p-value
coefficient p-value p-value time-dummies p-value random effects
sea 0.098 0.333 0.324 0.270 0.161 0.130 0.254 0.190 0.230 0.327 0.336
hub 0.290 -0.101 0.088 0.245 0.131 0.059 0.055 0.174 0.158 0.122 0.083
bishop -0.081 0.020 -0.098 -0.016 0.109 0.221 0.138 0.069 0.108 0.143 0.203
archbishop -0.014 0.352 0.360 0.170 0.317 0.385 0.249 0.426 0.488 0.476 0.590
river 0.054 0.196
roman road 0.058 0.162
caravan 0.144 0.202
caravan hub 0.966 0.021
FUP Christian 0.056 0.087
protestant 0.096 0.090
university FUP Muslim 0.219 -0.083 0.000 0.090 0.665 0.000
nr. observations R2
capital 1.271 0.406 0.280 0.511 0.492 0.683 0.614 0.598 1.008 1.325 1.470
1873 0.427
48
Table B5b. Time-specific results for Latin West cities with the sea-variable not subdivided dep. variable sample: year
ln city size latin west
800 900 1000 1100 1200 1300 1400 1500 1600 1700 1800
sea 0.118 -0.058 0.199 0.185 0.181 0.120 0.366 0.278 0.298 0.398 0.377
hub 0.485 0.236 0.281 0.158 0.132 0.094 0.098 0.168 0.152 0.129 0.068
bishop -0.055 0.086 -0.176 0.151 0.124 0.193 0.116 0.093 0.127 0.157 0.203
archbishop -0.122 0.177 0.244 0.394 0.313 0.364 0.249 0.452 0.491 0.470 0.578
coefficient p-value
river 0.090 0.048
roman road 0.053 0.233
caravan -
caravan hub -
FUP Christian 0.103 0.002
protestant 0.060 0.303
coefficient p-value
university FUP Muslim 0.215 -0.145 0.001 0.011
p-value time-dummies p-value random effects
0.369 0.000
nr. observations R2
capital 0.966 0.220 0.281 0.481 0.540 0.814 0.676 0.574 1.034 1.363 1.487
Muslim 0.345 0.543 0.768 0.641 0.559 1.033 0.899 -0.545 -1.390 -
1831 0.422
49
Robustness checks: the interpretation of the FUP coefficient The interpretation of the FUP coefficient is quite complex, as we demonstrate below. This immediately becomes clear when writing down the elasticity of an increase of population in (an existing) city j on the population in city i. From the formula used to calculate FUP (1) (where ‘y’ stands for ‘pop’), we can derive this effect: (4)
⎡ ∂FUPit ⎤ y jt y ∂ ln yit ∂ ln FUPit =α =α ⎢ = α ( wij Dij ) −1 jt ⎥ ∂y jt / y jt ∂y jt / y jt FUPit ⎣⎢ ∂y jt ⎦⎥ FUPit
This immediately shows that looking at the coefficient on FUP, α, does not provide all information on the interaction between two particular cities i and j. It shows that this also depends (negatively) on the weighted distance between the cities, wijDij, and (positively) on the relative importance of city j in city i’s FUP. The larger city j compared to city i’s overall FUP, the larger the effect of a 1% population increase in city j on city i will be. Besides this effect of a 1% population increase in an existing city j, city i’s FUP can also increase because of newborn cities. Suppose that a new city k is ‘born’ that has K inhabitants. The effect of this on each city i will be27: ∂ ln yit (5) = α FUPit−1 ( wik Dik ) −1 ⇔ ∂ ln yit = α FUPit−1 ( wik Dik ) −1 K ∂ykt This shows that this depends (positively) on the size of the newborn city K (relative to city i’s FUP) and also (negatively) on the weigthed distance between the new city and city i. Equation (4) and (5) show that, ceteris paribus, the difference between the coefficients on Muslim-Muslim and Christian-Christian interaction can be interpreted as the difference in the degree of interdependence of Muslim and Christian cities respectively. However within our sample such a ceteris paribus increase is hard to imagine given the heterogeneity in terms of cities’ location, their population size and FUP at different points in time. To address this issue, we can use (4) and (5) to offer a more intuitive interpretation of the FUP coefficient or to illustrate the (different) effect of Muslim and Christian FUP somewhat more clearly by discussing a particular example(s): I First we show that the coefficient on FUP can be interpreted as showing the effect of a 1% increase in population in all other existing cities on a particular city i., irrespective of city i’s location, FUP or the other cities’ population size. This effect of a 1% increase in the population in all other existing cities on city i can be calculated as follows: ∂ ln yit (6) = α FUPit−1 ∑ ⎡⎣( wij Dij ) −1 y jt ⎤⎦ = α , ∑ j ≠ i ∂y jt / y jt j ≠i
27
Calculating an elasticity in this case is not impossible since the emergence of a new city cannot be translated into a % increase in that city’s population.
50
where we use that
∑ ⎡⎣(w D ) j ≠i
ij
ij
−1
y jt ⎤⎦ = FUPit .
Again we can interpret the higher coefficient on Muslim FUP as evidence of the fact that the interdependency of the Muslim cities was quite strong during the blooming period of the Arab world, even when compared to the interdependency of Christian cities during the 16th-17th centuries. The average effect of a 1% increase in one other (average) Muslim/Christian city, ⎡ ⎤ ∂ ln yit ⎤ α 1 ⎡ 1 1 1 −1 −1 (7) ⎢ ⎥ =α ∑ ∑ ∑ ⎢ FUPit ∑ ⎡⎣( wij Dij ) y jt ⎤⎦ ⎥ = n i ⎢⎣ n − 1 j ≠i ∂y jt / y jt ⎥⎦ n n −1 i ⎣ j ≠i ⎦ n −1 where again the last equality follows by noting that ∑ ⎡⎣ ( wij Dij ) −1 y jt ⎤⎦ = FUPit and n
II
j ≠i
denotes the number of cities. This shows that combining the coefficient on FUP with the number of (other) Muslim/Christian cities gives evidence on the average importance of one other Muslim/Christian city for the average Muslim/Christian city. The higher the total number of Muslim/Christian cities, the lower the average impact of a 1% population increase in only one other Muslim/Christian city. Table B8 shows that during the millennium we consider, the total number of Muslim cities doubles. This may seem a lot but it is almost nothing compared to the increase in the number of Christian cities: in 1800 the number of Christian cities is twentyfold that in 800. Taking this into account shows that the average effect of a 1% increase in only one other average city is even higher in the Muslim urban system compared to the Christian urban system than suggested by the estimated coefficient on FUP. It also means that in an urban system comprising many cities (such as the Christian one) each city is less vulnerable to a random negative population shock in another city, than in an urban system containing only few cities. In effect, the larger number of other cities ‘protects’ a city from large changes in FUP when only a single (or few) cities experience a negative population shock Table B6. year 800 900 1000 1100 1200 1300 1400 1500 1600 1700 1800
nr cities >= 10.000 average distance (km) to other city average distance (km) to nearest city Muslim Christian Muslim - Muslim Christian - Christian Muslim - Muslim Christian - Christian 25 28 1418.8 730.8 59.5 42.3 37 36 1280.1 712.9 45.4 43.2 42 70 1170.6 713.2 46.3 33.3 39 73 1234.9 705.6 65.9 27.4 34 114 1290.1 679.8 84.0 24.7 29 175 1313.6 709.5 94.6 23.5 34 125 1174.8 650.1 85.1 23.2 34 183 979.6 673.8 87.4 21.9 40 263 964.9 709.8 83.4 21.7 38 269 918.9 661.4 77.4 20.8 48 537 880.3 727.5 73.4 20.3
51
III The average effect of a ‘newborn’ city of size K. Suppose that a new city is ‘born’ having K inhabitants. The average effect of this on the existing cities will be: 1 αK ⎡⎣ FUPit−1 ( wik Dik ) −1 ⎤⎦ (8) ∂ ln yit = ∑ ∑ n i n i This shows that the average effect of a newborn city depends on the distance of this city to all other (already existing) cities and the current size of each existing cities’ FUP. Assuming each existing city’s FUP the same, (8) can be further simplified to 1 αK 1 (9) ( wik Dik ) −1 , ∂ ln yit = ∑ ∑ n i FUP⋅t n i so that average effect depends not only the coefficient on FUP but also on the average (weighted) distance of the new city to all other existing cities. In a denser urban system a new city will thus on average have a larger impact. Assuming that the new city is founded at the current average distance between Muslim or Christian cities, the effect of a the new city would, c.p., be higher in the much denser Christian urban system, compared to the more spread out Muslim urban system (see Table 4 that shows the average (weighted) distance between the existing Muslim and between the existing Christian cities) IV The average effect of a 1% increase in the population of the nearest (existing) Muslim/Christian city, i ∂ ln yit 1 α −1 ynear ,t (10) w D = ( ) ∑ i / yi ∑ i,near i,near FUP n i ∂ynear n i ,t near ,t it This shows that, for a given size of the nearest city and of a city’s own FUP, the average effect of a 1% increase in the population of the nearest (existing) city depends not only on the coefficient on FUP but on the average weighted distance to the nearest city, i.e ⋅ α ynear ,t 1 (11) ( wi , near Di ,near ) −1 ∑ FUP⋅t n i Again this shows that in a denser urban system an increase in the nearest city will on average have a larger impact. Table 4 shows the average minimum (weighted) distance for the (existing) Muslim and Christian cities respectively. This is much lower for the Christian cities so that the average impact of a 1% population increase in the nearest city will c.p. have a larger impact in case of Christian cities. VI Comparing the effect of a 1% increase in the population of Baghdad on Damascus with the effect of a 1% increase in the population of London on Paris. These effects can be easily calculated using (4) and the coefficients on Muslim/Christian FUP respectively28, they are shown in Table 5.
Table B7. year baghdad -> cairo london -> paris 800 0.000 0.103 28
We used the estimated obtained using the Latin-West and non Latin-West sample respectively.
52
900 0.002 0.079 1000 0.001 0.073 1100 0.059 0.007 1200 0.062 0.005 1300 0.017 0.005 1400 0.023 0.004 1500 0.004 0.004 1600 0.001 0.010 1700 0.004 0.017 1800 0.012 0.016 Notes: bold means significant as in Table 3
Table B8a. Total FUP – no distinction between Muslim and Christian dependent variable sample: Sea
ln city size ln city size ln city size ln city size ln city size all cities Christian Muslim latin west non latin west 0.057 0.069 -0.069 0.062 -0.032 0.362 0.260 0.711 0.316 0.886
River
0.002 0.957
-0.022 0.596
0.102 0.414
0.002 0.959
-0.023 0.824
Hub
0.074 0.201
0.093 0.093
0.057 0.721
0.114 0.052
-0.064 0.693
roman road
0.028 0.524
0.044 0.293
0.025 0.876
0.038 0.387
0.038 0.802
caravan hub
0.615 0.002
0.915 0.012
0.696 0.004
-
0.622 0.003
Caravan
0.061 0.692
0.050 0.616
0.013 0.948
-
-0.022 0.905
Bishop
0.171 0.000
0.138 0.000
0.212 0.269
0.134 0.001
0.244 0.119
Archbishop
0.455 0.000
0.457 0.000
0.335 0.076
0.458 0.000
0.363 0.022
Capital
0.830 0.000
0.802 0.000
0.718 0.000
0.815 0.000
0.789 0.000
University
0.286 0.000
0.288 0.000
-0.033 0.915
0.267 0.000
0.274 0.261
Muslim
0.337 0.000
-
-
0.405 0.000
0.287 0.002
53
foreign urban potential
0.143 0.000
0.164 0.000
0.129 0.158
0.184 0.000
0.044 0.580
Protestant
0.090 0.119
0.080 0.163
-
0.069 0.228
-
2273 0.417
1873 0.382
400 0.350
1831 0.359
442 0.448
p-value time-dummies p-value random effects nr. observations R2
Notes: p-values below the coefficients. The standard errors used to calculate the p-values are corrected for heteroscedasticity and autocorrelation. Bold faced coefficients are significant at the 5% level, and bold faced ànd italic coefficients are significant at the 10% level. p-value time-dummies denotes the p-value of an F-test on the joint significance of the century-dummies, These are never significant, so that we do not include them in our baseline estimates. p-value random effects denotes the p-value corresponding to a Breusch-Pagan test for random effects.
Table B8b. Unweighted FUP dependent variable sample: Sea River Hub roman road
ln city size ln city size ln city size ln city size all cities Christian Muslim latin west 0.236 0.269 0.285 0.107 0.000 0.000 0.000 0.540 0.086 0.085 0.054 0.113 0.044 0.047 0.182 0.387 0.110 0.073 0.088 0.048 0.060 0.212 0.108 0.746 0.027 0.049 0.033 0.045 0.552 0.243 0.832 0.305
caravan hub
0.606 0.002
0.878 0.020
0.731 0.003
-
Caravan
0.046 0.769
0.148 0.162
0.038 0.853
-
Bishop
0.169 0.000
0.143 0.000
0.203 0.270
0.141 0.000
archbishop
0.442 0.000
0.460 0.000
0.330 0.071
0.466 0.000
capital
0.828 0.000
0.809 0.000
0.817 0.000
0.818 0.000
university
0.291 0.000
0.285 0.000
0.139 0.591
0.264 0.000
Muslim
0.321 0.000
-
-
0.630 0.000
0.055
-0.050
0.429
-0.081
foreign urban potential (UNWEIGHTED) Muslim
54
0.259 0.082 0.002
0.276 0.158 0.000
0.004 -0.073 0.302
0.112 0.184 0.000
Protestant
0.124 0.034
-
-
0.067 0.245
p-value time-dummies p-value random effects nr. observations R2
0.550 0.000 2273 0.415
0.367 0.000 1873 0.386
0.787 0.000 400 0.399
0.372 0.000 1831 0.366
Christian
Notes: p-values below the coefficients. The standard errors used to calculate the p-values are corrected for heteroscedasticity and autocorrelation. Bold faced coefficients are significant at the 5% level, and bold faced ànd italic coefficients are significant at the 10% level. p-value time-dummies denotes the p-value of an F-test on the joint significance on century-dummies. These are never significant, so that we do not include them in our baseline estimates. p-value random effects denotes the p-value corresponding to a Breusch-Pagan test for random effects.
55
Table B8c. FUP with different distance penalty dependent variable sample:
ln city size ln city size ln city size ln city size all cities Christian Muslim latin west
Sea
0.161 0.016
0.224 0.000
-0.093 0.619
0.254 0.000
River
0.048 0.250
0.033 0.422
0.039 0.764
0.072 0.094
Hub
0.076 0.201
0.100 0.068
0.060 0.697
0.123 0.035
roman road
0.031 0.492
0.051 0.225
0.030 0.846
0.046 0.302
caravan hub
0.582 0.002
0.885 0.015
0.698 0.003
-
Caravan
0.033 0.828
0.105 0.305
0.006 0.978
-
Bishop
0.174 0.000
0.143 0.000
0.208 0.253
0.143 0.000
Archbishop
0.437 0.000
0.449 0.000
0.349 0.058
0.454 0.000
Capital
0.834 0.000
0.803 0.000
0.781 0.000
0.814 0.000
University
0.289 0.000
0.282 0.000
0.096 0.741
0.258 0.000
Muslim
0.317 0.000
-
1.338 0.135
0.541 0.000
0.037 0.660 0.071 0.038
-0.113 0.159 0.167 0.000
0.448 0.071 -0.099 0.264
-0.175 0.037 0.199 0.000
0.130 0.025
0.097 0.089
-
0.087 0.134
2273 0.414
1873 0.382
400 0.378
1831 0.361
foreign urban potential (SQRT) Muslim Christian
Protestant p-value time-dummies p-value random effects nr. observations R2
Notes: foreign urban potential (SQRT) denotes the foreign urban potential calculated using the following distance function: (wijDij)-1.
56
Table B9. Free/prince variable and sea(s) in more detail dependent variable sample: Atlantic Mediterranean Baltic / North Sea River Hub roman road caravan hub Caravan Bishop Archbishop Capital University Muslim foreign urban potential Muslim Christian
Protestant free/prince DLS 800-1500 1600-1800 p-value time-dummies p-value random effects nr. observations R2
ln city size all cities 0.151 0.059 -0.069 0.476 -0.038 0.816 -0.015 0.733 0.064 0.272 0.034 0.465 0.587 0.002 0.090 0.560 0.169 0.000 0.445 0.000 0.835 0.000 0.289 0.000 0.271 0.001
ln city size Christian 0.164 0.048 0.038 0.697 0.003 0.984 -0.028 0.533 0.085 0.119 0.048 0.251 0.892 0.016 0.128 1.190 0.141 0.000 0.461 0.000 0.815 0.000 0.286 0.000 -
ln city size latin west 0.173 0.036 0.013 0.899 0.034 0.836 -0.003 0.948 0.110 0.062 0.045 0.311 0.138 0.000 0.464 0.000 0.825 0.000 0.263 0.000 0.555 0.000
0.128 0.012 0.060 0.025
0.013 0.798 0.142 0.000
0.008 0.879 0.163 0.000
0.105 0.087
0.079 0.191
0.063 0.301
0.114 0.003 0.062 0.126
0.085 0.030 0.030 0.455
0.099 0.007 0.034 0.382
2273 0.422
1873 0.388
1831 0.369
Notes: p-values below the coefficients. The standard errors used to calculate the p-values are corrected for heteroscedasticity and autocorrelation. Bold faced coefficients are significant at the 5% level, and bold faced ànd italic coefficients are significant at the 10% level. p-value time-dummies denotes the p-value of an F-test on the joint significance on century-dummies. These are never significant, so that we do not include them in our baseline estimates. p-value random effects denotes the p-value corresponding to a Breusch-Pagan test for random effects.
57
Table B10.
Free prince and country-dummies
dependent variable sample: Sea River Hub roman road caravan hub Caravan
ln city size ln city size ln city size all cities Christian latin west 0.000 0.018 0.021 0.999 0.827 0.810 -0.073 -0.097 -0.073 0.177 0.074 0.206 0.117 0.112 0.126 0.030 0.045 0.036 0.079 0.073 0.074 0.062 0.104 0.105 0.482 0.769 0.008 0.030 0.052 0.039 0.815 0.809 -
Bishop
0.139 0.000
0.178 0.000
0.184 0.000
archbishop
0.386 0.000
0.465 0.000
0.478 0.000
capital
0.930 0.000
0.863 0.000
0.877 0.000
university
0.305 0.000
0.309 0.000
0.283 0.000
Muslim
0.249 0.005
-
0.489 0.000
0.117 0.045 0.074 0.005
0.046 0.447 0.153 0.000
0.043 0.504 0.151 0.000
0.152 0.021
0.127 0.052
0.128 0.049
0.135 0.001 0.092 0.033
0.126 0.002 0.076 0.074
0.118 0.002 0.076 0.071
0.000
0.000
0.000
2273 0.482
1873 0.425
1831 0.399
foreign urban potential Muslim Christian
protestant
free/prince DLS 800-1500 1600-1800
p-value country dummies p-value time-dummies p-value random effects nr. observations R2
58
Table B11.
Free prince and fixed effects
dependent variable sample:
ln city size ln city size ln city size all cities Christian latin west
Bishop
-0.089 0.512
-0.101 0.399
-0.073 0.503
Archbishop
0.241 0.075
0.286 0.093
0.330 0.028
Capital
0.601 0.000
0.456 0.000
0.522 0.000
University
0.221 0.008
0.192 0.020
0.191 0.018
Muslim
0.038 0.678
-
0.426 0.001
0.246 0.000 0.211 0.000
0.122 0.092 0.322 0.000
0.104 0.117 0.318 0.000
0.085 0.445
0.044 0.683
0.049 0.656
0.081 0.074 0.062 0.222
0.101 0.048 0.057 0.267
0.071 0.115 0.045 0.369
yes
yes
yes
2273 0.135
1873 0.154
1831 0.195
foreign urban potential Muslim Christian
protestant
free/prince DLS 800-1500 1600-1800
CITY FIXED EFFECTS p-value time-dummies p-value random effects nr. observations R2
59