From Baghdad to London Unraveling urban development in Europe and the Arab World, 800-1800 Maarten Bosker*‡ Eltjo Buringh* Jan Luiten van Zanden*
< THIS VERSION: FEBRUARY 2010 >
“The more numerous and the more abundant the population in a city, the more luxurious is the life of its inhabitants” Ibn Khaldûn (c. 1375) Abstract This paper empirically investigates why, between 800 and 1800, the urban center of gravity moved from the Arab World to Europe. Using a large new city-specific dataset covering both Europe and the Arab World, we find that the main reasons for the Arab World’s stagnation and Europe’s long-term success are specific to each region. Any significant interaction between the two regions being hampered by their different main religious orientation (Muslim vs. Christian). Together, the long-term consequences of a different choice of main transport mode (camel vs. ship) and the development of local authority in Europe that made cities less dependent on the state, explain why Europe eventually managed to overtake the Arab World.
*
Utrecht University, Socio-Economic History Research Group, Drift 10, 3512BS Utrecht, The Netherlands. University of Groningen. Authors’ email:
[email protected],
[email protected], or
[email protected] respectively. We thank the participants of seminars and workshops in Oxford, London (Ontario), Utrecht (School of Economics and Research Group Economic History), Groningen, Savannah (North American Regional Science Conference), Edinburgh (World Congress of Cliometrics), Milan (European Economic Association Conference), Krakow (CEPR Economic History conference), Passau (New Economic Geography conference) and the Netherlands Bureau for Economic Policy Analysis for their comments and suggestions. In particular we are grateful to Bob Allen, Bas van Bavel, Klaus Desmet, Stephan Epstein, Price Fishback, Harry Garretsen, Knick Harley, Jane Humphries, Peter Koudijs, Esteban Rossi-Hansberg, Jeremy Johns, Kevin O’Rourke, Maarten Prak, Sevket Pamuk, Joppe de Ree, Mark Schramm, Bas ter Weel, and Patrick Wallis for their feedback on earlier drafts of this paper. An earlier version of this paper appeared as CEPR working paper 6833. ‡
1
1. Introduction In 800, only four decades after its foundation, Baghdad had become a metropolis of more than three hundred thousand inhabitants. As the capital of the mighty Abbasid Caliphate that stretched from present-day Algeria to Pakistan, it was the center of economic and political power in the Islamic World, unrivalled in its artistic, scientific and cultural achievements. To this splendor, London stood in sharp contrast. In 800 it had no more than ten thousand inhabitants and was continuously plagued by internal struggles between Anglo-Saxon tribes or marauding Vikings. Who could have thought that a thousand years later the two cities’ roles were to be completely reversed? Baghdad, following the demise of the Abbasid Caliphate, had lost her prominent position in the Arab World, becoming an unimportant town in the Ottoman Empire. London, on the other hand, had become a thriving metropolis of almost one million inhabitants. As capital of the British Empire, it was the economic and political center of the world, offering unprecedented prosperity to its inhabitants. As the English writer Samuel Johnson noted in 1777: “there is in London all that life can afford”. Baghdad and London exemplify the divergent development of Europe and the Arab World. In 800 the Arab World was, in virtually all respects, more advanced than Europe. Following the rapid spread of Islam over the Middle East, North-Africa, Spain and Central Asia, the Arab World enjoyed a period of unprecedented economic, scientific, and cultural development: the Islamic Golden Age (see e.g. Hourani, 2002; Kennedy, 2007). At the same time Europe was a backwater in the world economy. After the demise of first the Roman and subsequently the Carolingian Empire, Europe underwent a period of economic stagnation or perhaps even decline (see Pirenne, 1969; Davis, 1955). In the following centuries however, economic development in the Arab World stagnated, whereas Europe slowly, but steadily, closed the gap with the Arab World, and eventually overtook the Arab World in economic, as well as scientific, achievements (see e.g. Greif, 2006 or Hourani, 2002). This paper focuses on this reversal of fortunes. Several hypotheses have been put forward that explain the rise of Europe and the decline, or stagnation, of the Arab World. But, given the lack of sufficient data, these have never been verified empirically. We fill this gap in this paper. By virtue of a newly collected data set covering both Europe and the Arab World over the period from 800 to 1800, we are the first to provide empirical results that deliver insights into the most important driving factors behind the divergent long-term development of Europe and the Arab World. In particular, our contributions are twofold:
2
First, we present new city-specific data on urban development in Europe and the Arab World during the Medieval and pre-Modern periods (800-1800)1. On the one hand, our new population data for cities in the Arab World make it possible to quantify the trends in urban (economic) development in North Africa, the Middle-East and Turkey. On the other hand, and complementary to the size of each city, our data set contains new information on a wide range of city-specific geographical, institutional and religious characteristics, both for all European and for all Arab cities. This makes it possible to relate the different long-term urban development in Europe and the Arab World to (differences in) the underlying characteristics of the cities in each of the two regions. This is exactly the second contribution of our paper. By virtue of our newly collected data, we relate the observed urban development in the two regions to various geographical, institutional and religious features of individual cities by means of simple regression analyses. This allows us to empirically assess the relevance of two of the most prominent explanations for the reversal of fortunes between Europe and the Arab World proposed in the historical (economic) literature: geographical conditions and institutional developments. Moreover, we provide evidence into the alleged interdependence of developments in the two regions that has been stressed in the literature. Overall, we are the first to give an empirically consistent account of the main drivers behind Europe’s rise and the Arab World’s economic stagnation. We show that Europe and the Arab World constituted two largely separate urban systems, each with a different structure and long-term evolution and with little evidence of any significant structural interaction (negative or positive) between the two regions across religious lines. In both regions geography and institutions played an important role in determining the character and evolution of urban development, but very differently so. In particular, the institutions restricting the (dominant) role of the state that do develop in Europe but not in the Arab World, in combination with the long-term consequences of their different choice of main transport mode (camel vs. ship), have mainly driven the reversal of fortunes between the two regions. Together they explain why the urban center of gravity shifted from the Arab World to Europe, making London, instead of Baghdad the largest, most important, city in this part of the world.
1
Data on urban development is among the few more or less reliable data available for the pre-industrial age. Much of the recent work on long-term trends in economic performance in the pre-industrial era uses estimates of the number and size of cities and/or urbanization rates as indicators of the economic success of regions or countries (De Vries, 1984; Bairoch, 1988; De Long and Shleifer, 1993; or Acemoglu et al. 2005).
3
2. Europe’s rise and the Arab World’s stagnation – the theoretical debate Many explanations for Europe’s rise and the Arab World’s stagnation have been posited in the, largely narrative, theoretical (economic) history literature (see e.g. Pirenne, 1969; Landes, 1998; Greif, 2006; or Hourani, 2002). The two most prominent ones are geographical conditions on the one hand, and institutional developments on the other hand. Moreover, oftentimes the (negative) interdependence of the developments in the two regions is stressed.
2.1 Geography The geographical conditions in the two regions are argued to have influenced their long-term urban prospects in two important ways. First, geography plays an important role in determining a city’s ability to participate in profitable (long-distance) trade with other cities and its immediate hinterland. Trade is widely viewed as one of the important drivers of economic prosperity in both the Arab World as well as in Europe (Lopez, 1976; Greif, 2006; Findlay and O’Rourke, 2007). A favorable geographical location for trade can thus be a substantial stimulus for economic and urban development (see e.g. Fujita and Mori, 1996; Acemoglu et al., 2005; Gallup et al., 2001). Europe’s abundance of navigable rivers, favorable location for Atlantic trade, and its many natural ports have all been stressed as having played an important part in its long-term economic development. However, Mediterranean trade also flourished in the Arab World during the Golden Age of Islam when the Mediterranean, with the exception of the Eastern parts controlled by Byzantium, could be considered a ‘Muslim lake’. Also, the absence of navigable rivers, particularly in Northern Africa2, was more than compensated by the efficient caravan routes connecting Morocco, India, Sudan, Egypt and Western Africa by camel, “the ship of the desert”. Moreover, due to its geographical position in between Europe, Asia and Africa, the Arab World not only had easy access to the products of three different continents; it also enjoyed a natural, and very profitable, position as ‘middleman’ (Findlay and O’Rourke, 2007 p.15). The other important role of geography is in determining the two region’s agricultural potential. A more productive hinterland is generally able to sustain higher levels of (urban) population. Agricultural conditions in the Arab World are usually believed to be much
2
Anatolia, and the Nile and Euphrates and Tigris river systems offered abundant opportunities for river transport.
4
worse3 , posing stronger limits on urban expansion than in Europe. Recently however, the relationship between urban expansion and agriculture is somewhat debated. Although some preconditions for agricultural production have to be met, agricultural systems appear to be very flexible, and able to generate substantial surpluses when urban demand is sufficiently high4 (Grantham 1999; Hoffman, 1996). Europe’s agricultural ‘revolution’, one of the alleged important drivers of its urban (and economic) expansion during the Middle Ages (Mokyr, 1990; Duby, 1974), may itself be partly driven by increased urban demand (Hohenberg and Lees, 1995) 5. In this respect, Europe’s agricultural revolution is also not that unique from agricultural developments in the Arab World. There (see e.g. Watson, 1983 and White, 1962), an Arab agricultural ‘revolution’ happened following the rapid spread of Islam in the eighth century. The main urban centers in the Arab World were very innovative in the use of complex systems of water-management for agriculture, and in experimenting with new, more productive, crops (Wittfogel, 1957; Watson, 1974), enabling them to sustain large urban populations.
2.2 Institutions An important recent different line of literature instead stresses the institutional developments in Europe and the Arab World as the most important driver of their different long-term development (North and Thomas, 1973; Greif, 2006). Kuran (2003, 2005) and Greif (2006) for example argue that the Arab World’s relative decline has its roots in its inability to develop institutions favoring market exchange that were more or less independent from the state (see also Cahen, 1970 p.520; Goitein, 1973, or Hodgson, 1974). Throughout the Arab World, power was generally concentrated in the hands of a strong state, favoring the economic interests of a small group of elites (the ruler and its central bureaucracy). This made (economic) stability and development more dependent on the state (see e.g. Pamuk, 2004 or 2008; Landes, 1998; Kennedy, 2002): political instability or a faltering state (due to e.g. internal instability or external threats) easily translated into stagnating or declining
3
The desert-type conditions that spring to mind when thinking of the Arab World can however easily hide the fact that some of the most fertile regions are actually found in the Arab World, especially in the river valleys of the Nile, Euphrates and Tigris. In Roman times, Egypt and Tunisia were major foodbaskets of the Empire; Egypt remaining the main supplier of grain to the Byzantine Empire until the Arab Conquests (Teall, 1959). 4 “Among the merely probable economic outcomes of urbanization, the most important appears to have been the promotion of improved methods of agriculture. … The improvements in agriculture … certainly owed something, and maybe a great deal, to urban expansion.” (Bairoch, 1988 p.202). 5 “the question is whether large agricultural surpluses hastened the expansion of cities or whether sophisticated commercial farming was stimulated by urban demand, financed by merchant capital, and managed for profitminded landlords by literate bailiffs or farmers” (Hohenberg and Lees, 1995, p.72)
5
economic activity. Similarly, the roots of Europe’s rise are found in the specific institutions, emerging from the late Middle Ages onwards, by which cities managed to constrain the power of the state (see e.g. Weber 1922 or 1958; North, 1981; or more recently Greif, 2006). In Europe, which was politically highly fragmented following the demise of the Carolingian Empire, cities start to develop forms of local authority and demand representation in national policymaking. This process, which started around 1100 in the cities of Spain, Italy and Flanders, spreads over Europe in the following centuries (Van Zanden et al., 2010) and is widely viewed as a strong stimulus for economic development (see e.g. DeLong and Shleifer, 1993 or Acemoglu et al., 2005).
2.3 Interdependence of the developments in Europe and the Arab World The two above-discussed alleged main geographical and institutional drivers of the divergent development of Europe and the Arab World are both specific to each region. As such, they treat the developments in the two regions as largely separate processes. Many authors however argue that the rise of Europe and the relative decline of the Arab World were intertwined. In particular, these authors mostly see a negative correlation between developments in Europe and the Arab World, arising to a very large extent from the religious divide between the two regions (Pirenne, 1969; Glick, 1979; Greif, 2006). Proponents of this view partly attribute Europe’s decline following the fall of the Roman Empire to the rise of the Arab World. The rise of Islam resulted in Muslim dominance of the Mediterranean and the trade routes to Asia. This disrupted Europe’s trade with the outside world that since Roman times had been heavily focussed towards the Mediterranean6 (Pirenne, 1969 or Bairoch, 1988, but see also McCormick, 2001 for a critical discussion). It also made Christian cities along the Mediterranean seaboard very vulnerable to attacks and slave raids by Muslim pirates (Pirenne, 1969), even resulting in the Christian loss of most notably Spain and Sicily, two economically very important regions (Hourani, 2002).
6
“While Ibn Khaldun … may have been exaggerating when he claimed that the Christians were no longer capable of launching so much as a plank on the Mediterranean, it is certain that Europe’s trade with the outside world underwent a considerable reduction. This is evidenced in particular by the increasing rarity in European cooking and pharmacy of products of the Middle East and Asia, spices being especially notable for their absence. Further indication of this reduction in the flow of trade lies in the growing scarcity of silks and the consequent rise in their price. It is also found in the disappearance of paper, which had to be replaced by parchment. … the cause lay in increasing Muslim control over the Mediterranean due to the spread of Islam.” Bairoch (1988, p.110/111)
6
Similarly, Europe’s overseas expansion following the Great Discoveries of the fifteenth and sixteenth centuries is oftentimes viewed as one of the main drivers behind the relative decline of the Arab World. The European discovery of the direct route to India and China made the ‘Arab middleman’ obsolete. It sidetracked the main Arab trading routes causing the Arab World to lose what had been a very lucrative trade in spices, silk and gold. Europe on the other hand profited strongly from the discovery of the direct route to Asia’s markets. It provided direct access to previously unaffordable luxuries, boasting trade (both with the East, but also, indirectly, within Europe). Also, the discovery of the ‘New World’ resulted in a huge influx of wealth, as well as providing Europe with vast amounts of new lands that were soon colonized and turned into productive use (Findlay and O’Rourke, 2007; Pomeranz, 2000).
2.4 Many theories, yet lack of empirical evidence Surprisingly, very little direct empirical evidence is available to back up the different claims made by the proponents of the above-outlined theories regarding the divergent development of Europe and the Arab World. Data unavailability is, in our view, largely to blame for this. This is exactly where the main contribution of our paper lies. In the next section we present a large, newly collected, city-specific data set covering the cities in both Europe and the Arab World over the period 800-1800. Using this data set we can not only quantify the very different long-term urban developments in the two regions (confirming their ‘reversal of fortunes’). But, because our data set also contains detailed information on various important geographical, institutional and religious characteristics of each individual city, we are also able to shed a first empirical light on the (relative) importance of the prominent explanations for the different long-term urban developments in Europe and the Arab World proposed in the historical (economic) literature.
3. Dataset of cities in Europe and the Arab World over the period 800-1800 Given the important contribution of our newly collected data, we give an overview of the city-specific variables that form the basis of our later empirical analyses. To not distract the reader too much from the main line of argumentation, we go into much more depth regarding the exact collection of this data in our Data Appendix.
3.1 City population Our main source for the population size of European cities is the dataset published by 7
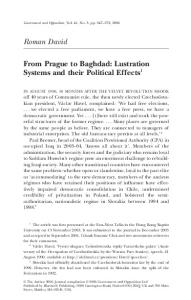
Bairoch et al (1988). It provides population estimates for a total of 664 European cities having more than ten thousand inhabitants in at least one of the centuries during our sample period7. For the Arab World8, no comprehensive data existed on the size of cities in the preindustrial age. We fill this gap, and have systematically collected information on the size of cities in the Arab World on the same centennial basis as Bairoch et al. (1988), resulting in centennial population estimates for 88 cities in the Arab World. Figure 1 maps all the cities in our sample:
Figure 1
All cities in our sample
Notes: each (red) dot represent a city that at least in one century during the period 800-1800 had more than ten thousand inhabitants.
3.2 City-specific geographical, institutional and religious characteristics Besides each city’s population, we have collected various city-specific characteristics. Corresponding to the three main theories discussed in section 2, they are related to either a city’s geographical conditions, its institutional characteristics, or they can be used to assess the evidence for any possible interdependence between urban developments in Europe and the Arab World.
7
Following e.g. De Vries (1984) and Acemoglu et al. (2005) we focus on cities larger than 10,000 inhabitants only. Because of the gradually increasing population and urbanization, the number of cities included in the analysis, grows continually from 54 in 800 to 637 cities in 1800. These numbers are 32 and 22 in 800 and 583 and 54 in Europe and the Arab World respectively. It leaves us with an unbalanced sample of cities. We discuss, and (partly) address, any ‘selection-bias’ issues that may result from this in Section 4.3 and Appendix A. 8 The Arab World comprises the Maghreb and the Levant, consisting of North Africa, the Middle East, inclusive of Iraq, but excluding Iran and other countries to the east of Iraq. It also includes Turkey (which is in principle not an Arab nation – see also Hourani, 2002).
8
3.2.1 Geography Our geographical characteristics concern a city’s opportunities for long distance trade, as well as the agricultural potential of its immediate hinterland. We distinguish between its opportunities for water- and land-based transportation respectively. As an indication of a city’s potential for water-based trade, we document whether or not a city is located at sea, and whether or not it is located on a navigable waterway. We also further distinguish location at sea in location on the shores of the Atlantic, Mediterranean, and Baltic respectively. As an indication of a city’s potential for land-based transportation we document if a city was located on a Roman road or a hub of Roman roads (at least two Roman roads meeting) on the one hand, and if it was located on one of the main caravan routes that criss-crossed the Arab World on the other hand (again also documenting whether it was a hub of caravan routes, i.e. at least two caravan routes meeting). The system of Roman roads is argued to have played an important role in trade long after the withering of the empire itself9. An advantage of using Roman roads is the uniformity in their definition across Europe and the Arab World. Both were part of the Roman Empire, so that Roman roads constructed using similar methods and adhering to uniform quality standards, can be found throughout both regions. Additionally, using location on a Roman road or a hub of Roman road avoids some of the reverse causality issues that could arise when using actual roads (i.e. roads being built to the larger urban centers instead of location on a road favoring subsequent urban expansion). In the Arab World, trade on camel back quickly became the main mode of longdistance transport following the Arab Conquests (Hourani, 2002; Rostovtzeff, 1971), carrying goods from West-Africa to Baghdad to India. Concerns regarding the endogeneity of these caravan routes are also limited as their actual location remained more or less unchanged. The number of potential routes was limited by the availability of water in the form of oases, wells, or (underground) rivers [Libya’s desert was for example impassable due to the lack of oases and fierce sandstorms (Lewicki, 1994)]. Our main city-specific indicator capturing the agricultural potential of a city’s hinterland, is a set of six dummy variables indicating the maximum potential land productivity of its surrounding countryside. These dummy variables draw upon Buringh et al. (1975), that classifies the world’s landmass into six different categories based on their 9
Glick 1979, p.23 gives several examples of policies by medieval Spanish states and cities to maintain the system of Roman roads. See also Bairoch (1988, p.110).
9
agricultural potential10. Figure A1 in the Data Appendix shows the geographical distribution of these categories in both Europe and the Arab World. It ranges from the superb agricultural potential of the Nile, Po, and Euphrates and Tigris River valleys to the dismal agricultural conditions in the Sahara, the Pyrenees, or the Alps. Apart from this variable, we also collected two additional proxies of a city’s agricultural potential, namely its latitude and its elevation above sea level.
3.2.2 Institutions Previous empirical contributions focusing on Europe’s long term economic development (Acemoglu, et al. 2005; De Long and Shleifer, 1993) have predominantly focused on institutional developments at the country level. They define European countries along their 1990-boundaries and construct several institutional indicators for each of the thus defined countries for the late medieval and early modern period. We aim to improve on these measures by collecting institutional information at the individual city level. Given that most countries did not exist in their 1990-form for many (or even all) centuries of our sample period (e.g. Italy, Germany, Belgium, Turkey or Iraq), using these 1990-boundaries not always does full justice to the actual institutional developments. We have collected six cityspecific indicators that aim to improve on these country-wide measures11. The first three document a city’s status in the political and ecclesiastical hierarchy. They indicate whether or not a city is a capital city, a bishopric or an archbishopric in each of the centuries in our sample. Being important seats of power, these cities tended to attract people and economic activity on the basis of the presence of the sovereign or (arch)bishop and his/her court. Their economic basis was strongly dependent on its political or ecclesiastical role, providing services – administration, protection – in return for taxes and land rent12. Commercial activity did of course take place, but this function was to a large extent secondary, only derived from its political, ecclesiastical or military role, and unable to
10
An advantage of this particular study is that it explicitly focuses on the agricultural potential of each part of the world on the basis of soil quality, climatic conditions, etc. instead of looking at actual production. 11 We will also use the country-wide variables collected by Acemoglu et al. (2005) and De Long and Shleifer (1993), and compare them, and their effect on urban development, to that of our newly collected city-specific variables. 12 Many examples exist of relatively small cities, such as Turin, Madrid, Damascus, Fez, Cairo, Copenhagen, Bern, Moscow, Avignon that experienced strong urban growth only following their designation as a capital city or as an important religious center. Also, cities losing their capital or (arch)bishop status oftentimes withered (Bairoch, 1988; Hohenberg and Lees, 1995; Bosker et al., 2008).
10
provide the city with an economic basis of its own that justified its size13. We define whether or not a city was a capital city in each of the centuries in our sample based on the maps of the different political entities and their capitals in the historical atlases by McEvedy (1977a,b). And, as indicators of a city’s importance within the Catholic or Eastern-Orthodox Church, we construct two dummy variables that indicate whether or not a city was a bishopric or an archbishopric based on Jedin et al (1980). As both Europe and the Arab World shared a common Christian heritage, these (arch)bishoprics are found throughout both regions. The nature of the Islamic faith, lacking a structured religious organization like that of the Roman Catholic or Eastern Orthodox Church, does not readily lend itself to a classification of Muslim cities according to their relative religious importance. Besides these three variables indicating a city’s political or ecclesiastical importance, we also constructed two variables that, each differently, capture the institutional developments in Europe that have been claimed to be the important drivers of Europe’s longterm success (Greif, 2006; De Long and Shleifer, 1993). First, we document for each city whether or not it had a degree of local authority, indicated by the presence of a local urban participative organization that decided on local urban affairs. Our second variable indicates whether or not a city belonged to a political entity where cities could participate in the political process by having representatives in an active parliament. This variable is taken from Van Zanden et al. (2010) that documents the rise (and fall) of parliaments in Europe from 1188 onwards. Interestingly, both processes (cities gaining a degree of local authority or gaining influence in national policy making), never take place in the Arab World (Cahen, 1970). There political power remained firmly concentrated in the hands of the sovereign and his central bureaucracy (see e.g. Pamuk, 2004 or 2008; Landes, 1998; Hourani, 2002). Finally, we established for each city whether or not it was home to a university. As centers of higher learning and scientific progress, attracting students and academics alike, their impact on economic development is viewed as important, although doubts have been expressed on their impact on the local urban economy14. The earliest universities (see e.g. Huff, 2003) are actually found in the Arab World (Baghdad, Fez and Cairo). In Europe universities start to appear from about the twelfth century onwards.
13
In the words of Max Weber (1922, 1958) these cities were oftentimes typical consumer cities. He contrasted the industrial or producer cities of Medieval Europe with the consumer cities of Antiquity, a distinction that has been rather fruitful, both for understanding the economic history of Antiquity and that of the Middle Ages (Finley, 1985). 14 “While it is true that universities contributed a great deal to urbanization, they nevertheless rarely constituted poles of urban growth themselves” (Bairoch, 1988 p.190).
11
3.2.3 Cities’ interaction – across and within religious lines Finally, we verify the existence of any positive or negative interaction between cities in the two regions. In doing so, we take the religious divide between Europe and the Arab World as our starting point. Until the eighth century Christianity was the dominant religion throughout both regions. This changed drastically with the Arab Conquests when the Arabs established a vast Islamic Empire in only a few decades time (Kennedy, 2007). The resulting religious divide is blamed for creating a significant barrier for interaction between Europe and the Arab World (Pirenne, 1969; Glick, 1979; Greif, 2006): either directly by causing misunderstanding and violence, or indirectly by driving institutional, legal, cultural or political differences between the two regions. To infer whether urban developments in the two regions are to some extent interdependent or not, we combine each city’s own religious orientation with information on their relative location to other cities of the same or of a different religious orientation respectively, and construct its so-called Muslim and Christian urban potential. These two variables measure the extent of Muslim or Christian urban development in its vicinity15. In particular, and based on the definition of urban potential in De Vries (1984)16, we define city i’s Muslim or Christian urban potential as the distance weighted sum of the size of all other Muslim or Christian cities respectively:
(1)
n pop n pop jt mus jt chr I jt UPijtmus = ∑ I jt , and UPijtchr = ∑ j ≠i j ≠i Dij Dij
where popjt is the population of city j at time t, Dij is the great-circle distance between city i mus and city j that we calculated on the basis of their respective coordinates, and I chr are jt and I jt
dummy variables taking the value 1 when city j’s religious orientation at time t is Christian or Muslim respectively and zero otherwise. We document whether a city belonged to the Muslim or Christian sphere of influence using mainly Jedin et al (1980). Especially in the Iberian Peninsula, Italy (Sicily and Sardinia), the Balkans and Turkey (former Byzantine Empire), and the Middle East during the crusades, the main religious orientation shifted 15
Besides these two urban potential variables, we have also constructed several other variables that measure the vicinity and size of other nearby cities in a slightly different manner, e.g. the distance to the nearest Muslim or Christian city or (dummy) variables indicating the presence, number, or size, of Muslim or Christian cities within certain specified distance bands from each city (see Table A3 in Appendix A). 16 Different from De Vries (1984), we do not include own city population when calculating urban potential, because we are interested in the effect of developments in the urban system around a city, i.e. in other cities, on the development of the city itself.
12
between Muslim and Christian or vice versa during our period of analysis. By constructing Muslim and Christian urban potential separately we can assess whether a city’s own urban success is positively or negatively correlated to the urban success of other nearby cities of the same or of a different religious denomination. A positive correlation suggests that cities benefit from each others’ presence: interaction between cities is positive, better access to other cities’ markets stimulates urban development. A negative correlation instead would suggest that cities are crowding out each other, competing over taxes, food or other resources from their hinterlands, or even openly fighting each other17.
4. Unraveling the main drivers of urban development in Europe and the Arab World 4.1 Reversal of fortunes - trends in urbanization and the largest urban centers We start our empirical analysis by briefly describing the difference in urban development in Europe and the Arab World. Figure 2 depicts the evolution of each region’s urban population and urbanization rate over the 800-1800 period. It confirms the shift in the urban centre of gravity from the Arab World to Europe.
10
15
Figure 2. Urban development in the Latin-West and the Arab World
Latin West
4
Latin West
5 10 urban population (mln)
urbanization rate (%) 6 8
Arab World
0
2
Arab World 800
900
1000 1100 1200 1300 1400 1500 1600 1700 1800 urbanization
urban population
Notes: The numbers of inhabitants in millions of persons in the different countries for the eleven time periods of our analysis, needed to calculate urbanization ratios, are taken from McEvedy and Jones (1979).
In 800, the urban population in the Latin West is about 650,000, only half that of the Arab
17
Note that one has to be careful in interpreting these correlations as such. Especially a positive correlation may just as well indicate that all cities are subject to similar geographically clustered processes driving urban expansion. Statistically controlling for other (observed and unobserved) explanations for urban expansion is therefore quite important for the interpretation of these correlations.
13
World18. In the next 1000 years Europe’s urban population however increases more than twentyfold to almost 15 million, whereas it less than doubles in the Arab World (from 1.4 to 2.1 million)19. The evolution of the two regions’ urbanization rates shows a slightly different, yet quite similar pattern. In 800 the Arab World’s urbanization rate of around 7.5% is over three times that in Europe. The Latin West however shows a continuous, steady increase in its urbanization rate between 800 and 1800. The Arab World’s urbanization rate shows a more stagnating pattern over this period, so that in 1800 Europe has also overtaken the Arab World in its degree of urbanization20. Finally, Table A2 in Appendix A also confirms Europe’s rise when looking at the geographical distribution of the largest individual cities. Until 1200 virtually all of the largest cities are located in the Arab World (Baghdad, Damascus, Cairo, Cordoba). This starts to change around 1300 (with the rise of Paris, Venice, and Naples). From 1600 onwards European cities dominate the top five, and in 1800 London has become the largest city in this part of the world.
4.2
Unraveling the city-specific drivers of urban development
As our first step towards uncovering the most important (city-specific) drivers of this very different long-term urban development in Europe and the Arab World, we estimate the following simple linear regression model (see also Acemoglu et al., 2005). This provides us with our baseline results. They already reveal several interesting differences in the underlying determinants of urban development in the two regions, that we subsequently further refine in 18
In this section, we define Europe as the Latin West (see also Findlay and O’Rourke, 2007). The Latin West comprises Europe to the west of the line between Trieste and St. Petersburg. This line is well known from the literature on the European Marriage Pattern (see Hajnal 1965); it also largely coincides with the border of the Catholic Church during the Middle Ages. As such the Latin West comprises Norway, Sweden and Finland, Poland, Germany, the Czech Republic, Belgium, Luxembourg and the Netherlands, France, Great Britain, Ireland, Switzerland, Austria, Hungary, Italy, and Portugal and Spain. We define (see Hourani, 2002) the Arab World as Turkey, the Middle East (Lebanon, Israel, Jordan, Syria and Iraq) and North Africa (Egypt, Libya, Tunisia, Algeria and Morocco); it excludes the areas under the Arab sphere of influence in Central Asia. These definitions of Europe and the Arab World coincide with the boundaries between the Muslim and Christian sphere of influence during the later centuries in our sample only. In the next section, we will also employ a definition of Europe and the Arab World based on the actual (changing) religious boundaries. 19 This is consistent with the detailed discussion of the general demographic trends in the Middle East between 800 and 1500 in Ashtor (1976). 20 At a finer geographical scale there are also regional differences within the Arab World and the Latin West respectively (see Table A1 in Appendix A). Iraq is the most urbanized region during the 800-1300 period, with a for that period unrivalled urbanization rate of about 20% - even reaching 30% in 900 - (see Ashtor (1976 p.8991) for a discussion of the high level of urbanization in ninth/tenth century Iraq). But also in Syria, Palestine and Egypt a relatively large share of the population resides in cities. In Europe, urbanization rates before 1100 are very low in comparison, with only (Islamic) Spain coming close to a comparable level of urbanization as in the Arab World. However, starting in Italy (from about 1100 onwards) and the Low Countries (after 1200), areas of high urbanization also begin to develop in Europe, culminating with Great Britain, although a relatively late urbanizer, becoming the most urbanized country in 1800.
14
sections 4.5 and 4.6.
(2)
ln popit = α i + X i β + X it γ + ε it
where popit is the population of city i at period t, Xi are city-specific variables that do not change over time, Xit are city-specific variables that do vary over time and εit is a disturbance term that we allow to exhibit both autocorrelation and heteroskedasticity. In our baseline specifications αi denotes a city-specific random effect that is uncorrelated with the regressors21. The estimated coefficients on the included city-specific variables, β and γ are our main point of interest. The city-specific explanatory variables that are included in our baseline model can be grouped into three different categories, each corresponding to the three main explanations for Europe’s rise and the Arab World’s stagnation posed in the (economic) history literature (see section 2.1, 2.2, and 2.3): geographic characteristics that do not vary over time (Xi), institutional features that do vary over time (Xit), and our two urban potential variables (see equation 1) that also vary over time and by which we aim to find evidence regarding any possible interaction between the two regions across religious boundaries. Besides showing the results when considering all cities in the sample, we distinguish four different subsamples of cities that allow us to verify possible differences in the main determinants of urban development in Europe and the Arab World respectively. These subsamples are based on two different ways to assign cities to the European and Arab sphere of influence. The first uses the same22 (simple) geographical definition of Europe and the Arab World as the one used in Figure 2. This purely geographic definition does not change over time. It has the disadvantage that it classifies many cities as part of the Latin-West (e.g. Cordoba, Palermo, Seville) or as part of the Arab World (e.g. Constantinople, Antioch, or Jerusalem) that, based on their religious orientation, would sometimes for many centuries fall much more under the Arab or European sphere of influence respectively. For this reason, we also employ a second division of the total sample that is based on the actual (changing) religious boundaries between the two regions. This religious criterion arguably provides a better classification of cities into those belonging to the Arab and
21
In subsequent robustness tests we also allow αi to be a city-specific fixed effect but this comes at the cost of being unable to say anything about the time-invariant city-specific variables in our regressions 22 One small exception is the addition of the cities in South-Eastern Europe (Yugoslavia, Albania, Rumania, Bulgaria and Greece) to the non Latin-West.
15
European sphere of influence respectively. At the beginning of our sample period these religious boundaries are quite different from our other, geographically fixed, boundaries, with Muslim influence firmly established in Spain and Sicily, and Christian (Byzantine) dominance of Turkey and parts of the Levant. Only from the end of the fifteenth century (following the Spanish Reconquista and the Ottoman defeat of the Byzantines) do the religious boundaries largely correspond to our fixed geographical definition of Europe and the Arab World (see Figure A2 in Appendix A). Table 1 shows the results of estimating our baseline model for the whole sample as well as for each of the four different subsamples discussed above. We first discuss the results on the (relative) importance of geographical conditions and institutional developments in explaining the different urban developments in Europe and the Arab World. After that, we turn to the evidence for any interdependence of urban developments in the two regions.
4.2.1 Geography In both regions, cities have a clear advantage of being well positioned on the main transport corridors. However, the nature of these main transport corridors differs markedly between the two regions. It can be aptly summarized by the observation of a seventeenth century Ottoman statesman who stated “God hath given the sea to the Christians and the land to them [the Muslims]” (Rycaut, 1668; p.215-216). In Europe, having good access to navigable water (i.e. direct access to Mediterranean or Atlantic waters) spurs urban development. European trade very much focused on water transport. The Byzantines and then the Italians dominated Mediterranean trade, and, after 1500, the Atlantic ports prospered following the Great Discoveries (Acemoglu et al., 2005). For cities in the Arab World this is not the case23: although a higher percentage of cities in the Arab World are located at sea (see Table A10 in Appendix A), these cities do generally not fare better than their landlocked counterparts. Indeed, the really big Muslim cities, e.g. Baghdad, Damascus, Cairo and Cordoba are all inland (Istanbul is a notable exception, but it becomes a Muslim city only in 1453). Mediterranean trade was of only marginal importance compared to the Muslim trade across the Sahara and in the Indian Ocean (Pryor, 1988).
23
Besides the importance of location at sea, the results regarding location at a navigable river offer some (although not as significant as location at sea) additional evidence into the larger importance of water-based transport in Europe compared to the Arab World (Ashtor, 1976).
16
Table 1. Baseline results Atlantic Mediterranean Baltic river hub roman road caravan route caravan hub bishop archbishop capital university Muslim ln UP - Muslim ln UP - Christian ecozone 1 ecozone 2 ecozone 3 ecozone 4 ecozone 5 latitude latitude squared ln elevation
R2 nr observations ecozones century FE
0.31*** [0.00] 0.22** [0.03] 0.15 [0.36] 0.04 [0.37] 0.04 [0.47] 0.01 [0.77] 0.07 [0.63] 0.26 [0.29] 0.16*** [0.00] 0.44*** [0.00] 0.84*** [0.00] 0.31*** [0.00] -0.02 [0.78] 0.17*** [0.00] 0.24** [0.02] 0.02 [0.82] 0.22*** [0.00] 0.41*** [0.00] 0.03 [0.72] -0.00 [0.73] -0.01 [0.56]
Latin West 0.35*** [0.00] 0.21* [0.06] 0.23 [0.16] 0.10* [0.10] 0.05 [0.37] 0.01 [0.87] 0.17*** [0.00] 0.46*** [0.00] 0.89*** [0.00] 0.27*** [0.00] 0.58*** [0.00] -0.01 [0.92] 0.19*** [0.01] 0.26** [0.02] -0.04 [0.70] 0.21*** [0.01] -0.26 [0.35] -0.08 [0.36] 0.00 [0.35] -0.01 [0.70]
non Latin West 0.10 [0.53] -0.08 [0.46] 0.08 [0.41] -0.07 [0.48] 0.05 [0.68] 0.37** [0.02] 0.24*** [0.00] 0.22 [0.14] 0.85*** [0.00] 0.40** [0.05] 0.05 [0.67] 0.12 [0.27] -0.15 [0.31] 1.50*** [0.00] 1.17*** [0.00] 0.39** [0.02] 0.26* [0.06] 0.61*** [0.00] 0.14 [0.48] 0.00 [0.56] 0.00 [0.90]
0.39 1928 [0.00] [0.49]
0.38 1864 [0.00] [0.33]
0.53 545 [0.00] [0.34]
all cities
Muslim
Christian
0.33*** [0.00] 0.17* [0.07] 0.14 [0.41] 0.10* [0.06] 0.04 [0.48] -0.03 [0.51] 0.02 [0.86] 0.37** [0.02] 0.19*** [0.00] 0.38*** [0.00] 0.88*** [0.00] 0.31*** [0.00] 0.27*** [0.00] 0.08 [0.20] 0.11** [0.05] 0.88*** [0.00] 0.39*** [0.00] 0.07 [0.45] 0.27*** [0.00] 0.27** [0.02] -0.05 [0.48] 0.00 [0.48] -0.02 [0.38]
0.06 [0.76] 0.17 [0.15] 0.16 [0.14] -0.20 [0.12] 0.07 [0.62] 0.38** [0.04] 0.20** [0.05] 0.19 [0.29] 0.77*** [0.00] 0.10 [0.72] 0.29** [0.04] 0.17 [0.43] 1.49*** [0.00] 1.00*** [0.00] 0.29 [0.18] 0.53*** [0.00] 0.54*** [0.00] 0.44 [0.11] -0.01* [0.08] 0.00 [0.97]
0.41 2409 [0.00] [0.39]
0.45 481 [0.00] [0.63]
non Latin West (Muslim only) 0.11 [0.64] 0.03 [0.82] 0.09 [0.47] 0.00 [0.98] 0.27* [0.09] 0.33* [0.07] 0.32*** [0.00] 0.27 [0.14] 0.81*** [0.00] 0.22 [0.50] 0.35** [0.02] 0.05 [0.82] 1.32*** [0.00] 1.09*** [0.00] 0.28 [0.23] 0.15 [0.45] 0.58*** [0.00] -0.15 [0.59] 0.00 [0.56] 0.03 [0.60] 0.51 400 [0.00] [0.79]
Notes: p-values, based on autocorrelation and heteroskedastically robust standard errors, in brackets. *, **, *** denotes significance at the 10%, 5%, 1% respectively. Results obtained allowing for city-specific random effects.
17
It may therefore not be surprising that we find that land-based transportation, and in particular transport on camel back, is more important in the Arab World. Interestingly, the effect is very similar in size to that of being located at sea (Atlantic) in Europe. Cities with good access to the caravan route network, i.e. hubs, are significantly larger than those cities not connected to, or only located along, this network. It indicates the importance of trade via caravan trails that gained in importance after the Arab conquests; it is also a reflection of the main orientation of the Arab World towards the East and South (see e.g. Pryor, 1988, p.137). In Europe we find no such significant effect of an advantageous location for landbased transportation, i.e. of location on the former network of Roman roads24. Also, the Christian cities in Anatolia, Syria and Lebanon, that could in principle be well connected to the caravan network (and were so following their Muslim conquest) are not significantly benefiting from this. Indeed, trade in the Byzantine Empire, by virtue of its dominance in Eastern Mediterranean waters, was much more focused towards the sea (Avramea, 2002 p.77-90). Next, we turn to the relevance of the difference in agricultural conditions in explaining the two regions’ different long-term urban development. Our three proxies for agricultural conditions, a city’s latitude, latitude squared, and elevation above sea level, are all no significant determinants of its size. This is not true for our more direct measure of agricultural potential based on the classification in Buringh et al. (1975). The results indicate the importance of agricultural conditions for urban development25. It generally holds, in both Europe and the Arab World, that the better the agricultural conditions the larger the city. However, combining this result with the distribution of agricultural potential in Europe and the Arab World (see Figures A1 and A4 in the Appendices), in our view, does not warrant a too important role for agricultural potential per se in explaining the shift of urban gravity from the Arab World to Europe. Although some of the worst agricultural conditions are indeed found in the Arab World, also the very best agricultural conditions are found there. Especially the very fertile Euphrates, Tigris and Nile valley are able to sustain significantly larger urban populations than other areas. In Europe, agricultural potential is much more
24
In Europe the camel also never gained importance in overland trade. The main reason for this is the camel’s physiology. A camel is perfectly suitable for desert life (it can withstand extreme heat and desiccation and its feet form cushions spreading its weight on the sand), but it is generally incapable of surviving in swampy or permanently wet areas and its cushioned feet are a disadvantage in mountainous areas (Wilson, 1984 p.17). As a results, even in Muslim Spain, “camels stood no chance of becoming established in the region on a large scale” (Buliet, 1975 p.229/230). 25 Note that the coefficients shown in Table 1 are relative to the effect of having the worst possible agricultural potential (ecozone 6).
18
uniformly distributed, and of only average quality (ecozone 4) compared to that in most fertile regions of the Arab World. These differences in the distribution of high quality land may help to explain the urban situation at the beginning of our sample period, when we do find the largest cities in those regions with the best agricultural potential (e.g. Baghdad and Cairo, but also Alexandria, Basra, Damietta and Tinnis). It is harder, on the basis of our results, to explain the move of the largest urban centres from the Arab World to Europe by their differences in agricultural potential per se26 27.
4.2.2 Institutions The results on our city-specific institutional variables in Table 1 confirm the important role of the state and, in Europe, of the Church in urban development. Being a capital city has a big positive impact on a city’s size. This impact is quite similar in Europe and the Arab World: in both regions the estimated capital city coefficient is about 0.8. Also, and especially in Europe, cities that played an important role in the Church are larger than other cities, and the more so the more important their status within the church (compare the bishop to the archbishop effect). (Arch)bishops oftentimes did not confine their role to the religious, wielding considerable political power, and playing an important role in the local economy (Hohenberg and Lees, 1995). However, playing an important role in the Church hierarchy is less important than being a center of ‘worldly power’. In the Arab World this bishop-effect is much less pronounced if not nonexistent 28. This is not unexpected given that the (arch)bishop’s role in the Muslim Arab World was confined to Christian minorities. They therefore rarely played a part in deciding on ‘worldly matters’ (Vryonis, 1971). The positive (and large) effect of having capital status and/or an important role within the Church hierarchy confirms the consumerish (Weber, 1922; 1958) nature of these cities. Capitals and religious centers attract people and capital alike as public expenditure or royal privileges are likely to be biased towards these cities, creating jobs and business opportunities. As Ades and Glaeser (1995, p.224) put it “Urban giants ultimately stem from
26
Campopiano (2009) points out that the cities in the Arab World relied on complex water management systems (see also Watson, 1983). He argues that these systems were heavily dependent on the state. When the state faltered so did its water-management system, with possibly disastrous results for urban and rural people alike. This would suggest other (more institutional) reasons than agricultural conditions per se diminishing actual agricultural production (with possible negative effects on urban population) in the Arab World. 27 Allowing for a trend in each ecozone’s effect does not yield any significant trends. 28 The significance effect of being a bishopric in the Arab World (see columns 2 and 5) is only due to the (formerly Byzantine) cities in Anatolia – reflected by the fact that it immediately loses its significance when allowing for city-specific fixed effects in the estimation [see Table 3].
19
the concentration of power in the hands of a small cadre of agents living in the capital” (see also Davis and Henderson (2003) on the political economy of the urbanization process). We understand that there may be reverse causality problems here though: cities may have been selected as capital cities or important religious centers because they were already big for other reasons. However, in many cases they were established outside the existing urban system, and became large only after their designation as capital city or religious center. “Rulers often chose not to establish the seat of government in the metropolis for fear of the potential for unrest any large city breeds.” Bairoch (1988, p.155). In fact, our data indicate that it are generally not the already-large cities that become a capital or bishopric29. Many examples exist of relatively unimportant small cities that owed their rise to the fact that they were chosen as capital city, e.g. Vienna, Naples, Berlin, Turin, Brussels, and Helsinki in Europe, and Baghdad, Fez, Damascus or Marrakech in the Arab World. Also, many examples exist of cities that, following the loss of its capital or ecclesiastical30 status, fell into immediate decline: Toledo, Granada, Baghdad, Krakow, Avignon, or Bursa. Finally, we also find a positive effect of hosting a university on urban development in Europe, but not so in the three Muslim cities in the Arab World that we classified as having a university (Baghdad, Fez and Cairo)31. However, we do not want to stress a causal interpretation of this finding too much. We are more worried than in case of our bishop and capital city variables that this result is plagued by reverse causality issues. As noted by Bairoch (1988, p.165/190) “The universities … gravitated mainly toward cities of more substantial size (p.165) … they rarely constituted poles of urban growth themselves (p.190)”. And although some counter-examples exist, such as Bologna, Louvain, Oxford or Cambridge, this statement is confirmed in our data: cities in which a university is established are significantly [p-value: 0.047] larger than cities that do not obtain this institution of higher education (39,510 vs. 28,330 inhabitants).
29
Cities gaining capital status are not significantly larger than cities not becoming a capital city: conditional on not being a capital city in century t-1, the population size of cities that do become a capital city in century t is 28,140; this is not significantly different [p-value: 0.08] from the population size of cities that do not become a capital city in century t, 23,610. Similarly, cities gaining bishop status are initially not statistically different in size (and even smaller) from cities not gaining bishop status [p-value: 0.113]. Only in case of archbishoprics the evidence does indicate that reverse causality may be an issue: cities in the Christian or the Latin West sample cities that do gain archbishop status are initially significantly larger (more than twice as large) than cities not gaining archbishop status [p-values are 0.031 and 0.036 respectively]. 30 “the bishops upheld in the city the notion of the ‘public good’ at the same time as they created centers of worship for the faithful. So true is this that those cities which … lost their bishops sickened where they did not die out altogether.” (Bairoch, 1988 p.121). 31 The difference in significance between the Muslim and the non Latin-West sample is due to the presence of Constantinople (housing a university) in the latter and not in the former sample.
20
4.2.3 Cities’ interaction – across and within religious lines Finally, we turn to the evidence for any interdependence between urban developments in Europe and the Arab World. Remarkably, we only find a strong positive correlation of urban developments within religious lines, i.e. Muslim cities benefit from urban development in (nearby) Muslim cities, and the correlation among Christian cities is also positive and significant. On the contrary, the correlation in urban development across religious lines is consistently insignificant and mostly negative. In the neighborhood of Muslim cities, Christian cities appear to be smaller than they would be otherwise, and the same holds for Muslim cities close to Christian cities32. This effect only shows up in three of the four subsamples in Table 1. However the non-significant effect of Muslim urban potential in the non Latin West sample immediately turns significant when we only consider the Muslim cities in this sample (see column 6). The latter strengthens the notion that it is indeed only interaction within religious boundaries that leaves a positive effect on urban size: it are the Christian cities in the non Latin West, that do not experience a significant positive effect of nearby Muslim urban development, that turn the Muslim urban potential variable insignificant in column 533. We take the positive feedbacks among Christian cities and among Muslim cities, combined with the absence of significant interaction across religious lines, as evidence that Muslim and Christian cities formed two largely separate urban systems that did either not significantly interact with each other, or, put differently, any positive interaction resulting from the exchange of goods, people or ideas, was undone by negative interactions between the two. How plausible is this finding? First, scholars have pointed out that Muslim commercial interests where much more oriented towards Persia, India and Africa than towards Europe. The Muslim Mediterranean trade “primarily connected Egypt and the Levant with Muslim North Africa, Sicily, and Andalusia, and to some extent with Byzantium, rather than with the Christian West” (Pryor, 1988, p.137). Trade between Muslim and Christian 32
Regarding a possible direct effect of religious orientation, the results in Table 1 may appear to suggest that Muslim cities are, all else equal, larger than non-Muslim cities. However, this finding is not very robust to e.g. allowing for city-specific fixed effects (see Table 2 below) or excluding Andalusia from the Latin West sample (focusing on the Muslim cities in southern Italy and Portugal only). We also note that, by distinguishing Christian cities into Protestant and non-Protestant cities following the Reformation, we are unable – similar to Acemoglu et al. (2005) – to confirm a significantly positive Protestant effect. Results available upon request. 33 Also, (see Table A3 in Appendix A) both the significant positive correlation within religious boundaries and the insignificant, and often negative, correlation between religious boundaries is remarkably robust to using different proxy variables than our urban potential measures to capture these interaction effects (e.g. the distance to the nearest Muslim or Christian city or (dummy) variables indicating the presence, number, or size, of Muslim or Christian cities within certain specified distance bands from each city).
21
cities was much smaller – constrained by higher transaction costs due to the cultural and institutional differences – than trade between cities of similar religious orientation34 (Greif, 2006; see also Guiso et al. (2009) or Helpman et al. (2008) for more recent empirical evidence for the difficulty of economic exchange across cultural or religious lines)35. As a result Muslim commercial attention to Europe was largely confined to Muslim Spain and Sicily36. (Bairoch, 1988 p.119). Lewis (1982) furthermore points out the lack of interest in the Muslim World for what was going on in Europe in this period37. This is e.g. borne out by the fact that there are hardly any accounts of Arab travelers (such as Ibn Battuta, Ibn Jubayr, or Al Muqaddasi) visiting Christian Europe, despite the fact that they did travel from Andalusia to Morocco, East Africa, India, and even as far as China. Additionally, more direct (violent) interactions across religious lines may be behind our findings. Muslim and Christian cities seem to be crowding out each other in border regions partly because these regions were frequent war zones in which cities do not flourish well (e.g. Anatolia and the Balkan during the rise of the Ottoman Empire, Palestine during the time of the Crusades, or the Iberian Peninsula before the end of the Reconquista). The Christian drive to oust the Muslim infidel from their own lands and the Holy Land, combined with the Muslim concept of Jihad, exemplified by the religious zeal of the Almohads or the early Ottomans’ Gaza Ideology (Kafadar, 1996), fuelled these conflicts. Recent evidence shows that the Ottoman threat to sixteenth century Europe even reduced conflict among Europeans themselves, in a way uniting them against a common enemy (Iyigun, 2008). Also, on religious grounds, both Christians and Muslims were not allowed to enslave their brothers in faith (Fynn Paul, 2009). As a result, the demand for slaves was met by raiding others, which had negative consequences for people living near the borders of the two religions, and on the shores of the Mediterranean. In Iberia and Italy whole stretches of coastline where abandoned by their inhabitants; the Spanish even started to capture coastal 34
Constantinople offers an interesting case in this respect: it faced serious food supply problems as grain exports from Egypt, its most important supplier, ceased almost immediately after Egypt was conquered by the Arabs (Teall, 1959). It was not until the Ottoman conquest of Constantinople in 1453 that grain from Muslim Egypt again became an important source of food for the city. 35 A number of authors suggest that Arab merchants generally lacked the knowledge to trade with the West (Ashtor, 1976: 105; Inalcik, 1994: 188); but it is also suggested that these information problems were to some extent solved by intermediaries such as Jews and Christian minorities living in the Arab World. 36 Although Venice and Amalfi may immediately come to mind as counterexamples trading intensively with the Muslim world and benefitting from their (monopolies on) trade with the East. These cities were the exception rather than the rule however. For example Genoa and Pisa, the two other “Maritime Republics”, were in constant conflict with the Saracens (ousting them from Sardinia and Corsica, and even establishing colonies in North Africa and the Middle East). Also Venice’s decline was partly the result of its largely unsuccessful campaigns against the rising Ottoman Empire. 37 Europe appears to have had a keener interest in the Muslim World, adopting several Arab technologies, such as the use of paper, the Arabic numerals or the windmill (see e.g. Watt, 1972; or Crespi, 1986).
22
towns on the North African shore (e.g. Algiers and Tunis) to stop further pirate raids38. The Ottomans also recruited a large part of their slaves from the Balkans (Erdem 1996).
4.3 Robustness of the baseline results Before summarizing our baseline findings, we discuss two robustness checks that address two potentially important objections to our baseline results. The first is that we only allow for city-specific random effects that are uncorrelated with the variables of interest in our baseline regressions. It can be argued that by doing this we are not adequately controlling for unobserved time-invariant heterogeneity that is correlated with some of the variables of interest. If this were the case, our estimates could be misleading. This arguably especially holds for our urban potential variables. The significance of these variables could simply be picking up a common (unaccounted for) regional factor affecting all cities in that region similarly, instead of warranting the interaction interpretation that we assign to it. A complication with allowing for such city-specific fixed effects is however that it leaves us unable to say anything about our variables of interest that are not changing over time (basically all geography variables). Table 2 shows the results when allowing for city-specific fixed effects. Moreover, in order to also control for unobserved time-varying variables that may influence our results, we include (the natural log of) total country population in each of the regressions. The inclusion of this time-varying variable (although imperfectly defined along 1990-country boundaries) additionally prevents us from (wrongly) ascribing general trends in overall population size to an interaction effect between cities39. Except for the results regarding our bishop- and Muslim-variable (that become insignificant), the main results are qualitatively robust to the inclusion of city-specific fixed effects. Note however that the estimated capital city bonus is substantially lower than in the baseline estimates. Importantly, the results regarding cities’ interaction within and across religious lines are similar to our baseline results. Again we only 38
In total an estimated 1 to 2.5 million Europeans were captured by the Barbary pirates between the sixteenth and nineteenth century alone (Davis, 2003). These slave raids could extend deep into each other’s territory however. Rome was sacked by Muslim forces in 846. In 972 a Saracen band, operating from their fortress in Fraxinetum in the French Provence, captured the abbot of Cluny, one of the grandest monasteries of that time, while crossing the St. Bernard Pass in the middle of the French Alps (Brett, 2001; p.230), only releasing him when a big sum of ransom money was paid. Even the south coast of England was raided several times, and the Saracens reached as far as Iceland on one occasion. 39 Results of including either only city-specific fixed effects or total country population are very similar and available upon request. Also, in case of the overall, Christian and Latin West samples all results hold up to, in addition, allowing for ecozone-century FE and/or country trends. In case of the Muslim and the non Latin West samples, given their substantially smaller sample sizes, doing this leaves us too little variance to find any significant results. The results are also robust to omitting the Netherlands and Great Britain from the total, Christian or Latin-West sample(s). Results available upon request.
23
find evidence of a positive correlation between urban developments in cities of the same religious denomination.
Table 2. Controlling for city-specific FE all cities
Muslim
Christian
Latin West
non Latin West
-
-
-
-
-
-0.15* [0.09] 0.15 [0.29] 0.54*** [0.00] 0.16* [0.05] 0.15 [0.11]
0.11 [0.46] 0.11 [0.72] 0.57*** [0.00] -0.08 [0.82] -
-0.08 [0.48] 0.32* [0.06] 0.47*** [0.00] 0.19** [0.02] -
-0.08 [0.47] 0.36** [0.02] 0.54*** [0.00] 0.20** [0.01] 0.38*** [0.00]
-0.00 [0.98] -0.08 [0.79] 0.59*** [0.00] -0.19 [0.43] -0.06 [0.68]
ln total country population
0.15** [0.03] 0.25** [0.03] 0.39 [0.00]
0.38** [0.04] 0.20 [0.42] 0.43* [0.06]
0.14 [0.26] 0.48*** [0.00] 0.29 [0.21]
0.14 [0.21] 0.63*** [0.00] 0.49** [0.05]
0.29* [0.09] -0.02 [0.94] 0.21 [0.26]
R2 nr observations century FE
0.76 2409 [0.64]
0.81 481 [0.75]
0.76 1928 [0.02]
0.75 1864 [0.00]
0.77 545 [0.98]
Geography bishop archbishop capital university Muslim ln UP - Muslim ln UP - Christian
Notes: p-values, based on autocorrelation and heteroskedastically robust standard errors, in brackets. *, **, *** denotes significance at the 10%, 5%, 1% respectively.
Another important objection to our results that we are aware of, is our use of an unbalanced panel of cities larger than 10,000 inhabitants. Using this selected sample may result in biased estimates if cities are endogenously selected into our sample. Note, see Heckman (1979), that such endogenous selection would only arise from unobserved factors related to both selection and size conditional upon selection (and thus not the variables already included in the estimations – including any city-specific time-invariant variables in case of the results in Table 2). We have assessed the importance of this selection problem in two different ways that we discuss in much more detail in Appendix A40. First, it is reassuring that running the same regressions on an unbalanced panel including all cities as soon as they have at least 5,000 inhabitants gives very similar results as 40
Acemoglu et al. (2002; 2005) address the selection problem by looking at a balanced sample of cities, i.e. they only consider cities that are always larger than 10,000 inhabitants over their whole sample period starting in 1300. In our case this would amount to considering a sample of only 33 of our 729 cities (20 in the Latin West and 13 in the Arab World). In our view the selection bias may be just as large, or even larger, when using a balanced sample due to the even stricter inclusion criterion. If we use a similar balanced sample of cities as Acemoglu et al. (2005), starting only in 1300, we find, in case of Europe, very similar results to the ones presented in Table 1. Note that Acemoglu et al. (2005, footnote 17 on p.558) remark that, in their case, sample composition bias did “in practice…not seem to be important”.
24
those presented in Table 1 (see Table A4 in Appendix A). The only interesting deviation from our baseline results is that location on a navigable river now also turns significant in case of the Christian and the Latin West sample, hereby providing some additional evidence on the importance of water-based transport in Europe. Second, our main conclusions largely hold up, or become even stronger, when employing a two-stage Heckman selection model (see Heckman, 1979) that in a first stage explicitly models the selection into the sample (i.e. the probability of being a city larger than 10,000 inhabitants), and next, in a second stage, corrects for sample selection in our city size model using these first stage results41 (see Table A5 in Appendix A).
4.4 Summary of baseline results Our baseline results point to two important differences between Europe and the Arab World in the main drivers of urban development. First, the exact nature of the dominant mode of transport – important for a city’s opportunities to engage in (long-distance) trade – is radically different between the two regions: in Europe this is water-based (the ship), whereas in the Arab World it is land-based (the camel). Second, there is the difference in main religious denomination in the two regions (Muslim vs. Christian). This appears to be responsible for a lack of correlation between urban developments in the two regions. Any benefits of the exchange of goods, people or ideas across religious boundaries, if present at all, appear to be undone by the negative interaction in terms of war, slave trade and piracy. However, despite these differences, our baseline results also point to much similarity in the main determinants of urban development in the two regions. In both regions, cities with good access to the important transport corridors and those having an important institutional role are larger than other cities; and the relative importance of the two is similar in both regions (for example, the effect of being a capital city is about twice as large as being located on the main transport corridors in both regions). Moreover, urban developments within each region do appear to be positively correlated: contrary to our findings regarding interaction across religious boundaries, we do find evidence for positive interaction between cities of similar religious denomination. Because of these similarities, our baseline results do not yet provide us with a definitive conclusion regarding the main drivers of the very different long-term urban 41
Making use of Europe’s and the Arab World’s common Roman heritage to satisfy the additional exclusion restriction of having at least one variable explaining selection but not size given selection (see Appendix A for more detail).
25
developments in Europe and the Arab World42. Therefore, we further refine, and extend, our baseline results in the next two section(s). We allow the effect of the important variables identified on the basis of our baseline results (being located on the major transport corridors, the capital city bonus, and the interaction of urban development within and across religious boundaries) to vary over the centuries43. The results reveal a very different development in the (relative) importance of some of these variables in Europe and the Arab World, allowing us to much better explain their ‘reversal of fortunes’.
4.5 Century specific impact of transport modes, capital status, and cities’ interaction In particular, we refine (2) and estimate:
(3)
ln popit = α i + Xɶ i βt + Xɶ it γ t + X i β + X it γ + ε it
where Xɶ it are our capital city and Muslim and Christian urban potential variables. The Xɶ i variables are (given the difference in main transport mode between Europe and the Arab World) location on Atlantic, Mediterranean or Baltic shores in case of our Christian and Latin West samples, and location on a roman road or caravan hub in case of the Muslim and non Latin West samples44. In these ‘time-varying regressions’ we always include city-specific fixed effects45. Given that we allow for a time-varying effect of some of our in principle timeinvariant geography variables, Xɶ i , these do no longer drop out of the regression. However, the estimated coefficients do not represent the absolute effect of each of these time-invariant variables on city size. Instead, they represent the relative effect of each of these variables compared to its unknown (because absorbed by the city-specific FE) effect in a base century46 (usually the earliest century possible). Table 3a and 3b show the results of our ‘time-varying 42
The agricultural potential of a city’s hinterland is also an important factor determining its size in both regions. However, given our brief discussion in section 4.2.3, our results do, in our view, not warrant a prominent role of agricultural conditions per se in explaining the different urban development in the two regions. 43 Acemoglu et al. (2005) establish the rise of Atlantic Europe in a similar way. 44 Also allowing (some of) the other included baseline variables to vary over the centuries generally results in non-significant patterns over time. Results available upon request. We only show the estimated time-varying coefficients on our Xɶ it and Xɶ i variables. The results for the other variables are very similar to those in Table 1. 45 Again, in case of the Christian and Latin West samples the results also hold up to additionally including ecozone-century FE and/or country trends. In case of the Muslim and non Latin West samples, given their substantially smaller sample sizes, doing this leaves us too little variance to find any significant results. Also, excluding the Netherlands and Great Britain from our sample(s) leaves our main results (except the significance of the time-varying pattern in the Atlantic coefficients) unchanged. Results available upon request. 46 To aid interpretation of our geography variables, we will frequently refer to the results in Table A6 in Appendix A when not including city-specific effects. They can be useful to get an idea of the absolute size of the effect of the included geography variables (i.e. location at sea, a roman road, or a caravan hub).
26
regressions’ in case of the Muslim and Christian subsample respectively47. They point to a number of important changes in both Europe and the Arab World. Similar to section 4.2, we first discuss the results regarding our geographical and institutional variables, and then turn to the evidence for any interdependence of urban developments in the two regions.
4.5.1 Geography In the Arab World the time-varying estimates of the effect of being well positioned for landbased transportation refine our baseline results in important ways. Table 3a: Transport, capital status and UP over time – Arab World MUSLIM year 800 900 1000 1100 1200 1300 1400 1500 1600 1700 1800 F-test equal? city FE century FE other variables observations
roman road 0.05 0.04 -0.09 -0.12 -0.21 -0.01 0.13 0.76 1.09** 0.56 [0.07]
caravan hub 0.07 -0.28 -0.49* -0.35 -0.20 -0.19 -0.22 -0.43 -0.38 -0.46 [0.15]
capital 0.76 0.89** 0.70* 0.33** 0.50*** 0.51*** 0.44* 0.59*** 0.64** 0.71** 0.61* [0.31]
Muslim UP 0.76*** 0.73*** 0.44 0.12 0.01 0.57 0.57 0.02 -0.10 -0.36 -0.10 [0.00]
Christian UP -0.77 -0.82* -0.45 -0.44 0.12 0.62* 0.53 0.27 0.21 -0.07 -0.26 [0.08]
yes [0.00] see baseline 481
Notes: *, **, *** denotes significance at the 10%, 5%, 1% respectively (based on autocorrelation and heteroskedastically robust standard errors). The coefficients on the geography variables measure its effect relative to its effect in 800 [see Table A6a in Appendix A for the results without city-specific FE (showing the absolute effect of each geography variable by century, yet under the assumption of no city-specific FE)]. F-test equal? indicates the p-value on a test of equality of all century-specific effects for a specific variable (in case of the time-invariant geography variables this amounts to testing the joint significance of all – not dropped out – century specific dummies).
First, we do not find a significant change in the effect of being located on a hub of caravan routes over the centuries (the F-test does not reject the equality of all century-specific caravan hub coefficients). It concurs with the notion that there were no major efficiency improvements in caravan transport. Technological improvements in the caravan trade are indeed hard to imagine, a fully loaded camel could travel as far (about 30 miles a day), and carry as much, in 800 as in 1800. Moreover, the network of possible routes was largely fixed 47
We show the subsamples based on religious boundaries in the main text as they provide the ‘best’ evidence regarding the interdependence of urban developments across and within religious boundaries [see e.g. the discussion of the column 5 and 6 results in Table 1]. The results for the Latin West and non Latin West samples are again very similar and can be found in Appendix A.
27
by the supply of fresh water sources ruling out any significant improvement in the network of trade routes. Austen (1990, p.341) indicates that traveling times of caravans through the Sahara hardly changed over a period of one thousand years (850-1930). Although not changing in efficiency over time, the caravan trade was more efficient in the Arab World than trade by horse, oxen, and/or wheeled cart. There was no need for road maintenance, and camels outperform horses and oxen when it comes to stamina in desert type conditions (Buliet, 1975 p.227/228). This clearly shows in our time-varying estimates of the effect of being located on a former Roman road. They show a (decreasing) significantly negative effect over the centuries (combine the results in Table 5a with those in Table A6a in Appendix A). It confirms the (radical) change in the dominant transport mode following the Arab Conquests: camels have taken over the role of horse- and oxen-drawn carts. “In the
greater part of the Near East wheeled transport disappeared after the rise of the Muslim Empire, not to come back until the nineteenth century” (Hourani 2002, p.44)48. In contrast to the largely unchanging importance of location on the main transport corridors in the Arab World, the time-varying results for Europe show significant developments in the importance of a location’s long-distance water-based transportation opportunities. Although the importance of direct access to Mediterranean waters did not significantly change over the centuries49 (despite a slight increase in its effect from 1700 onwards), both location on Atlantic and on Baltic shores have a changing effect over time. Combining the results in Table 3b with those in Table A6b in Appendix A, we find a strong positive effect of being located on the Baltic exactly during the flowering of the Hanse, an alliance of trading cities that created a vast trading network connecting Northern Germany, the Netherlands, Poland, and the Baltic States (but also having offices (Kontors) in London and trading on the Champagne Fairs). This positive effect however disappears after 1400, when first the Dutch but later also other European powers broke the monopoly of the Hanse and started to dominate the Baltic trade. Location on Atlantic shores also has a significantly changing impact on a city’s development over the centuries. Confirming the results in Acemoglu et al. (2005), we find an
48
In general there appears to be less continuity of the Roman past in the Arab World compared to Europe (see also Appendix A, section A.1). This not only shows in the discussed change in main mode of land-based transportation. The conversion to Islam also marginalized the influence of the Church (an important source of Roman continuity in Europe – Verhulst, 1999). See also Table A11 in Appendix A documenting the percentage of locations that were a bishopric in 600 that eventually became an urban center of more than 10k inhabitants: this is almost 50% in Italy, France and the Iberian Peninsula, but in the Arab World it is no more than 10%. 49 The positive coefficients for 900-1100 period in the Christian sample in Table A6b are largely driven by the presence of Constantinople in that sample.
28
increasing importance of access to the Atlantic. In fact (again see Table A6b in Appendix A), during the ninth and tenth century the Atlantic effect is even negative (be it insignificant), exactly in the years that the Vikings were a constant threat to cities in North West Europe and some bishoprics (such as Utrecht) were even relocated inland in order to cope with this (Weiler 2003). Over the centuries we observe an ever increasing importance of location on the Atlantic so that from about the sixteenth century onwards (following the discovery of the direct route to Asia and the Americas), we find that direct access to the Atlantic is a significant positive asset for city development. Table 3b: Transport, capital status and UP over time – Europe CHRISTIAN year 800 900 1000 1100 1200 1300 1400 1500 1600 1700 1800 F-test equal? city FE century FE other variables observations
Atlantic 0.38 0.53 0.40 0.77 0.86* 0.85 1.13* 1.31** 1.27** [0.00]
Mediterranean 0.37 0.28 -0.04 -0.12 -0.08 -0.32 0.00 -0.08 0.06 0.14 [0.11]
Baltic -0.27 -0.56*** -0.22 -0.31* -0.25 [0.00]
capital 1.03*** 0.09 -0.08 0.09 0.14 0.42*** 0.51*** 0.48*** 0.72*** 1.11*** 1.31*** [0.00]
Muslim UP -0.42 -0.21 0.14 0.11 -0.03 0.26** 0.22 0.34 0.23 0.31 0.03 [0.04]
Christian UP 0.24 0.27 -0.05 0.32* 0.42** 0.70*** 0.60*** 0.64*** 0.65*** 0.68*** 0.45** [0.00]
yes [0.00] see baseline 1928
Notes: *, **, *** denotes significance at the 10%, 5%, 1% respectively (based on autocorrelation and heteroskedastically robust standard errors). The coefficients on the geography variables measure its effect relative to its effect in 900, 800, 1300 in case of location at the Atlantic, Mediterranean and Baltic respectively [see Table A6b in Appendix A for the results without city-specific FE (showing the absolute effect of each geography variable by century, yet under the assumption of no city-specific FE)]. F-test equal? indicates the pvalue on a test of equality of all century-specific effects for a specific variable (in case of the time-invariant geography variables this amounts to testing the joint significance of all – not dropped out – century specific dummies).
The increasing importance of water-based trade (and sea-borne trade in particular) in Europe stands in sharp contrast to the stagnating importance of the caravan-trade in the Arab World. Although the Arab World was initially quite innovative in adopting a superior mode of landbased transportation, in the long-term the absence of opportunities for technological innovation in caravan trade constituted a stark difference with Europe. The European focus on water-based trade, combined with the much bigger scope for technological innovation in ship design, navigation techniques, and in establishing more efficient networks of shipping routes (see e.g. van Zanden and van Tielhof, 2009), eventually gave the Europeans the upper 29
hand in long distance trade. Culminating in the Great Discoveries that gave Europe not only direct access to Asia’s markets (diminishing the importance of the Arab World’s role as middleman in the trade between Europe and Asia), but also resulting in an inflow of wealth and resources from the newly discovered Americas (see e.g. Findlay and O’Rourke, 2007).
4.5.2 Institutions Despite the fact that our baseline results showed a very similarly sized capital city bonus in Europe and the Arab World, the evolution in its magnitude over the centuries is very different in the two regions. Although the estimated capital city coefficient in the Arab World is relatively large during the flowering of the Umayyad, Fatimid and Abbasid Caliphates, declines with the gradual fragmentation of the latter state(s), and returns to the previous high level with the rise of Ottoman Istanbul, this pattern is not statistically significant. Capital cities dominated the urban landscape in the Arab World, and, despite substantial changes in the political map of the Arab World, the extent of their dominance did not significantly change over the 800-1800 period. In contrast, we find no significant capital city bonus in Europe at the beginning of our sample period50. The estimated coefficient does show a steady increase over time however, so that from about the fourteenth century onwards we start observing a significant capital city bonus. However, only from the seventeenth century onwards do the capital cities dominate the European urban landscape to a similar extent as in the Arab World during the heydays of the Abbasid Caliphate or the Ottoman Empire. This increasing dominance of capital cities clearly reflects the (slow) process of state formation in Europe. Following the collapse of the Carolingian Empire, Europe was politically heavily fragmented, resulting in a complex patchwork of political entities that often exercised power regionally or consisted of a single city only. Eventually however, successful regional or city states were able to consolidate ever larger territories, resulting in the formation of new and strong territorial states (France, Germany, Spain and Britain) with large centralized governments principally located in the capital city (Paris, Berlin, Madrid and London respectively) [see e.g. Tilly 1990].
4.5.3 Cities’ interaction – across and within religious lines Finally, we turn to the century specific urban potential coefficients. They, first of all, confirm the lack of evidence for positive interaction across religious boundaries that we discussed in 50
Ignoring the big capital city bonus in 800 that is due to only Rome and Byzantium [a non Latin West city] in the Christian, and only Rome and Cordoba [a Muslim city] in the Latin-West sample respectively.
30
Section 4.2.3. We find no significant (and often a negative) correlation between the development of cities of different religious denomination throughout our sample period51. The century specific results regarding the interaction within religious boundaries, on the contrary, do show a very interesting evolution over the centuries, and a very different one in Europe compared to the Arab World. In the Arab World, we only find significant positive correlation between the development of Muslim cities until about the eleventh century. Interestingly, this period coincides with the Golden Age of Islam, and it encompasses the heyday of the Abbasid, Fatimid and Ummayad Caliphates that ruled from present-day Spain to Iran. The Caliphates maintained law and order, and imposed similar (Islamic) institutions for exchange. Moreover, from Cordoba to Baghdad the ruling class spoke one language, the region was both culturally and religiously very homogenous52, connected through the efficient caravan network, and (see e.g. Findlay and O’Rourke, 2007) there existed hardly any barriers to trade (Bairoch (1988 p.119) even speaks of a “vast Islamic free-trade zone”). From about the eleventh century onwards however, this significantly positive Muslim interaction effect disappears53. The immediate cause appears to be the demise of the Abbasid, Ummayad and Fatimid Caliphates that started to lose control over many of its provinces. This resulted in a period of increasing political fragmentation54. Besides that, and partly as a result of these internal struggles, Islam was for the first time in centuries on the defense from about the eleventh century onwards. Christian forces captured Sicily in 1091, in 1095 Pope Urban II launched the First Crusade, and on the Iberian Peninsula the Christian Reconquista started to gain momentum. Finally the Mongol incursions in the thirteenth century dealt a decisive blow to the Abbasid Caliphate destroying Baghdad in 1258. Both these internal and external struggles severely harmed the integrated urban system, resulting in the loss of the positive interaction between cities. Eventually, the Ottomans would (re-)unite the Arab World in one 51
Note that in both the Christian and Muslim sample we do find a positive interaction effect across religious boundaries in the thirteenth century. Close inspection of the data reveal that this is only driven by the Christian capture of Cordoba in 1236, so that in 1300 the newly converted Christian Cordoba lies within close distance of Muslim Granada. King Ferdinand III expelled all Moors from Cordoba, many of whom fled to nearby Granada that subsequently witnessed a substantial increase in its size in the thirteenth century. Excluding Granada and Cordoba from the sample(s) turns the effect insignificant at the 5% level. 52 Language, cultural and institutional similarity still play an important role in determining trade costs in the modern empirical international trade literature (see e.g. Anderson and van Wincoop, 2004). 53 Findlay and O’Rourke (2007 p.24) call the eleventh century “a critical turning point in the destinies of all three great Caliphates”. 54 The Fatimid Caliphate further disintegrated under pressure of the Almoravids, Berbers, Crusaders and Turks) to finally encompass only Egypt before Saladin dissolved the Caliphate in 1171 establishing the Ayyubid dynasty. The Abbasids lost control of their Persian provinces to the Ghaznavids, and the Umayyads were under threat from both Christian (from the North) and Berber (from the South) forces.
31
empire. However the Ottoman Empire was heavily focused towards economic development of its Anatolian homelands, and its Turkish language and culture differed significantly from its conquered North African and Middle Eastern provinces and vassal states. The main purpose of its provinces was resource- and tax-extraction, and independent development in these provinces was often viewed as a threat to Ottoman rule and deliberately discouraged (see Pamuk, 2004 or 2008, Hourani, 2002 ch.15, or Inalcik, 1970 or 1994 for more detailed expositions of the economic and institutional developments in the Ottoman Empire). As a result, urban development was concentrated in a few cities only (the successive Ottoman capital cities Bursa, Edirne and Istanbul in particular, see e.g. Inalcik, 1970 p.209), and we do not observe a return to the positive feedbacks between cities in the Arab World as experienced during the Golden Age of Islam55. In Europe we observe the exact opposite: we find no evidence for significant positive interaction effects between cities until the twelfth century. The European economy stagnated in the early Middle Ages resulting in sharply declining trade volumes (see Pirenne, 1969; McCormick, 2001). The disintegration of the Carolingian Empire resulted in a complex patchwork of (small) political entities, which were developing their own institutions (independent cities, counties, regions), knew many different languages, and had different systems of common law. Yet, in spite of this substantial political, cultural and linguistic fragmentation, trade between the different regions in Europe witnessed a revival after about 1000 (Davis, 1955 p.432; Bairoch, 1988 p.127). As a result we find that an integrated urban system evolves from the twelfth century onwards, suggesting that the typical European institutions (guilds and communes) that governed (long distance) exchange came into being well before the period of the Great Discoveries (consistent with claims by e.g. Greif, 2006 and Van Zanden, 2008). Furthermore, the later rise of the nation states does not, despite the eventual increased dominance of the large capital cities in the urban landscape (see section 4.5.2), diminish the
“relatively high degree of interactions between cities […] in late preindustrial Europe” Duranton (1999, p.2177). Whereas Ottoman policy makers had a more passive attitude towards international trade (Inalcik, 1970), European states began, as part of their mercantilist policies, to actively further its development. Several authors (e.g. Epstein, 2000) stress the positive role for the state in Europe’s trade revival: “… king and church 55
Indeed before the rise of the Ottoman Empire the largest cities in the Arab World can be found from Baghdad to Cairo, to Marrakesh, to Cordoba. Following the rise of the Ottoman Empire however, more and more of the largest cities can be found close to the main center of Ottoman power in Western Anatolia (Edirne, Bursa, Saloniki, Izmir and, of course, Istanbul).
32
contributed to gradual improvements in security and law and made possible a great expansion of trade.” (Hohenberg and Lees, 1995 p.48).
4.5.4 Summary of time-varying results Our time-varying results significantly modify the conclusions drawn on the basis of our baseline results in section 4.4. First, the evolution of the effect of location on the main transport corridors turns out to be very different between the two regions. The Arab World was initially very innovative in replacing horse or oxen-drawn carts by the camel. However, possibilities for long-term efficiency gains in the caravan-trade were low, especially compared to those in water-based transportation, the main mode of transport in Europe. Europe’s focus on water-based, and in particular sea-borne, trade proved very beneficial in the long-term given the much bigger possibilities for productivity gains in shipping technology and improved navigation techniques. Second, the state appears to have played a more consistent dominant role in the Arab World. Capital cities dominate the urban landscape in the Arab World throughout our sample period. In Europe, this is not the case. Only from the fourteenth century onwards, with the (slow) rise of the nation state, we start to observe an increasing dominance of capital cities. But only from about 1700 onwards does the capital city dominate the urban landscape to the same extent as in the Arab World. Finally, although the generally insignificant century-specific interaction across religious lines does not significantly modify our baseline findings, the correlation between the development of cities of similar religious denomination does show significant differences over the centuries in both regions. In the Arab World, we find evidence of significant positive interaction between cities during the Golden Age of Islam only. Following the disintegration of the Abbasid, Fatimid and Umayyad Caliphates, the development of cities in the Arab World loses their interdependence. Moreover, the eventual rise of the Ottoman Empire does not result in a return to the integrated urban system in place during the Golden Age of Islam. In Europe we observe a completely different picture. There the urban system starts to show signs of positive interaction between cities from about the twelfth/thirteenth century onwards. This happens in a period of weak states and political fragmentation despite differences56 in 56
Pirenne (1969 p.129) e.g. remarks that the eleventh century fairs in France, that brought together merchants from the North and the South of Europe, saw “from the very first the elaboration of a sort of commercial jurisprudence, the same everywhere despite the differences in country, language, and national laws.”
33
language, culture and institutions, and it survives despite the rise of the European nation states and the increased dominance of capital cities in the urban landscape.
4.6 Local authority – a defining difference between Europe and the Arab World? The interesting puzzle remains why in Europe a more interdependent urban system starts to evolve in a period of fragmentation which survives despite the rise of the nation states, whereas we do not observe such a development in the Arab World. We think that the answer lies to a large extent in Europe’s institutional developments. In particular, cities with a substantial degree of local authority and obtaining representation in national parliaments (Van Zanden et al., 2010) start to emerge in Europe from the eleventh/twelfth century onwards. Such developments never take hold in the cities of the Arab World. Previous work by Acemoglu et al. (2005) and De Long and Shleifer (1993) has already empirically looked at the importance of political institutions for the development of cities in Europe. These papers point to an important positive effect of the quality of political institutions on urban development, indicating that the more “free” a city is, i.e. the greater the degree of local authority and the fewer the constraints on economic activity imposed by the state, the better the incentives and opportunities for economic and urban expansion. These papers rely largely on country-wide variables measuring the quality of political institutions. Here, as stressed in Section 3.2.2, we use two city-specific variables instead that in our view improve on these nation-wide measures. One (our commune variable) provides information on the degree of local, city-specific political authority, and the other (our active
parliament variable) indicates whether or not the city had the possibility to influence statewide policy through the existence of an active national parliament comprising not only of members of the nobility and church, but also of representatives of the cities. The process of cities gaining influence in (self-)government starts exactly during the period that Europe was politically fragmented. In the power vacuum that resulted, cities could organize themselves and claim a kind of self-rule that was often acknowledged by the sovereign in return for taxes or loyalty (Jones 2003). The first occurrences of communal selfgovernment show up in the eleventh and twelfth century in Spain, Italy and France, spreading over the rest of Europe in the following centuries (in 1800 about 53% of all cities have some form of local authority). The result of local autonomy was that citizens could better protect their property against predating local lords, regulate their own systems of justice, and introduce laws beneficial to industry and trade (Weber, 1922, 1958). As these ‘independent’ cities gained in power and influence they also started to ask for influence in national decision 34
making (and tax policy in particular). This eventually resulted in cities gaining representation in royal assemblies that developed into national parliaments (see van Zanden et al., 2010 for a more detailed account of the rise (and fall) of the parliament in Europe). It may therefore be no coincidence that the emergence of parliaments follows that of local city authority by about a century; we observe the first parliaments in twelfth and thirteenth century Spain, Italy and France, spreading over Europe in the following centuries. This development of forms of local authority and city representation in national policymaking stands in sharp contrast to developments in the Arab World. There a process of cities acquiring some form of local authority independent from the state never takes hold. Although there is some discussion on the emergence of feudal institutions in the Arab World as well, they lack the important dimension of fragmented sovereignty that is characteristic for the Latin West in the Middle Ages (see the discussions in Ashtor, 1976 and Inalcik, 1994)57. In the Arab World, given the dominant role played by the strong state “true urban
autonomies would have been unthinkable” (Cahen, 1970 p.520) Table 4 shows that the (1990-)country-wide measures of institutional quality used in earlier empirical studies (Acemoglu et al, 2005 and De Long and Shleifer, 1993) may not do full justice to the (changing) institutional landscape in Europe. Only about half the cities that have some form of local authority, and only two fifths of cities that are represented in an active national parliament, are classified as ‘free’ when employing the De Long and Shleifer (1993) country-wide ‘free/prince’ variable. Also, about 12% of ‘non-commune-cities’ and 22% of ‘non-active-parliament-cities’ are classified as ‘free’ by De Long and Shleifer (1993).
Table 4. Country-wide vs. city-specific institutions commune? no yes active parliam ent ? no yes
active parliament no yes
free / prince (1/0) prince free
average c.o.e.
75% 45%
25% 55%
88% 51%
12% 49%
1.73 2.27***
-
-
78% 61%
22% 39%
1.74 2.34***
Notes: c.o.e denotes the variable constraint on the executive taken from Acemoglu et al., 2005.
Similarly, cities that we classify as commune or being represented in an active parliament generally do have a significantly better score on Acemoglu et al.’s (2005) ‘constraint on the 57 This corresponds to Acemoglu et al. (2005), who do consider some countries outside the Latin West when constructing their measures of protection for capital and constraint on the executive. All these countries (Albania, Greece, Rumania, Turkey, Yugoslavia and Bulgaria) get the lowest possible score on each of the two variables throughout the period considered in that paper.
35
executive’ variable, but, and again due to the country-classification used in Acemoglu et al. (2005), this correspondence is far from perfect. We think that our two city-specific measures do more justice to a city’s institutional setting, and, at least, provide a useful alternative to the above-discussed country-wide measures. To establish empirically whether having local authority is beneficial to a city’s development, we add our commune- and active-parliament variables to our baseline regressions. Moreover, in addition to simply looking for a direct effect of these two variables, we also include them interacted with our Christian urban potential variable. This allows us to verify whether the emergence of these more independent cities indeed contributed to the interdependent European urban system that appeared from about the same time (see Table 3b) as we witness the first signs of local authority and/or parliamentary representation (i.e. do these independent cities benefit significantly more from the presence of other nearby cities?).
Table 5. Focus on city-specific institutions, the effect of local authority -
-
Latin West -
-0.14* [0.09] 0.15 [0.28] 0.55*** [0.00] 0.16** [0.05] 0.16* [0.08]
-0.09 [0.43] 0.31* [0.07] 0.49*** [0.00] 0.19** [0.02] -
-0.07 [0.49] 0.35** [0.02] 0.55*** [0.00] 0.20** [0.01] 0.43*** [0.00]
-0.14 [0.11] 0.16 [0.26] 0.55*** [0.00] 0.15* [0.06] 0.11 [0.25]
-0.10 [0.39] 0.30* [0.08] 0.47*** [0.00] 0.19** [0.02] -
Latin West -0.07 [0.48] 0.35 [0.02] 0.55*** [0.00] 0.20** [0.01] 0.37*** [0.01]
0.17* [0.02] 0.18 [0.14]
0.14 [0.28] 0.41*** [0.01]
0.15 [0.20] 0.57*** [0.00]
0.21** [0.02] 0.17 [0.16]
0.18 [0.14] 0.38** [0.02]
0.16 [0.15] 0.52*** [0.00]
0.11** [0.05] 0.08* [0.09] [0.02] 0.06 [0.30]
0.12 [0.12] 0.10** [0.04] [0.02] 0.06 [0.23]
0.12** [0.03] 0.09* [0.07] [0.01] 0.05 [0.33]
-0.12 [0.30] -0.08 [0.55] 0.12** [0.04] 0.07 [0.14] 0.08 [0.15]
-0.18 [0.15] 0.02 [0.90] 0.13** [0.03] 0.04 [0.48] 0.07 [0.20]
-0.04 [0.76] 0.02 [0.88] 0.08 [0.19] 0.03 [0.56] 0.05 [0.31]
ln total country population
0.34*** [0.00]
0.19 [0.38]
0.35 [0.13]
0.28** [0.03]
0.18 [0.41]
0.33 [0.16]
nr observations century FE
2409 [0.20]
1928 [0.00]
1864 [0.00]
2409 [0.61]
1928 [0.10]
1864 [0.01]
all cities Geography bishop archbishop capital university Muslim ln UP - Muslim ln UP - Christian commune active parliam ent [p-value F-test] commune * chr UP act.parl * chr UP free / prince
Christian
all cities
Christian
Notes: p-values, based on autocorrelation and heteroskedastically robust standard errors, in brackets. *, **, *** denotes significance at the 10%, 5%, 1% respectively.
36
Table 5 shows the results. We only show results for the total, Christian and Latin West samples, since none of the Muslim or non Latin West cities have a form of local authority or parliamentary representation during our sample period. Given that our two institutional variables of interest do vary over time, we, as in Table 2, include city-specific fixed effects and total country population in all regressions. Moreover, we also include an extended version of De Long and Shleifer’s (1993) ‘free/prince’-variable in each of the regressions for sake of comparison58. The first three columns indicate that having local political authority or parliamentary representation has significant direct benefits for a city’s urban development59. The added variance in the (evolution of) institutional quality between cities in the same (1990-)country allows us, in contrast to the country-specific ‘free-prince’ variable that looses significance as soon as we include city-specific fixed effects60, to still identify these effects when including city-specific fixed effects. Moreover, the results in the last three columns, when also interacting our two cityspecific institutional variables with Christian urban potential, suggest that it may be no coincidence that we see the emergence of a more interdependent urban system in Europe from about the twelfth century onwards, the same period when cities start to obtain forms of local authority and to demand influence in national policy making through representation in national parliaments: especially those cities having local authority benefit to a significantly larger extent from other urban development in their vicinity61. 58
We extend the ‘free/prince’ variable in the sense that we classify the cities in the Arab World as ‘prince’ throughout the sample period. Table A7 in Appendix A also show the results when additionally including the ‘constraint on the executive’ variable taken from Acemoglu et al., (2005) to the regressions. Due to the more limited geographical and temporal scope of this variable, it causes the loss of about 300 or 70 observations in case of the total or Latin West and Christian sample respectively. The results do not change significantly when also adding country-trends and/or ecozone-century fixed effects to the regressions. When not including cityspecific fixed effects, or ln total country population to the regression the free/prince variable is often significant at the 10% level, our commune variable is always significant, and the active parliament variable is mostly not significant. Also, not including the ‘free/prince’ variable only improves the significance of our commune- and active parliament-variables. Results available upon request. 59 Again, one may be worried about reverse causality here. However, it are generally not the larger cities that get local authority. On the contrary, when considering the total sample, cities without local authority in century t-1, that do get local authority in century t, have on average 20,173 inhabitants versus the 35,853 inhabitants of cities that do not get local authority in century t. Similarly, cities without parliamentary representation in century t-1 but with parliamentary representation in century t have on average 24,310 inhabitants compared to the 34,798 inhabitants of cities that do not get parliamentary representation in century t. Considering only the Latin West or Christian sample, these numbers become 20,175 vs. 25,039 and 20,173 vs. 26,206 respectively in case of local authority, and 24,310 vs. 25,456 and 24,458 vs. 26,196 respectively in case of parliamentary representation. Except in the total sample all differences are not significant at the 5% level. 60 Results without including city-specific fixed effects are available upon request. 61 In the Latin West the interaction term between ln Christian urban potential and the commune variable turns significant when we only consider the Christian cities in the Latin West. Also, the insignificance of the notinteracted commune and active parliament variables mask the fact that the marginal effect of having local
37
These findings for Europe stand in sharp contrast to the absence of a process of bottom-up institution building in the Arab World. Cities did not obtain similar forms of local authority or representation in state policy during the period of increased political fragmentation following the demise of the early Muslim Caliphates62. Eventually, in both Europe and the Arab World, the period of political fragmentation was followed by the rise of strong (nation) states. However, the European cities, by virtue of their (newly) gained influence in local and national policymaking, managed to much better withstand any ‘predatory actions’ undertaken by these new powerful states. Although the rise of the nation state did result in (some of) the capital cities starting to dominate the European urban system in a similar way as in the Arab World (see Table 3b), we do not observe a loss of the significantly positive interdependence between European cities. In many regions the capital city was held in check by the other cities in the urban system that continued to be wellrepresented in government affairs through the emergence of active national parliaments and/or their (persistent) larger degree of local authority. It may therefore also be no surprise that the center of Europe’s urban development shifted to exactly those regions (most notably the Netherlands and the United Kingdom, but also e.g. Switzerland and Sweden) where, in contrast to elsewhere in Europe (e.g. France, Spain or Germany), cities were able to maintain their local authority or strengthened their position in national representative institutions.
5. Conclusions
This paper is the first to shed empirical light on the divergent development of Europe and the Arab World between 800 and 1800. On the basis of a large new dataset of cities in Europe, North Africa and the Middle East we provide empirically founded explanations to the question why in the course of this millennium the urban center of gravity moved from Iraq authority and parliamentary representation, and its significance, now crucially depend on Christian urban potential. Figure A3 in Appendix A shows that the marginal effect of having local authority and parliamentary representation is significantly positive for cities with sufficiently large Christian urban potential [except for the parliament variable in the Latin West sample]. Table A3 furthermore indicates that such cities are not confined to e.g. the United Kingdom and the Netherlands, but are found throughout Europe. 62 In September 1184 the Islamic traveler Ibn Jubayr passes numerous villages and fields on the Syrian coast. These coastal plains had been under Crusader rule for some eighty years. Interestingly, Ibn Jubayr, himself a devout Muslim, favorably compares the situation of Muslim farmers living in Crusader territory with that of their close-by counterparts living under Muslim rule: “We left Tibnin by a road running past farms where Muslims live who do very well under the Franks-may Allah preserve us from such a temptation! ... The Muslims own their own houses and rule themselves in their own way. This is the way the farms and big villages are organized in Frankish territory. Many Muslims are sorely tempted to settle here when they see the far from comfortable conditions in which their brethren live in the districts under Muslim rule. Unfortunately for the Muslims, they have always reason for complaint about the injustices of their chiefs in the lands governed by their coreligionists, whereas they can have nothing but praise for the conduct of the Franks, whose justice they can always rely on.” [English translation of Paule (1995, p.324/325)]
38
(or more generally the Arab World) to Europe and the shores of the Atlantic in particular. We draw the following main conclusions on the basis of our analysis: First, the difference in main religious denomination prevented structural (positive or negative) interaction between urban development in Europe and the Arab World. Although there may have been benefits of the exchange of goods, people or ideas, these were largely undone by the negative consequences of the religious divide between the two regions either indirectly in posing additional boundaries to exchange, or directly in the form of piracy, war, and slavery. As a result, the reasons for the two region’s reversal of fortune are mainly
specific to each region. In both regions geography and institutions played an important role in determining the character and evolution of urban development, but very differently so. A first defining difference between the two regions is their different choice of main transportation mode. The Arab World was very innovative in replacing horse or oxen-drawn carts by the camel, a much more efficient means of transport in the desert-type conditions that can be found in many parts of North Africa and the Middle East. However, possibilities for efficiency gains in the caravan-trade were low, especially compared to those in water-based transportation, the main mode of transport in Europe. Europe’s focus on water-based, and in particular sea-borne, trade proved very beneficial in the long-term given the much bigger gains in productivity due to (technological) innovations in ship building and improved navigation techniques (and eventually resulting in the ‘fortuitous’ discovery of the Americas). The difference in institutional developments is the second defining difference between the two regions. Throughout our sample period capital cities dominate the urban landscape in the Arab World. In Europe, this is not the case. Following the demise of the Carolingian Empire, Europe was, for many centuries, fragmented in many (small) political entities. During this period cities start developing forms of local authority and to demand representation in national policymaking. This made them less dependent on the state than the cities in the Arab World that never developed such forms of local authority. Eventually, with the rise of the European nation states, we do start to observe an increasing importance of capital cities in the European landscape as well. However, in many regions of Europe the capital city was held in check by the other cities in the urban system that often maintained a degree of local authority and continued to be well represented in government affairs through the emergence of active national parliaments. Finally, and contrary to the absence of significant interaction across religious lines, we find that cities’ development does show significant signs of positive interaction within religious borders. In the Arab World, we find evidence of significant positive interaction 39
between (Muslim) cities during the Golden Age of Islam only. Following the disintegration of the Abbasid, Fatimid and Umayyad Caliphates, the development of cities in the Arab World looses their interdependence. This period of political instability ends with the rise of the Ottoman Empire. However, given its heavy focus on its Anatolian homelands, its imposition of significant constraints on development in its conquered provinces, and its linguistic and cultural differences to the rest of the Arab World, it did not result in a return to the integrated urban system in place during the Golden Age of Islam. Europe offers a completely different picture. In the early Middle Ages, we do not find any signs of an integrated urban system. However, from about the twelfth / thirteenth century onwards the urban system starts to show the first signs of positive interaction between (Christian) cities. Despite differences in language, culture and institutions, this interdependence emerges in a period of weak states and political fragmentation. Again, the appearance of more independent cities having forms of local authority played an important role in the creation of this interdependent urban system, as well as its survival despite the rise of the European nation states and the increased dominance of capital cities in the urban landscape. It is this more state-independent, water-based trade oriented, urban system that, spurred on by the impact of the Great Discoveries, explains why the urban (and economic) center of gravity shifted from the Arab World to Europe, making London, instead of Baghdad, the largest, most important city in this part of the world.
40
References
Acemoglu, Daron, Simon Johnson and James Robinson. 2002. “The Rise of Europe: Atlantic Trade, Institutional Change and Economic Growth”. Working Paper, NBER working paper 9378. Acemoglu, Daron, Simon Johnson and James Robinson. 2005. “The Rise of Europe: Atlantic Trade, Institutional Change, and Economic Growth.” American Economic Review, 95(3): 546-579. Ades, Alberto F. and Edward L. Glaeser. 1995. “Trade and Circuses: Explaining Urban Giants.” Quarterly Journal of Economics, 110(1): 195-227 Anderson, James E. and Eric van Wincoop. 2004. “Trade Costs.” Journal of Economic
Literature, 42: 691–751 Ashtor, Eliyahu. 1976. A social and economic history of the Near East in the Middle Ages. London: Collins. Austen, Ralph A. 1990. “Marginalization, stagnation, and growth: the trans-Saharan caravan trade in the era of European expansion, 1500-1900.” In The rise of merchant empires, long-
distance trade in the early modern world, 1350-1750, ed. James D. Tracy, 311-350. Cambridge: Cambridge University Press. Avramea, Anna. 2002. “Land and sea communications, fourth to fifteenth centuries.” In The
Economic History of Byzantium, ed. Angeliki E. Laiou, 57-90. Washington: Dumberton Oaks. Bairoch, Paul. 1988. Cities and Economic Development. Chicago: University of Chicago Press. Bairoch, Paul, Jean Batou and Pierre Chèvre. 1988. La population des villes Européennes,
800-1850. Genève: Librairie Droz. Bosker, Maarten, Steven Brakman, Harry Garretsen, Herman de Jong, and Marc Schramm. 2008. “Ports, Plagues and Politics: Explaining Italian city growth 1300-1861.” European
Review of Economic History, 12: 97-131. Bulliet, Richard W. 1975. The Camel and the Wheel. Cambridge (Mass.): Harvard University Press. Buringh, Pieter, H.D.J. van Heemst and G.J. Staring. 1975. Computation of the absolute
maximum food production of the world. Wageningen: Agricultural University. Cahen, Claude. 1970 "Economy, society, institutions." In Islamic Society and Civilization, eds. P. M. Holt, Ann K. S. Lambton and Bernard Lewis. Cambridge University Press.
41
Campopiano, Michele. 2010. “Mukasama and Misaha Land Tax: Taxation and Balance of Social Forces in Early Medieval Iraq (6th-10th centuries).” Journal of the Economic and
Social History of the Orient, in print. Crespi, Gabriele. 1986. The Arabs in Europe. New York: Rizzoli. Davis, Kingsley. 1955. “The Origin and Growth of Urbanization in the World.” American
Journal of Sociology, 60: 429-437. Davis, Robert C. 2003. Christian Slaves, Muslim Masters. White slavery in the
Mediterranean, the Barbary Coast and Italy. London: Macmillan. Davis, James C. and J. Vernon Henderson. 2003. “Evidence on the political economy of the urbanization process.” Journal of Urban Economics, 53: 98-125. De Long, J. Bradford. and Andrei Shleifer. 1993. “Princes and Merchants: City Growth Before the Industrial Revolution.” Journal of Law and Economics, 36: 671-702. Duby, Georges M.C. 1974. The early growth of the European economy, warriors and
peasants from the seventh to twelfth century. Ithaca: Cornell University Press. Duranton, Gilles. 1999. "Distance, land, and proximity: economic analysis and the evolution of cities" Environment and Planning A, 31: 2169 – 2188. Epstein, Stephan R. 2000. Freedom and growth: the rise of states and markets in Europe
1300-1750. London: Routledge. Erdem, Y. Hakan. 1996. Slavery in the Ottoman Empire and Its Demise, 1800-1909. London: McMillan. Findlay, Ronald and Kevin H. O'Rourke. 2007. Power and Plenty: Trade, War, and the
World Economy in the Second Millennium. Princeton: Princeton University Press. Finley, Moses I. 1985. The Ancient Economy. Berkeley: University of California Press. Fujita, Masahisa and Tomoya Mori. 1996. “The role of ports in the making of major cities: Self-agglomeration and hub-effect.” Journal of Development Economics, 49(1): 93-120. Fynn-Paul, Jeffrey. 2009. “Empire, Monotheism and Slavery in the greater Mediterranean Region from Antiquity to the Early Modern Era.” Past and Present, 205: 3-40. Gallup, John L., Jeffrey. D. Sachs, and Andrew D. Mellinger. 2001. “Geography and Economic Development” International Regional Science Review, 22: 179-232. Glick, Thomas F. 1979. Islamic and Christian Spain in the early Middle Ages. Princeton: Princeton University Press. Goitein, Solomon D.F. 1973. Letters of medieval Jewish traders. Princeton: Princeton University Press.
42
Grantham, G. 1999. “Contra Ricardo: on the macroeconomics of pre-industrial economies.”
European Review of Economic History, 3: 199-233. Greif, A. 2006. Institutions and the path to the modern economy: lessons from Medieval
trade. Cambridge: Cambridge University Press. Guiso, Luigi, Paolo Sapienza and Luigi Zinales. 2009. “Cultural Biases in Economic Exchange?” Quarterly Journal of Economics 124 (3): 1095-1131. Hajnal, J. 1965. “European marriage in perspective.” In Population in history ed. David. V. Glass and David. E. C. Eversley. London: Arnold. Heckman, James J. 1979. “Sample selection bias as a specification error.” Econometrica 47(1): 153-161. Helpman, Elhanan, Marc Melitz and Yona Rubinstein. 2008. “Estimating trade flows: trading partners and trading shares.” Quarterly Journal of Economics 123 (2): 441-487. Hodgson, Marshall G.S. 1974. The venture of Islam: conscience and history in a world
civilization. Chicago: University of Chicago Press. Hoffman, Philip T. 1996. Growth in a Traditional Society: The French Countryside, 1450-
1815. Princeton: Princeton University Press. Hohenberg, Paul M. 2004. “The historical geography of European cities: an interpretative essay.” In Handbook of Regional and Urban Economics, volume 4, eds. J.V. Henderson and J-F Thisse, Amsterdam: North Holland. Hohenberg, Paul M., Lynn H. Lees. 1995. The making of urban Europe: 1000-1994. Cambridge: Harvard University Press. Hourani, Albert. 2002. A History of the Arab Peoples. Cambridge (Mass): Belknap. Huff, Toby E. 2003. The rise of early modern science, Islam China and the West. Cambridge: Cambridge University Press. Đnalcık, Halil. 1970. “The Ottoman Economic Mind and Aspects of the Ottoman Economy”
In Studies in the economic history of the Middle East : from the rise of Islam to the present
day, ed. M. A. Cook. London: Oxford University Press, 208-218. Inalcik, Halil. 1994. An economic and social history of the Ottoman Empire, I, 1300-1600. Cambridge: Cambridge University Press. Iyigun, Murat. 2008. “Luther and Suleyman.” Quarterly Journal of Economics, 123(4): 14651494. Jedin, Hubert, Kenneth Scott Latourette and Jochen Martin. 1980. Atlas zur
Kirchengeschichte, die Christlischen Kirchen in Geschichte und Gegenwart. Freiburg: Herder. 43
Jones, Eric L. 2003. The European Miracle: environments, economies and geopolitics in the
History of Europe and Asia. Cambridge: Cambridge University Press. Kafadar, Cemal. 1996. Between Two Worlds: The Construction of the Ottoman State, reprinted edition, Berkeley: University of California Press. Kennedy, Hugh. 2002. “Military pay and the economy of the early Islamic state.” Historical
Research, 75(2): 155-169. Kennedy, Hugh. 2007. The Great Arab Conquests: How the spread of Islam changed the
world we live in. Philadelphia: Da Capo Press. Kuran, Timur. 2003. “The Islamic commercial crisis: institutional roots of economic underdevelopment in the Middle East.” Journal of Economic History, 63(2): 414-447. Kuran, Timur. 2005. "The Absence of the Corporation in Islamic Law: Origins and Persistence." American Journal of Comparative Law, 53: 785-834. Landes, David S. 1998. The Wealth and Poverty of Nations: Why Some Are So Rich and
Some So Poor. New York: Norton. Lewicki, T. 1994. "The Role of the Sahara and Saharians in Relationships between North and South". In UNESCO General History of Africa: Volume 3, Berkeley: University of California Press. Lewis, Bernard. 1982. The Muslim discovery of Europe. New York: Norton. Lopez, Robert S. 1976. The commercial revolution of the Middle Ages 950-1350. Cambridge: Cambridge University Press. MacCormick, Michael. 2001. Origins of the European economy: communications and
commerce AD 300-900. Cambridge: Cambridge University Press. McEvedy, Colin. 1977a. Kosmos historische atlassen: middeleeuwen. Amsterdam: Kosmos. McEvedy, Colin. 1977b. Kosmos historische atlassen: nieuwe tijd. Amsterdam: Kosmos. McEvedy, Colin, and Richard Jones. 1979. Atlas of world population history. London: Allen Lane. Mokyr, Joel. 1990. The lever of riches. New York: Oxford University Press. North, Douglass C and Robert P. Thomas. 1973. The rise of the western world: a new
economic history. Cambridge: Cambridge University Press. North, Douglass C. 1981. Structure and change in economic history. New York: Norton. Pamuk, Sevket. 2004. “Institutional Change and the Longevity of the Ottoman Empire, 1500– 1800.” Journal of Interdisciplinary History, xxxv:2, 225-247.
44
Pamuk, Sevket. 2008. “Evolution of Economic Institutions in the Ottoman Empire during the Early Modern Era.” Paper prepared for the 2009 World Economic History Conference, Utrecht, The Netherlands. Paule, Charles-Dominique. 1995. Voyageurs Arabes, Ibn Fadlân, Ibn Jubayr, Ibn Battûta. Paris: Gallimard. Pirenne, Henri. 1969. Medieval cities, their origins and the revival of trade. Princeton, Princeton University Press. Pomeranz, Kenneth. 2000. The Great Divergence. China, Europe and the Making of the
Modern World Economy. Princeton: Princeton University Press. Pryor, John H. 1988. Geography, technology and war: studies in the maritime history of the
Mediterranean, 649- 1571. Cambridge: Cambridge University Press. Redding, Stephen, and Anthony J. Venables. 2004. “Economic Geography and International Inequality.” Journal of International Economics, 62(1): 53-82. Roolvink, Roelof. 1957. Historical atlas of the Muslim peoples. Amsterdam: Djambatan. Rostovtzeff, Michael. 1971. Caravan cities. New York: AMS Press. Rycaut, Paul. 1675. The Present State of the Ottoman Empire. London: John Starkey and Henry Brome. Teall, John L. 1959. “The Grain Supply of the Byzantine Empire, 330-1025.” Dumbarton
Oaks Papers, 13, 87-139. Tilly, Charles. 1990. Coercion, Capital, and European States, AD 990-1990. Cambridge (Mass): Blackwell. Verhulst, Adriaan. 1999. The Rise of Cities in North-West Europe. Cambridge: Cambridge University Press. Vries, Jan de. 1984. European urbanization, 1500-1800. London: Methuen. Vryonis, Speros. 1971 The decline of medieval Hellenism in Asia Minor and the process of
Islamization from the eleventh through the fifteenth century. Berkeley: University of California Press. Watt, William Montgomery. 1972. The Influence of Islam on Medieval Europe. Edinburgh: Edinburgh University Press. Watson, Andrew M. 1974. “The Arab Agricultural Revolution and Its Diffusion.” Journal of
Economic History, 34, 8-35. Watson, Andrew M. 1983. Agricultural Innovation in the Early Islamic World, the diffusion
of Crops and Farming Techniques 700-1100. Cambridge, Cambridge University Press.
45
Weber, Max. 1922/1978. “The city (non-legitimate domination).” In Economy and Society:
An Outline of Interpretive Sociology, Max Weber, Vol 2 : 1212-1372. Berkeley: University of California Press. Weber, Max. 1958. The City. Translation and edited by Don Martindale and Gertrud Neuwirth. New York: The Free Press. Weiler, A.G. 2003. “Sint Radboud, bisschop van Utrecht [Deventer] van 899/900 tot 917.”
Trajecta, 12: 97-115. White, Lynn. 1962. Medieval Technology and Social Change. Oxford: Clarendon Press. Wilson, R.T. 1984. The Camel. London: Longman. Wittfogel, Karl. 1957 Oriental Despotism: A comparative Study of Total Power, New Haven: Yale University Press. Zanden, Jan Luiten van. 2008. “The Road to the Industrial Revolution. Hypotheses and Conjectures about the Medieval Origins of the ‘European Miracle.” Journal of Global
History, 3(3): 337-59. Zanden, Jan Luiten van and Milja van Tielhof. 2009. “Roles of growth and productivity change in Dutch shipping industry, 1500-1800.” Explorations in Economic History 46(4): 389-403. Zanden, Jan Luiten van, Eltjo Buringh and Maarten Bosker. 2010. “The rise and decline of European parliaments, 1188-1789”. CEPR discussion paper (forthcoming).
46
Data Appendix. Dataset of cities in Europe, North Africa and the Middle East, 800-1800
This Data Appendix documents our newly collected city-specific data set in detail.
Population For European cities with 10,000 inhabitants or more we used the dataset published by Bairoch et al. (1988). In the Medieval period a criterion of 10,000 inhabitants to characterize a city is a rather hefty one. As a result, only the really large centers of population pass our criterion in this period (Ennen, 1972, p.199). The population data for these cities has been collected for European countries and the Mediterranean area including the Middle East for the years around whole centuries starting in the year 800 and ending in 1800. We excluded the area of the former Soviet Union from our analysis, furthermore using the geographical borders of the countries as they where around 1990. To update Bairoch’s data, we scanned recent literature concerning the major cities covered by the dataset, in particular all cities which during some point in time were larger than 60,000 inhabitants. This led to a number of important revisions of Muslim cities in medieval Spain (estimates were corrected downwards on the basis of Glick (1979)), and Palermo, Paris and London in the same period. Bairoch et al. (1988) estimates were corrected for a number of extreme outliers: Cordoba (on the basis of Glick 1979) and Palermo (email exchanges with Jeremy Johns and S.R. Epstein). According to Bairoch et al. Cordoba was supposed to have 450,000 inhabitants at about 1000 (but only 110,000 according to Glick), Palermo’s size was 350,000 according to Bairoch et al., whereas our estimate (following Epstein and Johns) is 60,000. For Paris we used the numbers of hearths (61,098) from a census of 1328 presented by Pounds (1969) to estimate its population in 1300, for the next two centuries we assumed a decrease in the Parisian population because of the Black Death and Hundred Years War. London was the only city for which estimates were revised upwards following Campbell (2000). For Bruges we revised the population downwards in 1400 according to Blockmans (1980). For the year 1100 (which is missing in Bairoch’s dataset) the population data have been linearly interpolated between those provided for the years 1000 and 1200. The numbers of inhabitants in millions of persons in the different countries for the eleven time periods of our analysis have been derived from McEvedy and Jones (1979) either directly from their figures or interpolated from the lines characterizing the population developments. For Slovakia we assumed its numbers of inhabitants to have been the same as those of Hungary, except for 1800 where we distributed the inhabitants of Czechoslovakia between the Czech Republic and Slovakia in 1:2 (in accordance with their contemporary population sizes). McEvedy and Jones did not make a distinction between Slovakia and the Czech Republic because in the 1970s Czechoslovakia still was one country. For all cities we also established their different Roman, Arabic, Persian, Byzantine, Christian and later local names or synonyms. For the non-European cities in North Africa and the Middle East we first established a list of some fifty of the most important ones from Roolvink’s historical atlas (1957). Next, we extended these for Anatolia with the list of cities in Behar (1996), supplemented by a number of older cities named in Vryonis (1971) that met the size criterion. Chandler and Fox (1974) provide population data for some dozen cities in our sample and for a number of centuries. However, most of the data were inferred from secondary sources. We used the old (first) and the new edition of the Encylcopaedia of Islam (EoI) (Houtsma et al., 1993 and Gibb et al. 1975-2005) to find population estimates for the missing dates in the non-European cities in North Africa, the Middle East and Turkey. For the then still missing periods or cities we additionally used the two editions of the EoI, 47
Kennedy (1992), Woodford (1990), Raymond (2002), Escher and Wirth (1992) and various Baedeker travel guides of the areas to establish more or less hard physical data as the surface area of the specific city in medieval times in hectares from excavations or maps, the numbers of local mosques or the numbers of public hammams in the various cities and time periods, in order to use such physical data as an indicator of the otherwise not-available numbers of inhabitants. Generally we used a number of 150 inhabitants per hectare of surface area of a medieval city, except for “garden” cities as Baghdad and Basra for which we used a lower number of 75 inhabitants per hectare. For Baghdad we therefore have come to a lower population estimate (half) than the one presented by Chandler and Fox (1974). We additionally used a number of roughly one thousand inhabitants per mosque or public hammam when these entities had to be taken as a basis for the population estimates.63 Furthermore we used two accounts made by Arabic travelers in North Africa and the Middle East, that of Al Muqaddasi around the year 1000 (Collins, 1994) and that of Ibn Battuta in the first half of the fourteenth century (Dominique, 1995) to fine tune the various population estimates made above, in order to prevent conflicts with contemporary observations on city sizes made by these two local travelers. We also used other contemporary observations, whenever available. For instance crusaders in the army of Frederic Barbarosa, passing through Konya in 1190, considered its size to be similar to that of their native Cologne (see EoI, vol. V, p. 253). Therefore we have attributed a similar number of inhabitants to Konya in 1200 as we found in Bairoch et al. (1988) for Cologne.
Reliability of estimates of urban population What can we say about the reliability of our dataset? One way to check the results is to compare the (corrected and expanded) Bairoch dataset with other similar datasets. For Western Europe between 1500 and 1800 we can compare with Jan de Vries’ compilation of similar estimates; the differences are small: the correlation coefficient ranges from 0.986 (for both 1500 and 1800) to 0.992, showing how close the two datasets are. A similar comparison with the Malanima (1998) dataset of Italian cities in the period 1300-1800 shows somewhat larger differences, but still the correlation is as high as 0.903 (1300), 0.900 (1400), 0.983 (1500), 0.990 (1600), 0.979 (1700) and 0.981 (1800) (note that the fit is somewhat lower for the pre 1500 period, for which in general the data are less good). The very high correlation between our data and the other datasets by De Vries and Malanima in our view provide additional confidence in our data. For the non-European data we can compare with the estimates of the share or urbanization in the Ottoman Empire by Sevket Pamuk, which are generally slightly higher than our estimates.64 Similarly, the estimates of the urbanization ratio published by Malanima (1998) for Italy are higher than those arrived at here, probably because we miss some of the smaller cities just above the 10,000 threshold. The objective of our paper is, however, not to explain trends in urbanization ratios (which are also dependent on estimates of size of the ‘national’ populations, adding, especially for the pre 1500 period, another source of error) but on explaining why some cities are big and others are not. 63 For Ottoman Cairo Raymond presents 243 mosques, while indicating a population of 263,000 inhabitants in 1800, this comes quite close to the rule of thumb derived from other data, which we applied for some of the population estimates where other data were missing. 64 According to Pamuk’s estimates it increased – mainly due to the strong expansion of Istanbul – from 9,2% in 1500 to 12,2 % in 1820, in the Arab World (which was almost completely under control of the Ottoman Empire) we find an urbanization rate of 8.5% and 10% respectively for the same years. The data on the Ottoman Empire were kindly shared with us by Sevket Pamuk.
48
With the procedure that we followed we will have undoubtedly missed a number of the cities in North Africa, Turkey and the Middle East, which at some moment during the millennium of our analysis would have qualified for the size criterion. However, given our substantial search using various sources we feel confident that missing a couple of cities that barely exceed 10,000 inhabitants at some time in the millennium between 800 and 1800 will not really affect the numerical outcomes that have been presented in the various analyses.
Geographical information Geographical information concerning location of a city at a sea coast (split into location at the Atlantic, Mediterranean, or Baltic) 65 and navigable waterways has been found from Dumont and Mieremans (1959). We use a city’s original location in combination with the historical, sometimes very different, position of coastlines in constructing this variable. When a town was indicated to be lying along a waterway that is presented on one of the maps in an Atlas with a scale of at least 1:2,000,000 it was classified as having a navigable waterway. It was classified at sea when there was a possibility to beach or harbor boats along the coast where the city was located. The presence of a Roman road or a hub of Roman roads (two or more meeting) was collected from Hammond (1981) and Talbert (2000). To determine if a (medieval) city was lying on a Roman road (or within a mile of it) or was having a seaport the original location of the city and coastline was used as a criterion and not the current sometimes much more extensive surface that a city occupies nor the current position of the coastlines. The information on caravan routes in North Africa and the Middle East was derived from maps by Barraclough (1981, p. 134-136), Roolvink (1957, p. 16-17) and Rostovtzeff (1971, p. 2). For Anatolia the information on caravan routes was collected form the new edition of the Encyclopaedia of Islam: in the lemma: “Anadolu” (EoI, vol. I, map between p. 480-481). We used the map of roads in seventeenth-century Turkey and only counted the double tracks as important caravan roads and used this information to classify whether or not cities were lying on a caravan route or a hub of caravan routes (two or more meeting). Finally we also collected each city’s geographical coordinates (latitude and longitude) from http://www.heavens-above.com a website that provides the coordinates of over 2 million places in the world. We subsequently use these coordinates to calculate the great circle distance between each specific pair of cities in our sample. These distances are the input into our Urban Potential (UP) measure introduced in Section 3, see expression (1). Besides, we used each city’s latitude and latitude squared as proxies of its climatic conditions. As a second proxy of a city’s agricultural potential we used its elevation above sea level. This variable is also collected from http://www.heavens-above.com/countries.aspx. The higher a city’s altitude the worse conditions for agriculture generally become; moreover, it could also serve as an indication of a city’s accessibility. The cities categorized as belonging to the Latin West were generally, but not necessarily always, in the sphere of influence of the medieval Roman Catholic Church. In this article the Latin West comprises the larger cities in Scandinavia (Norway, Sweden and Finland), Poland, Germany, Czech Republic, the Low Countries (Belgium, Luxembourg and the Netherlands), France, Great Britain, Ireland, Switzerland, Austria, Italy and those located on 65
We also classify the northern German cities of Hamburg and Emden, the Norwegian cities Bergen and Oslo, and Edinburgh and South Shields in the United Kingdom, all cities in the northern North Sea, as ‘Baltic’ cities.
49
the Iberian Peninsula (Portugal and Spain). The non-Latin West comprises the larger cities of the Balkans (Hungary, Slovakia, former Yugoslavia, Albania, Rumania, Bulgaria and Greece), Turkey, the Middle East (Lebanon, Jordan, Israel, Syria and Iraq) and North Africa (Egypt, Libya, Tunisia, Algeria and Morocco, all above 30 degrees latitude).
Administrative Data – institutions The administrative information (capital city, university, historic membership of the Hanseatic league, local political organization) has been mainly collected from the Lexikon des Mittelalters (LdM) (Auty, 1977) and for the non-European cities also from the two editions of Encyclopaedia of Islam. Capital cities Capital cities have been mainly characterized from the maps of the different political entities that were indicated in the historical atlases by McEvedy (1977a,b). Because of the large scale of these maps relatively small entities (as city-states) will not always have been indicated and cities might be missed as capitals. Also, for some medieval empires as the German where there were no natural administrative centers during a large part of their history this leads to the situation that capital cities there only start to develop at the end of the Middle Ages. During the period of our analysis the nation state and with it a capital city comes into being (especially in Europe). In the early medieval period for instance Charlemagne did not have a specific capital city and due to the size of his realm his court used to travel from place to place. In some smaller medieval kingdoms as France en England the local royals later settled down at one specific place, which afterwards developed into an administrative center and a capital city. Medieval map as a check As another touchstone of our database we used a medieval Catalan world map (Paris, BnF, Esp 30) that describes the world known around 1375. Grosjean (1977) gives a detailed description of this mapa mundi. His description shows that in 1375 on this map the most important residencies or capital cities have been indicated in red with a flag, the somewhat less important cities were indicated in red too but without a flag while even smaller cities were indicated in black. The average numbers of inhabitants in 1400 in our database are 59,100 for the cities indicated in red with a flag on the Catalan world map, 19,400 inhabitants for the cities only indicated in red and on average a mere 8,700 for the cities with a name in black. Indicative for the situation with a capital city in Germany is that none of the German cities has got a flag with it on the Catalan world map of 1375, while for instance the not too distant capital cities of Prague (Bohemia) and Krakow (Poland) were both indicated in red with a flag on this map. Universities The numbers of universities in the various cities and their dates of foundation have been mainly characterized from the ninth edition of the Encyclopaedia Britannica (1898) and Jedin et al. (1980). For the Islamic countries the there prevailing and sometimes high numbers of madrasas (e.g. 150 in Damascus in 1500), which by some authors have been classified as universities (Eche, 1967, p.150), have not been classified by us as such because the higher education they offered was more comparable to that at a western college than that at a real university. (Huff, 2003, p. 77). Huff (2003, p. 179) sees the European uniqueness of universities at three distinct levels: legal and organizational, curricula, and philosophical and metaphysical. As a result, we only classified the Muslim cities of Istanbul, Fez, Cairo and Baghdad to be home to a university. These four universities were the most important centers 50
of learning in the Arab World; moreover they are among the oldest in our sample. In Europe, with the exception of the medical school in Salerno (established in the ninth century), universities start to make an appearance in the twelfth century and their number rapidly increases over the centuries thereafter.
Local urban political organization in Latin West – the commune variable For the dates of the first appearance or the loss of a local urban participative organization in the different cities in the Latin West we tried as much as possible to use specialized studies, such as e.g. that of Charles Petit-Dutaillis (1970) for France. However, as such studies unfortunately are sparse we mainly had to rely on other secondary sources for our information on the local urban political organization. For a general overview in the medieval Latin West we used the city-specific descriptions in the Lexikon des Mittelalters (LdM), in which a mentioning of the occurrence of a commune, consuls or a town council (Rat, raad, vroedschap, conseil, consejo, conselho) in the city-specific lemmas was used to classify the various towns in our sample and attach a date (in the form of the subsequent whole century) to the first signs of a local administration in which (at least part of) the citizens participated. This source (LdM), which covers the period of the Middle Ages, had to be supplemented with various others to expand the period to 1800 and also to fill gaps in its coverage. As a general fall back option when the Lexikon des Mittelalters failed to present the sought after information on a local town council, we used the mentioning of the building date of a town hall in that specific city as a proxy for the first appearance of such a local participative administration. The building dates of town halls were generally collected from the various area specific Baedeker travel guides, complemented with the city-specific lemmas for Italy from the Enciclopedia Italiana, di szienze, lettre ed arti, (published by: Instituto Giovanni Trecani, 1929) for Spain from the Enciclopedia Universal Ilustrada (published by: J. Espase-Calpe, 1905) and for Portugal from the Grande Enciclopédia portuguesa e brasileira (published by: Editorial Encyclopedia, 1936). Of course we also checked whether these encyclopedias gave more specific information on the occurrence of a local participative administration in the various towns, if so, such information was preferentially used. For the building dates of Dutch town halls we used the Kunstreisboek voor Nederland (published by: P.N. van Kampen, 1960) as a complementary source and for Germany Wikipedia readily presented us with this building information on the halls of the various towns in our sample. To translate a building date of a town hall into the first sign of a local political administration we used a simple rule of thumb: we assumed that a town council would have been functioning at the turn of the century preceding the presented building date of a town hall. When a building date of a town hall was indicated to have been that of the second one in succession, we assumed the local participative administration to have begun even two centuries earlier, to compensate for the demise of the previous town hall (by assuming a rather conservative useful life of only two centuries for the first town hall). Naturally, the procedure used above with building dates of town halls as a proxy for missing information on the appearance of a local participative administration will lead to some misclassifications, as building dates of town halls are only indicators of the occurrence of town councils. However, generally such misclassifications may expect to lead to just an amount of extra noise in the data without necessarily biasing the outcomes of the later regressions, though we are aware that the statistical significance of the regressions is likely to decrease with more noise in our data. When information on building dates of town halls was missing too, we used information on the first time a town was described as a ciudad (Spain), or when city rights were granted 51
(Spain, Portugal, Hungary, Poland and Yugoslavia) as a different proxy for the appearance of a local administration. The sources of this information on city rights were the Lexikon des Mittelalters, and the various encyclopedias we used. As a basic rule of thumb we decided that a local council would probably have evolved in the first turn of the century after the granting of city rights to a town. Quite often city rights granted were belonging to a specific category (e.g. those of Magdeburg, Lübeck, etc.), under auspices of such city rights it was more often then not customary for a local council to operate, therefore we think such an assumption based on the proxy of city rights may be justified. Generally however, we preferred more direct data, if available, on the occurrence of a commune, council or consuls, above those on building dates of town halls or city rights. Wikipedia presented some supplementary information on the occurrence of local councils in the UK for the 178 reformed boroughs from the Municipal Corporations Act from 1835 and the boroughs incorporated in England and Wales 1835-1882. Whenever there were no clear indications of either a specific stop of a council or an inclusion of a city (and its council) into a hereditary seigneurie we assumed the local participative institutions to have functioned until 1800. Charles Petit-Dutaillis (1970, p. 193) indicates for France the following: « Notons d’ abord que généralement les communes françaises qui existaient à la fin du Moyen Age ont subsisté jusque à la Révolution. » However, sometimes the various sources listed above reported dates at which a local participative administration in a town stopped functioning, these dates of course have been used for the classification scheme we applied. For instance, at times a ruler punished a disobedient or insurgent city by dissolving its city council and quite often he then designated a specific administrator to the city. In other instances, which happened regularly in Italy, an initially participative town council was eventually taken over by an important and powerful local family. The occurrence of such hereditary seigneuries of course indicates that the participative aspect in the local administration disappears and for these towns we have ended the indication of a commune. The rule of thumb we applied to decide that such a change should be applied to the town in question was the occurrence of the second generation of a certain family indicated as local town rulers. For the different towns in the Balkans we assumed that the local participative organizations disappeared after the usurpation by the Ottomans there and we have classified these cities accordingly. When there was not enough information, for instance when there were no clear indications in the various references concerning a commune or the building date of a town hall, we have not classified the city in question. This too might have resulted in a misclassification for the specific city, when this lack of information was been based on inadequate sources instead of on an actual absence of participative organizations in a town.
National political organization in the Latin West – the parliament variable. The literature on the development of European Parliaments makes a clear distinction between royal councils and ‘modern’ Parliaments. The latter is, in line with Antonio Marongiu (1968), the author of a seminal overview of the rise of Medieval Parliaments, an independent body, representing the subjects of the realm, containing members of three estates (the clergy, the nobility and the cities – in a few cases also the peasantry was represented as well), whose main functions are the granting of taxes and the participation in realm-binding legislation, while sometimes its functions might include the high court of justice, foreign relations (decisions on war and peace) or the appointment or abdication of a sovereign. What distinguishes the Parliament from a council or an ad hoc assembly is that it forms an 52
independent body, a legal and political entity, with certain rights and obligations, which guarantees the continuity of its activities (Marongiu, 1968, p. 47). We classified a parliament as active when it had at least one meeting during the previous century. The second major difference with previous royal councils is the presence of representatives of the cities in Parliament – if only the Church and the nobility are present, we do not consider the institution to be a fully developed Parliament, for more information we refer to van Zanden et al., (2010).
Religious data: Church organization and cities’ main religious orientation Jedin et al. (1980) has been used to find the data on the Episcopal organization (bishopric, archbishopric) and their foundation dates for the various cities in this analysis. Additional information on the demise or relocation of bishoprics has been found in Wikipedia under ‘Roman Catholic (arch)diocese of…’, or under the city-specific lemma in the English, French or German editions of Wikipedia. As both Europe and the Arab World shared a common Christian heritage, these (arch)bishops are found throughout both regions. The nature of the Islamic faith, which lacks a structured religious organization contrary to that of the Western Roman Catholic or Eastern Orthodox Churches, unfortunately does not allow us to characterize and arrange Muslim cities in a similar administrative way as we could do for the Christian cities. Bishoprics and archbishoprics in Islamic cities therefore always concern the various Christian minorities in these cities. Switches of cities between Muslim and Christian (Roman Catholic or Orthodox) have been indicated in the database and will be used in the analysis. We assumed that a local (Byzantine) bishopric still functioned during the first century after the Muslim conversion, where after it ceased to function in practice (a process that has been described for many Anatolian cities by Vryonis, 1971). To the extent that these (arch)bishops continued to wield power, this always concerned only the various Christian minorities in these cities, and they no longer played an important part in deciding on worldly matters. Second, we used the Atlas of Church History by Jedin et al. (1980) to categorize the religious orientation (Christian or Muslim) of the majority of the inhabitants of a city. Especially in the Iberian Peninsula, Italy (Palermo) and in the Balkans and Turkey (former Byzantine Empire) and during the crusades the religious orientation in a number of cities shifted between Muslim and Christian or vice versa during the period of analysis. For Turkish cities we used Vryonis (1971) or the Encyclopaedia of Islam (EoI) to establish the conversion dates of the rulers of a city, and assumed that a local (Byzantine) bishopric still was functioning during the first century after conversion, and after that ceased to function in practice, as has been described for quite some Anatolian cities by Vryonis. We also used Jedin et al. (1980) to establish whether a city in the Netherlands, France, Germany, Poland or Switzerland was in majority Roman Catholic or Protestant after the Reformation and when this switch occurred. Additional data – Agricultural potential In a study to compute the absolute maximum food production in the world, Buringh et al. (1975) classify the world’s landmass into six different productivity classes on the basis of its agricultural potential. This distinction in classes is based on the available land resources, potential agricultural land, climate and a factor for water deficiency, and is determined by the maximum production of grain equivalents of potential agricultural land (MPGE/PAL), measured in tons per hectare per year. An advantage of this particular study is that it explicitly focuses on the agricultural potential of each part of the world on the basis of soil quality, climatic conditions, instead of looking at actual production. Figure A 1 shows the geographical distribution of the six classes in the two regions that we consider in this paper. It 53
ranges from the superb agricultural potential of the Nile, Po, and Euphrates and Tigris River valleys with an agricultural potential of more than 20 MPGE/PAL, to the average agricultural potential in most parts of Europe (10-15 MPGE/PAL), to the dismal agricultural conditions (a potential of less than 5 MPEG/PAL) in the Sahara, the Pyrenees, or the Alps. Figure A1
Agricultural potential
Notes: compilation of figures 9, 10 and 12 and Table 11 taken from Buringh et al. (1975). MPGE/PAL denotes the maximum production of grain equivalents in tons per year per hectare.
Additional data – Roman origins and the early Church To facilitate a Heckman analysis of our data we established whether or not a city had its origin in a Roman settlement from the Barrington Atlas (Talbert, 2000). We also estimated the geographical distribution of all Christian bishoprics and archbishoprics in the Mediterranean area around the year 600. The then predominant religion in this vast area (more than half a century before the arrival of Islam) was that of Christianity: either Catholic (Roman/Arian) or Monophysitist (Syrian, Coptic or Persian). Our preliminary assumption is that those Christian Churches will have concentrated their resources in such a way that they optimized their spans of control over their various flocks and will have developed an intricate system of local branch offices (bishoprics) that covered the most important concentrations of their believers. In other words we think that the fact that a town was an (arch)bishopric in 600 indicates that it then had the status of a center in the local economy, which at the time the Church thought to be important enough to control. In total we found more than 1400 bishoprics which were operating around the year 600 in the countries mentioned above surrounding the Mediterranean Sea on the maps 10A, 10B, 20, 21, 22, 23 and 24 of the Atlas zur Kirchengeschichte. All towns indicated on the maps with different locations but sometimes with similar names have been classified as a separate bishopric. Table A11 shows which fraction of these ‘bishop 600’ cities eventually passed the 10,000 inhabitants mark during 800 to 1800.
54
References to the Data Appendix Auty, Robert, ed. 1977. Lexikon des Mittelalters. 9 Vols. Stuttgart: Metzler. Baedeker, Karl. 1884. Le Nord de la France. Leipzig: Verlag Karl Baedeker. Baedeker, Karl. 1897. Oesterreich Ungarn. Leipzig: Verlag Karl Baedeker. Baedeker, Karl. 1901. Le Sud-Oeust de la France. Leipzig: Verlag Karl Baedeker. Baedeker, Karl. 1901. Belgique et Hollande. Leipzig: Verlag Karl Baedeker. Baedeker, Karl. 1906. Palestine and Syria. Leipzig: Verlag Karl Baedeker. Baedeker, Karl. 1908. Le Nord-Est de la France. Leipzig: Verlag Karl Baedeker. Baedeker, Karl. 1909. Central Italy. Leipzig: Verlag Karl Baedeker. Baedeker, Karl. 1911. The Mediterranean. Leipzig: Karl Baedeker Publications. Baedeker, Karl. 1912. Southern Italy. Leipzig: Verlag Karl Baedeker. Baedeker, Karl. 1913. Northern Italy. Leipzig: Verlag Karl Baedeker. Baedeker, Karl. 1914. Konstantinopel, Balkanstaaten, Kleinasien. Leipzig: Verlag Karl Baedeker. Baedeker, Karl. 1914. Egypt and the Sudan. Leipzig: Verlag Karl Baedeker. Baedeker, Karl. 1914. Schweden und Norwegen. Leipzig: Verlag Karl Baedeker. Baedeker, Karl. 1927. Great Britain. Leipzig: Verlag Karl Baedeker. Baedeker, Karl. 1929. Spanien und Portugal. Leipzig: Verlag Karl Baedeker. Baedeker, Karl. 1936. Das Deutsches Reich. Leipzig: Verlag Karl Baedeker. Bairoch, Paul, Jean Batou and Pierre Chèvre. 1988. La population des villes Européennes, 800-1850. Genève: Librairie Droz,. Barraclough, Geoffrey. ed. 1981. Spectrum Times Atlas van de wereldgeschiedenis. Utrecht: Spectrum. Behar, Cem.1996. The population of the Ottoman Empire and Turkey 1500-1927. Ankara: State Institute of Statistics. Black. publ. 1898. Encyclopaedia Britannica. 25 Vols. ninth edition. Edinburgh: Black. Blockmans, Wim. 1980. “The social and economic effects of the plague in the Low Countries 1349-1500.” Revue Belge de Philologie et d’Histoire, 58, 833-863. Buringh, Pieter, H.D.J. van Heemst and G.J. Staring. 1975. Computation of the absolute maximum food production of the world. Wageningen: Agricultural University. Campbell, Bruce. M. S. 2000. English Seigniorial Agriculture 1250-1450. Cambridge: Cambridge University Press. Chandler, Tertius, and Gerald Fox. 1974. 3000 years of urban growth. New York: Academic Press. Collins, Basil Anthony. 1994. Al-Muqaddasi, the best divisions for knowledge of the regions. Reading: Garnet. Dominique, Paul Charles. 1995. Voyageurs Arabes, Ibn Fadlan, Ibn Jubayr, Ibn Battuta et un auteur anonyme. Paris: Gallimard. Dumont, M.E., and C.G.M. Miermans. eds. 1959. Winkler Prins Atlas. Amsterdam: Elsevier. Eche, Youssef. 1967. Les bibliothèques Arabes, publiques et semi-publiques en Mésopotamie,en Syrie et en Egypte au moyen-âge. Damas : Institut Français de Damas. Editorial Encyclopedia. publ. 1936. Grande Enciclopédia portuguesa e brasileira. 40 Vols. Lisbao: Editorial Encyclopedia. Ennen, Edith. 1972. Die europäische Stadt des Mittelalters. Göttingen: Vandenhoeck und Ruprecht. . Escher, Anton, and Eugen Wirth. 1992. Die Medina von Fes. Erlangen: Palm und Enke. Espase-Calpe, J. publ. 1905. Enciclopedia Universal Ilustrada europea-americana. 70 Vols. Barcelona, Madrid: Espase-Calpe. Gibb, Hamilton A. R. ed. 1975. Encyclopaedia of Islam. 12 Vols. Leiden: Brill.
55
Glick, Thomas Frederick. 1979. Islamic and Christian Spain in the early Middle Ages. Leiden: Brill. Grosjean, Georges. 1977. Mapamundi, der katalanische Weltatlas vom Jahre 1375. Zürich: Urs Graf Verlag. Hammond, Nicholas G. L. ed. 1981. Atlas of the Greek and Roman world in antiquity. Park Ridge: Noyes Press. Houtsma, Martinus Th. ed. 1993. E.J. Brill’s First encyclopedia of Islam 1913-1936. 9 Vols. Leiden: Brill. Huff, Toby E. 2003. The rise of early modern science, Islam China and the West. Cambridge: Cambridge University Press. Instituto Giovanni Trecani. publ. 1929. Enciclopedia Italiana, di szienze, lettre ed arti. Milano: Instituto Giovanni Trecani. Jedin, Hubert, Kenneth Scott Latourette and Jochen Martin. 1980. Atlas zur Kirchengeschichte, die Christlischen Kirchen in Geschichte und Gegenwart. Freiburg: Herder. Kampen, P.N. van. publ. 1960. Kunstreisboek voor Nederland. Amsterdam: Van Kampen. Kennedy, Hugh. 1992. “Antioch: from Byzantium to Islam and back again.” In The city in late antiquity, ed. John Rich, 181-98. London: Routledge. Malanima, Paolo. 1998. “Italian cities 1300-1800. A quantitative approach.” Rivista di storia economica, XIV(2), 91-126. Marongiu, Antonio. 1968. Medieval parliaments, a comparative study. London: Eyre and Spottiswoode. McEvedy, Colin. 1977a. Kosmos historische atlassen: middeleeuwen. Amsterdam: Kosmos. McEvedy, Colin. 1977b. Kosmos historische atlassen: nieuwe tijd. Amsterdam: Kosmos. McEvedy, Colin, and Richard Jones. 1979. Atlas of world population history. London: Allen Lane. Petit-Dutaillis, Charles. 1970. Les communes françaises, caractères et évolution des origines au XVIIIe siècle. Paris: Albin Michel. Pounds, Norman J. G. 1969. “Overpopulation in France and the Low Countries in the later Middle Ages.” Journal of Social History, 3, 225-47. Raymond, André. 2002. Arab cities in the Ottoman period, Cairo, Syria and the Maghreb. Aldershot: Ashgate publishing. Roolvink, Roelof. 1957. Historical atlas of the Muslim peoples. Amsterdam: Djambatan. Rostovtzeff, Michael. 1971. Caravan cities. New York: AMS Press. Talbert, Richard J.A. ed. 2000. Barrington atlas of the Greek and Roman world. Princeton: Princeton University Press. Vries, Jan de. 1984. European urbanization, 1500-1800. London: Methuen and Co. Vryonis, Speros. 1971 The decline of medieval Hellenism in Asia Minor and the process of Islamization from the eleventh through the fifteenth century. Berkeley: University of California Press. Woodford, Jerome S. 1990. The city of Tunis, evolution of an urban system. Wisbech: Middle East & North African Studies Press. Zanden, Jan Luiten van, Eltjo Buringh and Maarten Bosker. 2010. “The rise and decline of European parliaments, 1188-1789”. CEPR Discussion Paper, forthcoming.
56
Appendix A - Complementary Tables and Additional Results Table A1. Urbanization rate in % (by countries / regions) Country
800 900 1000 1100 1200 1300 1400 1500 1600 1700 1800
Scandinavia Great Britain Ireland Low Countries France Germany Austria / Switzerland Italy Iberia Poland Czech Republic Hungary / Slovakia
3 3 4 6 -
1 3 4 5 8 -
4 5 3 4 6 8 13 1 -
3 3 4 5 9 10 1 -
3 10 6 5 1 11 9 0 1 -
3 3 12 6 5 1 14 9 1 2 -
3 3 23 6 6 2 13 10 2 4 -
1 2 20 6 5 2 13 10 3 3 1
2 6 0 21 7 5 2 17 12 5 2 1
4 11 4 27 9 5 5 16 11 3 2 1
5 23 9 20 9 8 8 17 14 3 2 3
Yugoslavia / Albania Bulgaria / Rumania Greece
2 3
2 4 7
3 4 6
1 4 5
1 5 4
3 6 6
4 5 9
4 6 3
8 5 6
6 6 4
5 6 4
Turkey Lebanon / Israel Syria Iraq Egypt North Africa
5 4 8 26 5 2
7 9 8 31 7 2
8 12 9 22 7 3
10 13 9 19 10 5
6 10 10 19 10 6
5 11 9 19 8 6
7 6 9 15 10 8
10 5 12 11 6 8
16 3 12 7 5 6
14 3 15 10 8 8
12 8 14 18 8 5
Latin – West 3 Balkan 1 Middle East / North Africa 7
3 4 9
5 4 8
5 3 10
5 3 8
6 5 7
7 5 9
7 5 9
8 6 10
9 5 11
11 5 10
Table A2. The largest urban centers over the centuries rank \ year 1 2 3 4 5 rank \ year 1 2 3 4 5
800 Baghdad 350 Byzantium 250 Basra 100 Wasit 100 Kufa 100 1400 Cairo 250 Paris 200 Granada 100 Tunis 100 Venezia 100
900 Baghdad 450 Byzantium 300 Cairo 150 Alexandria 100 Cordoba 95 1500 Istanbul 280 Paris 200 Cairo 180 Adrianople 127 Napoli 125
1000
1100
1200
Baghdad 300 Byzantium 300 Cairo 135 Cordoba 100 Sevilla 90
Baghdad 250 Byzantium 200 Cairo 150 Tinnis 110 Damietta 100
Baghdad 200 Cairo 200 Paris 110 Byzantium 100 Damietta 100
1600
1700
1800
Istanbul 700 Paris 300 Napoli 275 Cairo 250 London 200
Istanbul 700 London 575 Paris 500 Cairo 330 Napoli 300
Notes: population in thousands behind city name.
57
London 948 Paris 550 Istanbul 500 Napoli 430 Cairo 263
1300 Paris 250 Cairo 220 Granada 150 Venezia 110 Damietta 108
Table A3. Urban Potential robustness checks sample:
all cities
Muslim
geography/ institutions / religion
Christian
Latin west
non Latin west
similar to baseline
Check 1: nearest distance to other Muslim / Christian city ln dist near Muslim ln dist near Christian
-0.03 [0.43] -0.05** [0.03]
-0.16** [0.03] -0.03 [0.64]
0.02 [0.68] -0.08*** [0.00]
-0.06 [0.20] -0.10*** [0.00]
Check 2: distance to, and ln size of, nearest Muslim / Christian city ln dist near Muslim -0.03 -0.15* 0.02 -0.06 [0.49] [0.06] [0.59] [0.21] ln dist near Christian -0.05** -0.04 -0.08*** -0.10*** [0.03] [0.57] [0.00] [0.00] ln size near Muslim -0.02 -0.04 -0.02 -0.02 [0.42] [0.52] [0.37] [0.35] ln size near Christian -0.04* 0.03 -0.02 -0.04** [0.06] [0.59] [0.37] [0.04]
-0.08 [0.13] 0.06 [0.25]
-0.07 [0.19] 0.05 [0.33] -0.07 [0.13] 0.03 [0.53]
Check 3: total UP (no split between Muslim and Christian) ln urban potential
0.21*** [0.00]
0.45** [0.03]
0.19*** [0.00]
0.22*** [0.00]
0.12 [0.54]
Check 4: Muslim / Christian city within distance bands? Muslim city within 0 - 20 km 20 - 50 km 50 - 100 km Christian city within 0 - 20 km 20 - 50 km 50 - 100 km
-0.04 [0.80] 0.29 [0.20] 0.24** [0.02]
0.24 [0.12] 0.35 [0.16] 0.13 [0.23]
-0.33*** [0.00] -0.11 [0.52] -0.01 [0.88]
-0.14 [0.25] 0.29** [0.05]
0.13 [0.15] 0.36 [0.23] 0.09 [0.39]
0.01 [0.85] 0.09 [0.01] 0.08 [0.05]
-0.26 [0.36] -0.22 [0.33] 0.10 [0.72]
0.00 [0.93] 0.11*** [0.00] 0.08** [0.02]
0.01 [0.90] 0.11*** [0.00] 0.11*** [0.01]
0.15* [0.10] 0.03 [0.82] -0.25** [0.04]
Check 5: Muslim / Christian urban population within distance bands Muslim urban pop. 0 - 20 km -0.02 0.06 -0.08*** [0.69] [0.23] [0.00] 20 - 50 km 0.09 0.11* -0.04 -0.05 [0.11] [0.06] [0.46] [0.24] 50 - 100 km 0.07 0.05 0.00 0.05 [0.02] [0.12] [0.93] [0.20] Christian urban pop. 0 - 20 km 0.00 -0.13 -0.01 0.00 [0.86] [0.12] [0.69] [0.74] 20 - 50 km 0.02 -0.10 0.02** 0.02** [0.08] [0.23] [0.02] [0.03] 50 - 100 km 0.02 0.07 0.02** 0.02** [0.11] [0.41] [0.05] [0.03]
0.02 [0.46] 0.09 [0.19] 0.04 [0.23] 0.05 [0.19] 0.02 [0.75] -0.07** [0.05]
Notes: Results per robustness check are from separate regressions including all variables used in the baseline specification, but with the two urban potential variables replaced by the variable(s) above. p-values, based on autocorrelation and heteroskedastically robust standard errors, in brackets. *, **, *** denotes significance at the 10%, 5%, 1% respectively. Results obtained using panel data estimator allowing for random city-specific effects. When including city-specific effects instead, the results generally only become stronger; they are available upon request.
58
----------------------------------------------------------------------------------------------------------------
A.1 Assessing the importance of sample selection Table A4. Results when including cities as soon as more than 5000 inhabitants Atlantic / sea Mediterranean Baltic river hub roman road caravan route caravan hub bishop archbishop capital university Muslim ln UP - Muslim ln UP - Christian latitude latitude squared ln elevation ecozone 2 ecozone 3 ecozone 4 ecozone 5 ecozone 6
R2 nr observations ecozone FE century FE
0.28*** [0.00] 0.17 [0.11] 0.25 [0.11] 0.10** [0.04] 0.03 [0.60] 0.03 [0.61] 0.22 [0.15] 0.11 [0.64]
Latin West 0.32*** [0.00] 0.17 [0.15] 0.38** [0.01] 0.14** [0.01] 0.05 [0.44] 0.03 [0.57] -
non Latin West 0.08 [0.62] -0.14 [0.22] 0.07 [0.44] -0.09 [0.35] 0.06 [0.60] 0.38** [0.02]
0.18* [0.07] 0.23 [0.18] 0.80*** [0.00] 0.18 [0.49] -
0.23*** [0.00] 0.55*** [0.00] 0.91*** [0.00] 0.32*** [0.00] -
0.23*** [0.00] 0.54*** [0.00] 0.98*** [0.00] 0.30*** [0.00] 0.67*** [0.00]
0.27*** [0.00] 0.29** [0.04] 0.87*** [0.00] 0.49*** [0.01] 0.03 [0.76]
0.13** [0.03] 0.22*** [0.00]
0.27** [0.04] 0.11 [0.61]
0.09 [0.17] 0.32*** [0.00]
0.08 [0.25] 0.36*** [0.00]
0.13 [0.26] -0.16 [0.27]
-0.02 [0.81] 0.00 [0.87] -0.03* [0.09] -0.58** [0.03] -0.85*** [0.00] -0.66*** [0.01] -0.67** [0.01] -0.94*** [0.00]
0.49* [0.06] -0.01** [0.04] -0.01 [0.79] -0.48* [0.09] -1.22*** [0.00] -0.99*** [0.01] -0.92*** [0.01] -1.50*** [0.00]
0.07 [0.34] -0.00 [0.32] -0.02 [0.23] 0.10 [0.38] 0.14* [0.06] 0.25 [0.11] -0.12 [0.22]
-0.05 [0.53] 0.00 [0.55] -0.02 [0.30] 0.19* [0.09] 0.19*** [0.01] -0.48** [0.03] -0.08 [0.44]
0.20 [0.29] 0.00 [0.32] -0.01 [0.85] -0.30 [0.21] -1.10*** [0.00] -1.23*** [0.00] -0.84*** [0.00] -1.45*** [0.00]
0.42 2972 [0.00] [0.00]
0.46 499 [0.00] [0.43]
0.38 2473 [0.00] [0.00]
0.39 2400 [0.00] [0.00]
0.54 572 [0.00] [0.22]
all cities
Muslim
Christian
0.28*** [0.00] 0.13 [0.19] 0.20 [0.21] 0.13*** [0.01] 0.05 [0.35] -0.01 [0.87] 0.12 [0.28] 0.42*** [0.01]
0.06 [0.76] 0.14 [0.24] 0.18* [0.09] -0.20* [0.10] 0.04 [0.77] 0.40** [0.03]
0.22*** [0.00] 0.46*** [0.00] 0.91*** [0.00] 0.33*** [0.00] 0.38*** [0.00]
Notes: p-values, based on autocorrelation and heteroskedastically robust standard errors, in brackets. *, **, *** denotes significance at the 10%, 5%, 1% respectively. Note that in column 4 the results for the ecozone dummies do not have a reference category (the regression did not include a constant term).
59
As briefly discussed in the main text, we have assessed the sensitivity of our baseline results (in Table 1) to possible sample selection problems in two ways. First, the results in Table A4 above show that running the same regressions on an unbalanced panel including all cities as soon as they have at least 5,000 inhabitants gives very similar results as those presented in Table 1. The only interesting deviation from our baseline results is the fact that location on a navigable river now also turns significant in case of the Christian or the Latin West sample, strengthening the (weaker) claim made regarding this variable on the basis of our baseline results. Second, we have experimented with using a Heckman selection model that in a first stage explicitly models the selection into the sample (i.e. the probability of being a city larger than 10,000 inhabitants), and next, in a second stage, corrects for sample selection in our city size model using these first stage results (see Heckman, 1979). To obtain credible results however one needs to include at least one additional variable in the first stage that does explain selection, but not a city’s size given selection in the second stage66. Such a variable is generally quite difficult to find, but, using the common Roman heritage of both Europe and the Arab World67, we think we have collected two reasonable candidates. The first is a dummy variable indicating whether or not a city has roman origins. It is based on the city featuring as a settlement on one of the maps in the Barrington Atlas of the Greek and Roman
World (Talbert, 2000). The second is a dummy variable indicating whether or not a city was a bishopric in the year 600 (from Jedin et al., 1980). The Church played an important role in
the continuation between Roman and Medieval times (see e.g. Hohenberg and Lees, 1994; Bairoch, 1988). Therefore, the fact that a city was important enough for the Church in 600 to be made a bishopric arguably tells something about the importance of such a city in late Roman times. The appropriateness of these two ‘selection-only’ variables relies on the continuity between the urban systems in Roman times and the Middle Ages (Verhulst, 1999). Hohenberg (2004 p.3024) e.g. stresses that the origins of many cities in Europe “date back
earlier, notably to Roman times. […] the urban grid reflects the past.” We think it is defendable that having a Roman past may increase a location’s likelihood to be in our city size sample (for unobserved reasons some locations were attractive city locations both in Roman times as well as during our sample period). But we find it less likely that a Roman 66
Not doing this leaves one unable to distinguish between endogenous sample selection and other forms of model misspecification. 67 See the Data Appendix for more detail on these two variables.
60
past still explains a city’s exact size (i.e. size given selection) given the fundamentally changed socio-political and economic structures during and after the Middle Ages68. Table A5 shows the results of estimating a Heckman selection model for each of our (sub)samples, employing these two variables as our ‘selection-only’ variables. Table A5. Results Heckman selection model using bishop 600 and roman origin as selection only variables Christian (only Roman / Byzantine) 0.36***
all cities
Muslim
Christian
Latin West
non Latin West
0.40***
-
0.37***
0.41***
-
[0.00]
-
[0.00]
[0.00]
-
[0.00]
Mediterranean
0.20***
0.06
0.28***
0.26***
0.10
0.29***
[0.00]
[0.66]
[0.00]
[0.00]
[0.37]
[0.00]
Baltic
0.23**
-
0.29***
0.44***
-
0.36***
[0.03]
-
[0.01]
[0.00]
-
[0.00]
river
0.20***
0.16*
0.16***
0.24***
-0.16**
0.16***
[0.00]
[0.07]
[0.00]
[0.00]
[0.04]
[0.00]
hub
0.11***
0.20**
0.10**
0.13***
0.11
0.09**
[0.00]
[0.04]
[0.02]
[0.00]
[0.15]
[0.03]
-0.02
-0.23**
0.06
0.05
-0.12
0.07*
[0.52]
[0.02]
[0.12]
[0.20]
[0.20]
[0.05]
0.14**
0.04
0.34***
-
0.12
0.27**
[0.04]
[0.66]
[0.00]
-
[0.15]
[0.03]
0.63***
0.44***
0.18
-
0.44***
0.16
[0.00]
[0.00]
[0.38]
-
[0.00]
[0.45]
0.37***
0.31***
0.37***
0.36***
0.39***
0.40***
[0.00]
[0.00]
[0.00]
[0.00]
[0.00]
[0.00]
archbishop
0.68***
0.30***
0.78***
0.74***
0.43***
0.78***
[0.00]
[0.01]
[0.00]
[0.00]
[0.00]
[0.00]
capital
1.27***
1.11***
1.32***
1.34***
1.07***
1.43***
[0.00]
[0.00]
[0.00]
[0.00]
[0.00]
[0.00]
university
0.44***
0.37***
0.42***
0.38***
0.63***
0.43***
[0.00]
[0.01]
[0.00]
[0.00]
[0.00]
[0.00]
Muslim
0.37***
-
-
0.87***
0.07
-
[0.00]
-
-
[0.00]
[0.47]
-
0.16***
0.18**
0.08
0.03
0.18***
0.03
[0.00]
[0.03]
[0.21]
[0.61]
[0.05]
[0.63]
ln UP - Christian
0.31***
0.05
0.40***
0.43***
-0.14
0.45***
[0.00]
[0.67]
[0.00]
[0.00]
[0.14]
[0.00]
latitude
-0.11** [0.01] 0.00** [0.02] -0.02** [0.04] 0.91*** [0.00]
0.46*** [0.01] -0.01*** [0.00] 0.01 [0.86] -
0.02 [0.71] -0.00 [0.73] -0.03** [0.05] -
-0.15** [0.02] 0.00** [0.02] -0.03** [0.05] -
0.07 [0.59] 0.00 [0.76] 0.01 [0.76] -
-0.12* [0.08] 0.00* [0.08] -0.02 [0.19] -
Atlantic / sea
roman road caravan route caravan hub bishop
ln UP - Muslim
latitude^2 ln elevation ecozone 1
68
Although far from a proper test of this proposition, it is reassuring that the coefficients on our roman origin and bishop 600 variables are insignificant when adding both variables to our baseline (city size) regressions. Also, and a more proper test, using only one of the two variables as selection variable while including the other in the 2nd stage of the Heckman selection model generally shows (the only exception is the bishop 600 variable in the Latin West sample) that neither our roman origin nor our bishop 600 variable significantly explains a city’s size conditional on being selected in the sample. Results available upon request.
61
0.56*** [0.00] 0.12* [0.08] 0.41*** [0.00] 0.38*** [0.00] -
-0.46** [0.02] -1.01*** [0.00] -0.98*** [0.00] -0.89*** [0.00] -1.48*** [0.00]
0.41*** [0.00] 0.12 [0.17] 0.37*** [0.00] 0.56*** [0.00] -
0.38*** [0.00] 0.30*** [0.00] -0.64*** [0.01] -0.05 [0.61]
-0.17 [0.38] -1.05*** [0.00] -1.21*** [0.00] -0.77*** [0.00] -1.46*** [0.00]
0.28*** [0.00] 0.21*** [0.00] 0.72*** [0.00] -0.13 [0.14]
bishop 600 st (1 stage) roman origin st (1 stage)
0.03 [0.48] 0.12** [0.02]
0.12 [0.24] 0.32*** [0.01]
0.03 [0.55] 0.07 [0.21]
0.08 [0.11] 0.16*** [0.01]
0.12 [0.30] 0.11 [0.44]
0.03 [0.59] 0.12** [0.05]
p-value Mills ratio
[0.00]
[0.19]
[0.00]
[0.00]
[0.14]
[0.00]
nr observations non zeroes
8272 2409
1458 481
6814 1928
6787 1864
1485 545
6714 1908
ecozone 2 ecozone 3 ecozone 4 ecozone 5 ecozone 6
Notes: p-values in brackets. *, **, *** denotes significance at the 10%, 5%, 1% respectively. Note that in the results for the ecozone dummies do not have the same reference category in each column (in the Christian and Latin West sample ecozone is always excluded in addition to the reference category as no city in these samples is surrounded by lands of the best agricultural potential).
Again, our baseline results in Table 1 largely hold up to employing this two-stage method or become even stronger69. However, the evidence for Roman continuity appears to be stronger in Europe, providing more confidence in our ‘Heckman selection results’ than in case of the Muslim or non Latin West samples. Only when considering the total, the Latin West or Christian70 sample are our two ‘selection-only variables’ (jointly) significant in the first stage and is the Mills’ ratio significant in the second stage. The Arab Conquests, after which many cities [Baghdad, Cairo, Marrakech, Fez, etc] were actually founded from scratch (Kennedy, 2002), appear to have constituted a strong break in urban continuity: our two selection variables insignificant when considering the Muslim or non Latin West samples71 (see also our time-varying results regarding location on a former Roman Road in Table 3a, as well as Table A11). ----------------------------------------------------------------------------------------------------------------
69
Note that the increased significance of many variables partly results from our inability to calculate clustered standard errors (using Stata’s heckman, twostep command). Also given that our two ‘selection-only’ variables do not vary over time, one may as well consider the fixed effect results in Table 2. These fixed effect results are valid under less strict assumptions than those underlying our Heckman-estimations. 70 The final column in Table A5 shows that the insignificance of the roman origin variable in the Christian sample disappears when not considering the parts of Europe that were never part of the Roman Empire and those areas in the Arab World where Christianity lost its foothold immediately after the Arab Conquest (i.e. considering only those areas that remained Byzantine until the rise of the Ottomans). 71 Only in Andalusia, one of Rome’s most important provinces, did the Arab conquerors build to a large extent on the Roman urban structure (their main cities Seville, Cordoba and Granada were all important Roman towns). The significance of the roman origin variable in the Muslim sample immediately disappears when excluding the Muslim cities of Al-Andalus. Results available upon request.
62
Table A6a:
Transport, capital status and UP over time - Arab World (no city-specific FE) a. MUSLIM
year 800 900 1000 1100 1200 1300 1400 1500 1600 1700 1800 F-test equal
roman road -0.55* -0.47** -0.42** -0.48** -0.68*** -0.75*** -0.53* -0.39 0.23 0.48 0.08 [0.01]
caravan hub 0.46 0.56** 0.17 0.09 0.27 0.43** 0.48** 0.42 0.28 0.35 0.23 [0.13]
city FE century FE other variables observations
capital Muslim UP 0.90*** 0.59*** 1.10*** 0.51** 0.91*** 0.15 0.39** -0.05 0.56*** -0.12 0.60*** 0.37 0.56*** 0.40 0.81*** 0.04 0.82** -0.06 -0.27 0.94*** 0.97*** -0.11 [0.05] [0.01]
Christian UP -0.70 -0.72** -0.40 -0.59* 0.30 0.59** 0.52* 0.25 0.20 -0.13 -0.39 [0.01]
no [0.00] see baseline 481 b. NON LATIN WEST
year 800 900 1000 1100 1200 1300 1400 1500 1600 1700 1800 F-test equal city FE century FE other variables observations
roman road -1.08*** -0.48** -0.28 -0.56** -0.37** -0.31* -0.11 0.00 0.4* 0.7** 0.14 [0.00]
caravan hub 0.06 0.39* 0.20 0.34* 0.31 0.40* 0.36 0.26 0.21 0.32 0.22 [0.82]
capital Muslim UP 1.61*** 0.57*** 1.53*** 0.28 0.13 1.01*** 0.44* -0.15 0.40** -0.20 0.56*** -0.08 0.74*** 0.02 0.99*** 0.02 1.24** 0.01 1.44*** -0.14 1.16*** 0.04 [0.00] [0.10]
Christian UP 0.03 -0.05 -0.23 -0.21 -0.33 -0.06 -0.04 0.02 0.08 -0.42 -0.49** [0.05]
no [0.00] see baseline 545
Notes: *, **, *** denotes significance at the 10%, 5%, 1% respectively (based on autocorrelation and heteroskedastically robust standard errors).
63
Table A6b:
Transport, capital status and UP over time - Europe (no city-specific FE) a. CHRISTIAN
year 800 900 1000 1100 1200 1300 1400 1500 1600 1700 1800 F-test equal
Atlantic -0.53 -0.06 0.09 -0.07 0.11 0.32 0.20 0.26* 0.38*** 0.33*** [0.01]
Mediterranean 0.33 0.62*** 0.60*** 0.27* 0.18 0.07 0.11 0.27 0.08 0.26* 0.26** [0.23]
Baltic 0.36** 0.34** -0.12 0.20 0.15 -0.02 [0.08]
city FE century FE other variables observations
capital 1.54*** 0.58 0.38** 0.47*** 0.39*** 0.75*** 0.62*** 0.64*** 1.07*** 1.40*** 1.55*** [0.00]
Muslim UP -0.13 0.13 0.44* 0.18 -0.05 0.27** 0.31** 0.01 0.01 0.01 -0.15** [0.03]
Christian UP 0.02 0.03 -0.15 0.20 0.08 0.30*** 0.26** 0.20* 0.11 0.22*** 0.02 [0.02]
no [0.12] see baseline 1928 b. LATIN WEST
year 800 900 1000 1100 1200 1300 1400 1500 1600 1700 1800 F-test equal city FE century FE other variables observations
Atlantic -0.33 -0.21 -0.02 0.10 0.02 0.18 0.42 0.26 0.29** 0.41*** 0.39*** [0.07]
Mediterranean 0.29 -0.02 0.30* 0.15 0.12 -0.00 0.21 0.38** 0.19 0.33** 0.30** [0.15]
Baltic 0.43** 0.43*** -0.10 0.27 0.24 0.17 [0.07]
capital 1.05*** 0.35 0.36** 0.50*** 0.53*** 0.88*** 0.66*** 0.63*** 1.07*** 1.39*** 1.63*** [0.00]
Muslim UP -0.39 0.19 0.21 0.18 0.05 0.32* 0.34** -0.15 -0.16 -0.05 -0.16** [0.01]
Christian UP -0.31 0.12 -0.04 0.22 0.19 0.40*** 0.37** 0.24** 0.23* 0.26*** -0.01 [0.00]
no [0.07] see baseline 1864
Notes: *, **, *** denotes significance at the 10%, 5%, 1% respectively (based on autocorrelation and heteroskedastically robust standard errors).
64
Table A7. City-specific institutions, including also C.O.E. (Acemoglu et al., 2005) Geography bishop archbishop capital university Muslim protestant ln UP - Muslim ln UP - Christian commune active parliam ent constraint on the executive free / prince
R2 (within) nr observations century FE
all cities -
Christian -
Latin West -
-0.16* [0.09] 0.16 [0.30] 0.50*** [0.00] 0.19*** [0.01] 0.14 [0.21] -0.06 [0.58]
-0.08 [0.50] 0.42** [0.02] 0.45*** [0.00] 0.18** [0.02] -0.08 [0.42]
-0.11 [0.28] 0.35** [0.03] 0.51*** [0.00] 0.19*** [0.01] 0.44*** [0.00] -0.10 [0.36]
0.24** [0.02] 0.36*** [0.01]
0.27** [0.03] 0.50*** [0.00]
0.26** [0.03] 0.58*** [0.00]
0.12** [0.03] 0.10** [0.04] 0.06*** [0.01] 0.05 [0.38]
0.08 [0.17] 0.11** [0.03] 0.05** [0.03] 0.06 [0.27]
0.13** [0.02] 0.11** [0.03] 0.05** [0.04] 0.06 [0.27]
0.10 2085 [0.041]
0.13 1850 [0.004]
0.14 1792 [0.000]
Notes: p-values, based on autocorrelation and heteroskedastically robust standard errors, in brackets. *, **, *** denotes significance at the 10%, 5%, 1% respectively.
Figure A2 % Muslim cities / urban population in Arab World and Latin West 1
% muslim
.2
.4
.6
.8
Arab World
0
Latin West
800
900
1000
1100
1200
1300
urban population
1400
1500
1600
1700
number of cities
65
1800
Figure A3 Dependency of marginal effect local authority and parliamentary representation on Christian urban potential.
-.4
-.2
-.2
0
0
.2
.2
.4
.4
.6
.6
Total sample
0
1
2 ln christian urban potential
3
marg.eff commune density of ln Christian urban potential
4
0
5% confidence interval
1
2 ln christian urban potential
3
marg.eff active parliament density of ln Christian urban potential
4 5% confidence interval
-.2
-.4
-.2
0
0
.2
.2
.4
.4
.6
Christian
0
1
2 ln christian urban potential
3
marg.eff commune density of ln Christian urban potential
4
0
5% confidence interval
1
2 ln christian urban potential
3
marg.eff active parliament density of ln Christian urban potential
4 5% confidence interval
-.2
-.2
0
0
.2
.2
.4
.4
.6
Latin West
0
1
2 ln christian urban potential
marg.eff commune density of ln Christian urban potential
3
0
4
1
2 ln christian urban potential
marg.eff active parliament density of ln Christian urban potential
5% confidence interval
66
3
4 5% confidence interval
Table A8. % cities (by country) that ever have a ln Christian urban potential larger than two, and local authority or parliamentary representation respectively country
commune
active parliament
country
commune
active parliament
Austria
100%
83%
Poland
80%
10%
Belgium
83%
72%
Portugal
63%
0%
Czech Republic
71%
57%
Slovakia
67%
100%
Denmark
100%
0%
Spain
57%
90%
France
59%
68%
UK
48%
97% 100%
Germany
81%
19%
Switzerland
100%
Hungary
47%
100%
Rumania
15%
0%
Ireland
43%
86%
Sweden
67%
100%
Italy
32%
53%
Yugoslavia
13%
0%
Netherlands
87%
91%
Notes: the numbers denote the number of cities within each country that at least once are a commune or have parliamentary representation during our sample period and that have a ln Christian urban potential larger than two. Countries whose cities never qualify for these criteria are not reported in the Table.
Table A9a Time-varying results for the Non Latin West sample NON LATIN WEST year 800 900 1000 1100 1200 1300 1400 1500 1600 1700 1800 F-test equal? city FE century FE other variables Observations
roman road 0.49** 0.75*** 0.55* 0.77** 0.78** 0.92** 0.88** 1.41*** 1.67*** 1.20*** [0.00]
caravan hub 0.02 -0.19 -0.06 -0.09 0.04 0.06 -0.07 -0.21 -0.12 -0.21 [0.65]
capital 1.00*** 1.01*** 0.78*** 0.38** 0.35** 0.46*** 0.55*** 0.79*** 0.82*** 0.92*** 0.79*** [0.36]
Muslim UP 0.87*** 0.51* 0.47* 0.30 0.07 0.06 0.02 0.00 -0.09 -0.24 0.02 [0.03]
Christian UP 0.20 -0.10 -0.31 -0.29 -0.51 -0.31 -0.18 -0.06 -0.04 -0.31 -0.48 [0.01]
yes [0.09] see baseline 545
Notes: *, **, *** denotes significance at the 10%, 5%, 1% respectively (based on autocorrelation and heteroskedastically robust standard errors). The coefficients on the geography variables measure its effect relative to its effect in 800 [see Table A6a in the Appendix for the results without city-specific FE (showing the absolute effect of each geography variable by century, yet under the assumption of no city-specific FE)]. F-test equal? indicates the p-value on a test of equality of all century-specific effects for a specific variable (in case of the time-invariant geography variables this amounts to testing the joint significance of all – not dropped out – century specific dummies).
67
Table A9b Time-varying results for the Non Latin West sample LATIN WEST year 800 900 1000 1100 1200 1300 1400 1500 1600 1700 1800 F-test equal?
Atlantic 0.03 0.03 0.10 0.18 0.58 0.75** 0.68* 0.94** 1.12** 1.08** [0.00]
Mediterranean -0.10 0.11 -0.05 -0.14 -0.12 -0.18 0.01 -0.08 0.05 0.13 [0.31]
Baltic -0.26 -0.60*** -0.27 -0.37** -0.31 [0.00]
city FE century FE other variables observations
capital 0.81*** -0.09 -0.10 0.15 0.26** 0.54*** 0.53*** 0.48*** 0.75*** 1.10*** 1.33*** [0.00]
Muslim UP -0.57 0.10 -0.02 -0.06 -0.08 0.23** 0.27** 0.36 0.20 0.33 0.04 [0.04]
Christian UP 0.06 0.46 0.07 0.31 0.46** 0.86*** 0.78*** 0.74*** 0.77*** 0.77*** 0.56** [0.00]
yes [0.00] see baseline 1864
Notes: *, **, *** denotes significance at the 10%, 5%, 1% respectively (based on autocorrelation and heteroskedastically robust standard errors). The coefficients on the geography variables measure its effect relative to its effect in 900, 800, 1300 in case of location at the Atlantic, Mediterranean and Baltic respectively [see Table A6b in the Appendix for the results without city-specific FE (showing the absolute effect of each geography variable by century, yet under the assumption of no city-specific FE)]. F-test equal? indicates the pvalue on a test of equality of all century-specific effects for a specific variable (in case of the time-invariant geography variables this amounts to testing the joint significance of all – not dropped out – century specific dummies).
----------------------------------------------------------------------------------------------------------------
A.2 Geographical conditions in Europe and the Arab World in some more detail To give an idea of the differences in geographical endowments between the two regions, Table A10 shows, for both the Arab World and the Latin West (defined as in section 4.1), the percentage of cities located at sea, at a navigable river, at a (hub of) roman road(s), or at a (hub of) caravan route(s). It also shows the average elevation (in meters) as well as the average agricultural potential of cities in the two regions.
Table A10 Cities’ geographical characteristics Variable sea river***
Latin West 0.21 (0.40) 0.58 (0.49)
Arab World 0.31 (0.46) 0.29 (0.45)
roman road** hub** caravan route caravan hub
0.60 (0.49) 0.38 (0.48) -
0.74 (0.44) 0.55 (0.50) 0.84 (0.37) 0.44 (0.50)
longitude*** elevation (m)*** ecozone
45.9 (5.34) 149 (196) 3.87 (0.82)
36.0 (3.33) 322 (403) 3.96 (1.48)
Notes: mean (standard deviation). ***, **, * denotes that the means for Europe and the Arab World are significantly different at the 1%, 5% or 10% level respectively.
68
Regarding the possibilities for long-distance water-based transportation, Table A10 shows Europe’s relative abundance of navigable rivers compared to the Arab World. Almost 60% of the European cities are located on a navigable river compared to only 30% in the Arab World. Somewhat surprisingly, more cities in the Arab World are located at sea than in the Latin West, but the difference is not statistically significant. Turning to cities’ land-based transportation possibilities, we find that a significantly higher percentage of cities is located on (a hub of) the former Roman road network in the Arab World than in Europe. This however largely reflects the fact that several parts of Europe (e.g. Scandinavia, Ireland, large parts of Germany, and Poland) were never part of the Roman Empire. When comparing the Arab World to only those countries in Europe that were part of the Roman Empire, the differences in the percentage of cities located on a former Roman road are no longer significant72: an indication of the similarity in Roman heritage between the two regions. In contrast, cities located on the caravan network are only found in the Arab World. The caravan network connected Morocco to Sudan to India by camel-back, passing through many of the urban centers in the Arab World. In Europe the camel never gained similar importance in overland trade. The main reason for this is the camel’s physiology that makes it perfectly suitable for desert life (it can withstand extreme heat and desication and its feet form cushions spreading its weight on the sand), but it is generally incapable of surviving in swampy or permanently wet areas and its cushioned feet are a disadvantage in stony, mountainous areas (Wilson, 1984 p.17). As a result, even in Muslim Spain, “there never was
time for camel breeders to gain foothold in the economy, and … camels stood no chance of becoming established in the region on a large scale." (Buliet, 1975 p.229/230). Finally, regarding cities’ agricultural potential, Table A10 shows that the European cities are generally located at significantly lower altitudes and higher longitude than their Arab counterparts. A closer look however reveals that the former is largely driven by the cities on the Anatolian Plateau. When not considering the currently Turkish cities in our sample, the average Arab city is located at 186 meters above sea level which is still higher, but no longer significantly different, from the average elevation in the Latin West (p-value: 0.443). Arguably somewhat surprisingly, the average agricultural potential of the hinterland surrounding the cities in the Arab World is not statistically different from that in Europe. 72
The percentages for Europe are in that case: 64% for location on a Roman road (p-value 0.10) and 40% (pvalue 0.04) for location on a hub of Roman roads.
69
Figure A4. Distribution of agricultural potential in Europe and the Arab World agricultural potential .8 .6
.6
.8
.8042
Fraction .4
Arab World
Latin West
.4
.3842
.2
.2
.2537
.1232 .0788
.0887
.11
.0714
.0547 .0263
0
0
.0048
1
2
3 4 ecozones
5
6
1
2
3 4 ecozones
5
6
Notes: the histograms depict the share of cities >= 10,000 inhabitants in each of the six ecozones (for their geographical distribution see Figure A1).
This somewhat surprising finding can however be explained by looking in some more detail at the distribution of agricultural potential over the cities in Europe and over those in the Arab World. Figure A4 plots the share of cities surrounded by a hinterland with an agricultural potential corresponding to each of the six productivity classes defined in Buringh et al. (1975). The means of both distributions may be the same (see Table A10). But where in Europe most cities are actually surrounded by lands of average agricultural potential (class 4), this is the case for only 7% of cities in the Arab World. In the Arab World we find 42% of cities, mainly in the Nile and Euphrates and Tigris river valleys, in an above-average (3 or lower), and 50% in a below-average (5 or higher) agricultural potential class. In Europe these percentages are much lower (13% and 6% respectively); even none of the European cities are surrounded by agricultural lands of excellent agricultural potential (class 1). In sum, whereas agricultural potential in Europe is very homogenous and of average quality, in the Arab World it is very heterogeneous: either very good or quite bad, with the areas of very good agricultural potential geographically clustered in mainly the Nile, Euphrates and Tigris river valleys (see also Figure A1 in the Data Appendix). ----------------------------------------------------------------------------------------------------------------
70
Table A11. (Arch)bishoprics in 600 % of (arch)bishoprics in 600
# (arch)bishoprics in 600
ever >= 10k during 800-1800
Algeria Tunisia Libya Egypt Palestine Syria & Lebanon Iraq Turkey Cyprus Greece
115 135 11 76 69 50 21 391 13 87
3% 4% 9% 3% 3% 8% 0% 7% 0% 2%
Italy France Iberia
252 118 69
27% 48% 46%
Total
1407
15%
Country
71