Financial Innovation and Endogenous Growth Stelios Michalopoulos, Luc Laeven, and Ross Leviney September 10, 2009
Abstract We model technological and …nancial innovation as re‡ecting the decisions of pro…t maximizing agents and explore the implications for economic growth. We start with a Schumpeterian endogenous growth model where entrepreneurs earn monopoly pro…ts by inventing better goods and …nanciers arise to screen entrepreneurs. A novel feature of the model is that …nanciers also engage in the costly, risky, and potentially pro…table process of innovation: Financiers can invent more e¤ective processes for screening entrepreneurs. Every existing screening process, however, becomes less e¤ective as technology advances. Consequently, technological innovation and, thus, economic growth stop unless …nanciers continually innovate. Historical observations and empirical evidence are more consistent with this dynamic model of …nancial innovation and endogenous growth than with existing models of …nancial development and growth. Keywords: Invention; Economic Growth; Corporate Finance; Financial Institutions; Technological Change, Entrepreneurship. JEL classi…cation Numbers: G0; O31; O4
We thank Philippe Aghion and Peter Howitt for insightful conversations, Nick Coleman for helpful suggestions, and Lindsay Mollineaux for outstanding research assistance. We also thank seminar participants at Brown University, the University of Modena, Collegio Carlo Alberto for useful comments.The views expressed in this paper are entirely those of the authors. They should not be attributed to the International Monetary Fund. y Michalopoulos: Tufts University; Laeven: IMF and CEPR; and Levine Brown University and NBER.
1
1
Introduction
Financial innovation has been an integral component of economic activity for several millennia. About six thousand years ago, the Sumerian city of Uruk blossomed as tradable debt contracts emerged to facilitate a diverse assortment of intertemporal transactions underlying increased specialization, innovation, and economic development (Goetzmann, 2009). In ancient Rome, private investors steadily developed all of the features of limited liability companies, including freely traded shares, an active stock exchange, and corporations that owned property and wrote contracts independently of the individual shareholders. The creation of these corporations eased the mobilization of capital for innovative, large-scale mining technologies (Malmendier, 2009). To …nance the construction of vast railroad systems in the 19th and 20th centuries, …nancial entrepreneurs developed highly specialized investment banks, new …nancial instruments, and improved accounting systems to foster screening by distant investors (Baskin and Miranti, 1997; and Neal, 1990). Over the last couple of centuries, …nanciers continuously modi…ed and enhanced securities to mitigate agency concerns and informational asymmetries impeding the …nancing of frontier technologies (Graham and Dodd, 1934; Allen and Gale, 1994; and Tufano, 2003). More recently, …nancial entrepreneurs created venture capital …rms to screen high-tech inventions and then modi…ed these arrangements to support biotechnology endeavors (Schweitzer, 2006). Yet, models of economic growth generally ignore …nancial innovation and instead take the …nancial system as given and inert. Most frequently, …nancial arrangements are added to the core models of endogenous technological change developed by Romer (1986, 1990) and Aghion and Howitt (1991). For example, in King and Levine (1993) and Galetovic (1996), the …nancial system a¤ects the rate of technological change by determining the frequency with which society allocates funds to those entrepreneurs with the highest probability of successfully innovating. In Aghion, Howitt, and Mayer-Foulkes (2005), henceforth denoted as AHM, di¤erences in …nancial development determine the resources available to entrepreneurs for innovation. In Bencivenga and Smith (1991), Levine (1991), and Obstfeld (1994), …nance in‡uences long-run growth by a¤ecting the risk of investing in high-return projects. In these models, however, …nancial contracts, markets, and intermediaries do not emerge and evolve endogenously with technological change. Even in models where the size of the …nancial system changes as the economy develops, the same pro…t motives that underlie technological innovation do not spur …nancial innovation. In Greenwood and Jovanovic (1990), …nancial intermediaries produce information about in2
vestment projects and thereby improve capital allocation. Since there is a …xed cost to joining …nancial intermediaries, growth means that more individuals can a¤ord to join and bene…t from …nancial intermediation, which enhances the e¢ ciency of capital allocation and accelerates economic growth. Thus, economic growth and membership in the …nancial intermediary evolve together. In Greenwood, Sanchez, and Wang (2009), …nancial intermediaries invest resources to monitor …rms. When …nancial institutions invest more resources, this enhances capital allocation and accelerates growth. Yet, in these models, improvements in the e¤ectiveness of the monitoring technology are ultimately exogenous, so that the rate of …nancial innovation is not determined by the choices of pro…t maximizing agents. In this paper, we model both technological and …nancial innovation as re‡ecting the pro…t maximizing decisions of individuals and explore the implications for economic growth. We start with a textbook model of Schumpeterian growth, where entrepreneurs seek to extract monopoly pro…ts by engaging in the costly and risky process of inventing new goods and production methods (Aghion and Howitt, 2009). Financiers arise to screen potential innovators and identify the most promising ones. A novel and de…ning feature of our model is that …nancial entrepreneurs also innovate to maximize pro…ts. Financiers can engage in a costly and risky innovative activity that, if successful, allows them to screen entrepreneurs better than competing …nanciers. Successful …nancial innovation, therefore, generates monopoly rents for the …nancier, just as successful technological innovation generates monopoly rents for the technological entrepreneur. Unlike Boyd and Prescott (1986), coalitions of agents - …nancial institutions - do not emerge to screen and monitor entrepreneurs. Rather, individuals are willing to pay for information about entrepreneurs, so …nanciers arise to provide this information. Moreover, we endogenize the actions of …nanciers. Financiers maximize pro…ts by seeking to create better screening technologies than their competitors. A second noteworthy feature of the model is that every existing screening methodology becomes less e¤ective at identifying promising entrepreneurs as technology advances. For example, the processes for screening the builders of new, cross-Atlantic ships in the 16th century were less e¤ective at screening innovations in railroad technologies in the 19th century. The methods for screening pharmaceuticals in the 1960s are less appropriate for evaluating biotechnology …rms today. At the same time, technological innovation increases the potential pro…ts from …nancial innovation. Thus, technological innovation makes existing screening technologies obsolete and enhances the returns to inventing improved screening methods. For example, the
3
potential pro…ts from enhanced screening drove …nanciers to develop specialized investment banks, new contracts, and more elaborate reporting standards to screen railroads and to create venture capital …rms to better evaluate and monitor new high-tech …rms. Financial and technological innovations are inextricably linked. Two central, interrelated implications of the theory are that (1) technological change and …nancial innovation will be positively correlated and (2) economic growth will eventually stagnate unless …nanciers innovate. Technological change increases the returns to …nancial innovation, and improvements in the screening methodology boost the expected pro…ts from technological innovations. At the extreme, in the absence of …nancial innovation, existing screening methods will become increasingly obsolete as technological innovation continues, so that the probability of identifying successful entrepreneurs falls toward zero, eliminating growth. Pro…t seeking …nanciers, however, can avoid economic stagnation by creating new, more e¤ective screening technologies. The drive for pro…ts by …nancial and technological entrepreneurs alike, therefore, can produce a continuing stream of …nancial and technological innovations that sustain long-run growth. Though the major contribution of this paper is the development of a theoretical model in which the pro…t maximizing decisions of technological and …nancial entrepreneurs drive economic growth, we also present three types of evidence that advertise the value of this dynamic model of …nancial innovation and endogenous growth. First, the model predicts that technological innovation should be positively correlated with …nancial innovation. We assess this prediction by examining whether labor productivity growth in the …nancial sector is correlated with that of other industries from 1967 to 2000 in the United States. The correlation coe¢ cient between productivity growth in the …nancial and manufacturing sectors is almost one (0.99), suggesting a powerful link between technological and …nancial innovation. Second, cross-country growth comparisons further emphasize the central role of …nancial innovation in economic growth. AHM show that the level of …nancial development, as measured by the ratio of private credit to Gross Domestic Product (GDP) shape whether a country converges to the technological leader. Our theory suggests that it is the rate of …nancial innovation that determines the likelihood of a country converging to the growth rate of the frontier economy. This is what we …nd. Using the growth rate of the ratio of private credit to GDP as an empirical proxy for …nancial innovation, the evidence is consistent with the view that …nancial innovation is crucial for economic growth. While the growth rate of private credit to GDP is an unsatisfactory measure of improvements in screening technology, this additional
4
piece of evidence underscores the value of incorporating …nancial innovation into our models of entrepreneurship and growth. Third, as emphasized above and developed further below, history exempli…es the importance of …nancial innovation for igniting and sustaining economic growth. For example, Harris (1994; 1997; 2000) stresses that legal impediments to …nancial innovation, especially limits on the creation of limited liability corporations, temporarily slowed technological invention and economic growth in England and France during the 18th and 19th centuries. In particular, restrictions on the use of limited liability impeded …rms from growing to e¢ cient sizes and shareholders from diversifying their investment across several …rms while receiving a reliable ‡ow of information about those …rms. Similarly, Kuran (2006) links the comparative underdevelopment of the Islamic world with stagnant …nancial arrangements. Although the …nancial rules of Islam were e¢ cient for a few centuries, they were not adaptable enough to permit the creation of new …nancial arrangements, such as the limited liability corporation, to mobilize, pool, and administer the funds of thousands of investors. According to Kuran (2006), the Islamic system stymied …nancial innovation and therefore severely hindered technological innovation and growth. As another example, recent research shows that when regulators removed impediments to competition in the U.S. banking system, this stimulated the development and spread of new …nancial technologies for screening …rms, with positive rami…cations on entrepreneurship and economic growth (Hubbard and Palia, 1995; Jayaratne and Strahan, 1996; Black and Strahan, 2002; Kerr and Nanda, 2009; and Beck, Levine, and Levkov, 2009). In the paper, we discuss the series of …nancial innovations that spurred the development of railroads, as well as other examples from …nancial history, to further stress the indispensable role of …nancial innovation in supporting continuous improvements in technology. From a policy perspective, the paper stresses adaptability and innovation as key elements for sustaining economic growth. Growth eventually stops in the absence of …nancial innovation. Legal, regulatory, or policy impediments to …nancial innovation stymie technological change and economic growth in the long-run. Rather than stressing policies that support a particular level of …nancial development, the theory highlights the value of policies that facilitate e¢ cient improvements in screening technologies (Merton, 1995). Furthermore, our paper contributes to debates on the costs and bene…ts of …nancial innovation provoked by the recent …nancial crisis. Many argue that recent …nancial innovations facilitated the extraction of short-run pro…ts for …nanciers, not improvements in screening methodologies that enhance social welfare. For example, Dell’Ariccia, Igan, and Laeven (2008),
5
Mian and Su… (2009), and Keys, et al. (2010) show that securitization, one of the key …nancial innovations in recent years, reduced lending standards and increased loan delinquency rates, while simultaneously boosting the supply of loans and …nancier pro…ts (Loutskina and Strahan, 2009). Financial innovation can be harmful. We do not conduct an assessment of the pros and cons of …nancial innovation. Rather, we develop a new theoretical framework in which pro…t maximizing …nanciers play a central role in the process of endogenous growth and provide empirical evidence consistent with the model’s predictions. In the future, this framework can be extended to include policy and other distortions that create incentives for …nancial innovations that increase …nancier pro…ts at the expense of social welfare. From this perspective, our paper represents an initial step toward building a more general, dynamic theory of endogenous growth, …nancial innovation, and …nancial regulation. One limitation of our analysis is that we de…ne …nance narrowly. We examine only the role of the …nancial system in screening innovative activities. We do not model risk diversi…cation, pooling, and trading. We do not examine the role of the …nancial system in reducing transaction costs, enhancing the governance of …rms, or in mitigating the moral hazard and adverse selection problems arising from informational asymmetries. Rather, we focus on one critical …nancial function –acquiring and processing information about investments before they are funded. The remainder of the paper is organized as follows. Section 2 outlines the basic structure of the model, and Section 3 solves the model, determines the factors underlying steady state growth, and derives testable implications. Section 4 provides additional historical examples and suggestive empirical evidence. Section 5 concludes.
2
The Basic Structure of the Model
We begin with the Schumpeterian growth model developed by AHM. Economic activity extends over in…nite discrete time. There are k countries that do not exchange goods or factors, but do make use of each others’ technological ideas. There is a continuum of individuals in each country whose …xed population is normalized to one so that aggregate and per capita quantities coincide. Each individual lives two periods and is endowed with three units of labor in the …rst period of life and none in the second period. The utility function is linear in consumption, so that U = c1 + c2 ; where c1 is consumption in the …rst period of life, c2 is consumption in the second period of life, and
2 (0; 1) is the rate at which individuals discount the utility of 6
consumption in period 2 relative to that in period 1.
2.1
Final Output
In every period the economy produces a …nal good combining labor and a continuum of specialized intermediate goods according to the following production function: Z 1 1 A1i;t xi;t di; Zt = L 2 (0; 1);
(1)
0
where xi;t is the amount of intermediate good i in period t with technology level of Ai;t : L is the labor supply, which is normalized to unity. The …nal good Z is used for consumption, as an input into entrepreneurial and …nancial innovation, and as an input into the production of intermediate goods. The production of the …nal good, which we de…ne as the numeraire, occurs under perfectly competitive conditions. Thus the price of each intermediate good equals its marginal product: pi;t =
2.2
Ai;t xi;t
1
:
(2)
Intermediate Goods
In each intermediate goods sector i, a continuum of individuals with an entrepreneurial idea is born in period t
1. Only one entrepreneurial idea per sector has a positive probability of
producing a successful innovation and improving the production technology in period t: The quality of each entrepreneurial idea is unknown to the entrepreneur and households looking to invest in entrepreneurial ideas. As we discuss below, …nanciers arise to screen entrepreneurial ideas and identify the entrepreneur that is capable of innovating. Let
e i;t
equal the probability that the capable entrepreneur successfully innovates, so
that the level of technology of intermediate goods sector i in period t, Ai;t , is de…ned as ( ) At with probability ei;t Ai;t = , e Ai;t 1 with probability 1 i;t
(3)
where At is the world technology frontier. The world technology frontier grows at a constant rate g, which is taken as exogenous for now, but which we derive formally below. If the capable entrepreneur successfully innovates, she can produce intermediate goods at the rate of one unit of intermediate good per one unit of …nal good as input. Entrepreneurs who do not innovate can produce at the rate of one unit of intermediate good per 7
units of …nal
good as input, where
> 1. Thus, successful innovators enjoy a production cost advantage
over entrepreneurs who do not innovate. In every intermediate sector, there exists an unlimited number of people – the competitive fringe – capable of producing at the rate of one unit of intermediate good per
units of the …nal good as input.
Successful innovators become the sole producers in their respective intermediate sectors. They charge a price equal to the unit cost of the competitive fringe ( ) and earn monopoly pro…ts. In intermediate goods sectors where entrepreneurial innovation is unsuccessful, production occurs under perfectly competitive conditions, so that the price equals the unit cost of the competitive fringe ( ) and unsuccessful innovators earn zero pro…ts. Thus, in all intermediate goods sectors, the price, pit , equals . Successful innovators earn monopoly pro…ts. Using the demand function for intermediate goods from equation (2), the quantity demanded for intermediate good i equals 1 1
xi;t = Since pro…ts per intermediate good equal
Ai;t :
(4)
1, a successful innovator in sector i earns pro…ts
of 1 1
i;t
2.3
= Ai;t ; where
=(
1)
:
(5)
Financiers
Financiers screen individuals with entrepreneurial ideas and assess which entrepreneur is capable of innovating. In return for their screening services, …nanciers are paid a share of entrepreneurial pro…ts which we describe formally below. Financiers provide their assessments of entrepreneurial ideas to households, who use this information to make investment decisions. In the absence of pro…t maximizing …nanciers that screen entrepreneurial ideas, innovative activity ceases because households are unwilling to provide resources to unscreened entrepreneurs since the probability of the project being successful is of measure zero. For the same reason, households do not invest in entrepreneurs that …nanciers designate as not capable of innovating. A …nancier can earn monopoly rents by successfully inventing a better screening technology than competitor …nanciers. In period t
1, a single …nancier has a positive probability
of successfully innovating and improving the screening technology in each intermediate sector i. A successful …nancial innovation in sector i allows the respective …nancier to identify the capable entrepreneur in sector i with probability one. In the absence of successful …nancial 8
innovation, there is a positive probability that …nanciers designate the wrong entrepreneur as capable. Each intermediate sector has its own screening technology, re‡ecting the possibility that screening processes di¤er across sectors. For example, e¤ectively screening innovations in railroad technology requires di¤erent techniques from those used to screen innovative activities in information technology. Let
f i;t
equal the probability that a …nancier in sector i successfully innovates and im-
proves the screening technology, so that the level of screening technology in intermediate goods sector i in period t, mi;t , is de…ned as 8 < At mi;t = : m i;t
with probability 1
with probability 1
f i;t f i;t
9 = ;
:
(6)
We index the level of the potential frontier of the screening technology by the aggregate level of the frontier technology in the economy, At . As the technological frontier advances, the potential frontier screening technology also advances, though the actual screening technology, mi;t , may lag behind the frontier screening technology, At . If …nancial innovation is successful, the successful …nancier becomes the monopolist producer of this frontier screening technology, At in her sector. If the …nancier does not successfully innovate, then the available screening technology in sector i in period t
1 is the screening technology of period t
1, which is mi;t
1.
As with entrepreneurial innovation, we assume that an unlimited number of individuals – a competitive fringe – can screen entrepreneurial ideas in sector i during period t using the screening technology from period t
1, mi;t
1.
The probability that the …nancier in sector i correctly identi…es the capable entrepreneur, i;t ,
is a function of the gap between the level of the intermediate sector’s technology and the
level of the screening technology. If the …nancier successfully innovates, then there is no gap. If the …nancier does not successfully innovate, then the …nancial gap re‡ects the di¤erence between the sector’s technology and last period’s screening capabilities, so that 9 8 < At =At = 1 with probability fi;t = : i;t = mi;t =At = f ; i;t 1 : m with probability 1 i;t 1 =At = 1+g i;t
(7)
Consequently, a successful …nancier – a …nancier that successfully innovates in sector i
in period t
1 – will choose the entrepreneur capable of delivering a technological innovation
in period t with probability one. In a sector where the …nancier does not innovate in period t, the probability of correctly identifying the potential entrepreneur is less than one, equaling the
9
ratio of that sector’s screening capacity as of period t
1, mi;t
1,
relative to the technological
frontier of period t: In the presence of technological innovation but in the absence of …nancial innovation, the screening technology becomes increasingly ine¤ective at identifying the capable entrepreneur. This growing …nancial gap reduces the probability that society invests in the best entrepreneurial ideas with adverse rami…cations on technological change. More formally, as technology advances (as At increases), the probability that the …nancier successfully identi…es the capable entrepreneur,
i;t
= mi;t =At , falls without a concomitant advance in the screening technology,
mi;t . Financiers are paid by entrepreneurs in the form of a share,
i;t ,
of entrepreneurial
pro…ts. Though all screened entrepreneurs sign a perfectly enforceable contract regarding this share, only one entrepreneur is designated as capable and receives external …nancing. The …nancier’s fraction of entrepreneurial pro…ts,
i;t ,
is determined endogenously in the model.
In sectors with successful …nancial innovation, the successful …nancier is the sole provider of the frontier screening technology and charges a monopoly price in the form of a high share of entrepreneurial pro…ts. More speci…cally, the successful, monopolist …nancier charges a price such that the entrepreneur is indi¤erent between using the frontier screening technology and using the old screening technology available to the competitive fringe. For simplicity but without loss of generality, we assume that the perfectly competitive fringe can provide the old screening technology at zero cost, so that entrepreneurs using the competitive fringe of …nanciers keep 100% of the pro…ts.
2.4
Timing of Events
At the beginning of each period t
1 in each sector, unscreened entrepreneurs solicit screening
from the …nancier with the potential to innovate. The …nancier both borrows money from households and invests in …nancial innovation. If the …nancier fails to innovate, the competitive fringe of …nanciers use the existing screening technology as of period t
1 to identify
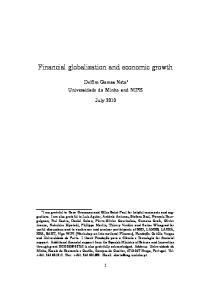
and designate one entrepreneur as capable. If the …nancier successfully innovates, then this new screening technology identi…es the capable entrepreneur with probability one. Next, the entrepreneur designed as capable borrows from households and invests in innovation. In period t, uncertainty about entrepreneurial innovation is resolved. If the entrepreneur successfully innovates, she repays the households for their investment in innovation, pays the contracted fraction of pro…ts to the …nancier, and keeps the remaining pro…ts. If feasible, the
10
…nancier then pays back households who lent money for …nancial innovation. Figure 1 below summarizes all possible scenarios.
Intermediate Good' s Non − Rated Entreprene urs Financial Entreprene urs
Financial R & D µt f
1 − µt f
Goods R & D under Standard Financial Technology
Goods R & D under Succesful Financial R & D
µte Innovation
1 − µte
1 − µte (λt )
Non − Innovation
Non − Innovation
µte (λt ) Innovation
Figure 1: Timing of Events
3
Innovation and Aggregate Growth
3.1
Entrepreneurial Innovation
The probability that a capable entrepreneur successfully innovates in period t,
e , i;t
depends
positively on the quantity of …nal goods invested in entrepreneurial innovation during period t
e 1, Ni;t
1,
so that e Ni;t
1
=(
e i;t )
At ;
> 1:
As in AHM, the cost of innovation in terms of …nal goods input increases proportionally with the world technology frontier, At , so that it becomes more expensive to maintain an innovation rate of
e i;t
as the technology frontier advances.
11
e In equilibrium, each capable entrepreneur chooses Ni;t
1
to maximize expected prof-
its. Given the contractual agreement between entrepreneurs and …nanciers, the entrepreneur designated as capable keeps the fraction (1
i;t )
of expected entrepreneurial pro…ts
e , i;t
so
that e i;t
= (1
e i;t
i;t )
e Ni;t
At
1
:
(8)
Risk neutral individuals in the …rst period of life provide resources to entrepreneurs designated as capable by …nanciers. They provide unlimited resources to entrepreneurs at a sector speci…c interest rate that is an inverse function of the quality of the screening technology in the sector. De…ning the risk free interest rate as r = 1=
1, the interest rate charged
e = to an entrepreneur that is rated as capable by a successful …nancier is Ri;t 1+r
e = households charge the interest rate of Ri;t
e i;t i;t
1+r e i;t
. In turn,
to entrepreneurs designated as capable
by the competitive fringe of …nanciers that conducted the screening using the sector speci…c screening technology from the last period. Recall that
i;t
= 1 for …nanciers that successfully
innovate, so these two interest rates are fully consistent. First, consider entrepreneurs that are screened by successful …nanciers, so that the entrepreneur designated as capable knows with probability one that she is the capable entrepreneur. She then chooses to borrow and invest in innovation, such that the pro…t maximizing probability of successfully innovating is 1=( e i;t
where we assume that
<
=
1)
;
(9)
to ensure that the equilibrium probability of successful en-
trepreneurial innovation is less than one (
e;t
< 1) under perfect …nancial screening. Since
entrepreneurs repay …nanciers only when they successfully innovate,
i;t
does not a¤ect invest-
ment in entrepreneurial innovation. From (9), the comparative statics with perfect screening are intuitively appealing. Entrepreneurs invest more in innovation and boost the probability of success when (1) the net pro…ts per unit of the intermediate good, innovation, ; is lower. If
and
, are higher and (2) the cost of entrepreneurial
are common across sectors, then
e i;t
=
e t
8 i.
Substituting (9) into (8) yields the net expected pro…ts of an entrepreneur screened by a successful …nancier, e i;t
= (1
e i;t ) t
12
' At ;
(10)
where ' =
(1
1= ):
Second, consider entrepreneurs screened by the competitive fringe of …nanciers using the old, imperfect screening technology, mi;t the pro…ts, so that e0 ; i;t
i;t
1.
Under these conditions, the entrepreneur keeps all
= 0. Thus, the expected pro…ts to an imperfectly screened entrepreneur,
i.e., the expected pro…ts of an entrepreneur screened using the old screening technology is e0 i;t
e i;t i;t
=
Nte 1 :
At
(11)
Consequently, the pro…t maximizing probability of entrepreneurial innovation for imperfectly screened entrepreneurs,
0
e;t ;
is e0 i;t
=(
1
i;t )
1
e:
(12)
Substituting (12) in (11) one derives the maximal net expected revenue of an entrepreneur selected using the old screening technology as e0 i;t
=(
i;t )
e t
1
' At :
(13)
The following Lemma establishes the properties of entrepreneurial innovation in sector i when using the old screening technology,
i;t ,
Lemma 1 The properties of entrepreneurial innovation in sectors using the old, imperfect screening technology: 1. Entrepreneurs invest more in innovation and boost the probability of successful innovation when (1) the net pro…ts per unit of the intermediate good, , are higher and (2) the cost of entrepreneurial innovation, ; is lower, i.e., 0
@ ei;t @
> 0;
e0 i;t
@ @
< 0:
2. Entrepreneurial innovation is an increasing function of a sector’s …nancial e¢ ciency, i.e., @ @
e0 i;t
i;t
>0
i;t
Proof. These properties follow by directly di¤erentiating equation (12) We can now derive the fraction of entrepreneurial pro…ts accruing to the entrepreneur (1
i;t )
and …nancier (
i;t ).
For the unrated entrepreneurs in the beginning of period t
1 to
be indi¤erent between choosing a contract with a successful …nancier or using the old screening 13
technology supplied by the competitive fringe, these two alternatives must deliver the same expected pro…ts. Formally, (10) must equal (13), so that i;t
=1
(
i;t )
1
:
(14)
Equation (14) indicates that the better is a sector’s …nancial screening capacity (higher i;t )
the lower is the fraction of entrepreneurial pro…ts (
i;t )
that a successful …nancier can
demand. This occurs because if a sector’s old screening technology is close to the frontier screening technology, then the competitive fringe o¤ers a close substitute. On the other hand, if the sector’s old screening technology is a poor substitute for a successful …nancier’s newly developed screening capabilities, then the …nancier can obtain a larger fraction of expected entrepreneurial pro…ts.1
3.2
Financial Innovation
As with entrepreneurial innovation, the probability that the capable …nancier in sector i sucf i;t ,
cessfully innovates during period t,
depends positively on the quantity of resources invested f 1, Ni;t
in …nancial innovation during period t f Ni;t
1
=(
f f i;t )
1:
At ;
> 1;
where the cost of …nancial innovation in terms of the …nal goods input increases proportionally with the world technology frontier, At . Thus, it becomes more expensive to maintain the same rate of …nancial innovation,
f i;t ,
as the technological frontier advances since the entrepreneurs
that are screened by …nanciers are striving to reach the world technology frontier. f The …nancier chooses Ni;t
1
to maximize expected pro…ts,
novating …nancier keeps the fraction
i;t
f i;t .
Since a successfully in-
of expected entrepreneurial pro…ts,
e , i;t
the …nancier’s
expected pro…ts equals f i;t
=
f i;t
i;t
1
e i;t
f Ni;t
1:
(15)
This implication hinges on the assumption that innovative …nanciers live only for two periods and may obtain pro…ts, if successful, only in the second period of their lives. This structure does not allow …nanciers to internalize the positive e¤ect of the current period …nancial innovation on next period’s standard screening technology. Extending the model to incorporate long-lived …nanciers with property rights on both the short and long-run e¤ects of …nancial innovation, would feature two counterbalancing forces. On the one hand, the increased horizon over which …nanciers may reap the bene…ts of their innovation would spur …nancial investments, whereas the fact that …nanciers could still derive pro…ts by charging for the use of the standard …nancial technology would dampen …nancial innovation. Endogenizing both the length of property rights over …nancial and entrepreneurial innovations, through an optimal patent system for example, is a potential extension of the model.
14
f The …nancier maximizes pro…ts by borrowing Ni;t
worth of …nal goods and investing
1
these resources in …nancial innovation. Risk neutral individuals lend …nal goods output to …nanciers seeking to innovate at an interest rate of Rtf =
1+r f e t;i t;i
, which is a function of the risk
free interest rate, r, the probability that the …nancier successfully innovates, and the probability that the entrepreneur designated by the …nancier as capable successfully innovates. After substituting (14) into (15), the …nancier chooses to borrow and invest in …nancial innovation such that pro…t maximizing probability of successful …nancial innovation in sector i during period t is
f i;t
e t
=
'(1
(
i;t )
1
f
where we assume that
f
>
)
!
1 1
;
(16)
to ensure that the rate of …nancial innovation is always less than
one.
3.3
Aggregating the Financial System
To examine the e¢ ciency of a country’s …nancial system, we aggregate the behavior of …nanciers across individual sectors to focus on the average, or representative, probability that a …nancier successfully identi…es the capable entrepreneur, Z 1 t =
i;t di;
0
where
i;t
equals the probability that the …nancier in sector i correctly identi…es the capable
entrepreneur in sector i during period t. From equation (7), this average level of …nancial e¢ ciency evolves according to the following equation:
t
=
f t
+ (1
f t)
t 1
1+g
:
(17)
On average, the …nancial sector identi…es the capable entrepreneur with probability one in the fraction
f t
of the sectors in which the …nancier successfully innovated last period. Since we
aggregate …nancial e¢ ciency across a continuum of sectors, we ignore negligible relative size di¤erences. In the remaining 1
f t
entrepreneur with a probability of
1+g
…nancial innovation probability, …nancial innovation probability,
of the sectors, the …nancial sector identi…es the capable t 1
< 1. To be precise, each sector will have a di¤erent
f t;i . On average, however, this probability equals the f t , which is derived by substituting (18) into (16).
15
average
To obtain the steady state level of average …nancial e¢ ciency, let f t
=
f t
in the steady state and then solve for =
t
=
t 1
=
and
from equation (17): f t f t
g+
:
(18)
Directly di¤erentiating equation (18) reveals an important comparative static of this economy: @ @
> 0:
f t
(19)
The faster is the steady state rate of …nancial innovation,
f t
; the more e¢ cient on average is
the economy’s …nancial system at identifying capable entrepreneurs in the steady state,
.
The steady state pro…t maximizing innovation probability of the …nancial system is determined by replacing
i;t
=
into (16), so that f t
e t
=
'(1
(
)
1
f
)
!
1 1
:
(20)
Finally combining (18) and (20), yields the implicit function F(
e
;
f
;
f)
0;
(21)
which characterizes the equilibrium innovation rate of the …nancial system. The following Lemma summarizes the properties of an economy’s …nancial innovation rate: Lemma 2 The properties of …nancial innovation in the steady state 1. Financial innovation is an increasing function of the rate at which entrepreneurs innovate: @ @
f e
> 0:
2. Financial innovation is a decreasing function of the costs of …nancial innovation, @ @
f t
f:
<0
f
3. Financial innovation is an increasing function of the rate at which the world technology frontier, g, advances: @ ft >0 @g 16
Proof. Repeated di¤erentiation of equation (20) according to the Implicit Function Theorem delivers the results. The properties of …nancial innovation in equilibrium highlight the nexus between entrepreneurial and …nancial innovation. Stagnant entrepreneurial innovation reduces the expected pro…ts from …nancial innovation, which in turn (a) reduces investment in …nancial innovation, (b) slows the rate of improvement in the screening technology, (c) lowers the probability that …nanciers identify capable entrepreneurs, and hence (d) impedes technological innovation and growth. Put di¤erently, there is a multiplier e¤ect associated with changes in entrepreneurial innovation that reverberates through the rate of …nancial innovation back to the rate of technological change. Policies, regulations, and institutions that impede …nancial innovation have large e¤ects on growth. In particular, the cost of …nancial innovation
f
a¤ects the rate of …nancial and
hence technological innovation. Thus, countries in which it is more expensive to innovate …nancially (higher
f)
will tend to grow slower than economies with less expensive barriers to
…nancial innovation. Cross economy di¤erences in the cost of …nancial innovation can arise for many reasons. For example, a large literature suggests that some legal systems (for example those that rely on case law) are more conducive to …nancial innovation than other systems (such as those that rely less heavily on case law to adapt to changing conditions), which has been documented by Beck, Demirguc-Kunt, and Levine (2003, 2005), Gennaioli and Shleifer (2007), and Levine (2005a, 2005b).
3.4
Aggregate Economic Activity
This section aggregates an economy’s economic activity and examines its components. We de…ne the economy’s average level of technological productivity, At , as: Z 1 At = At (i)di; 0
where aggregation is performed across the continuum of intermediate sectors. To derive the law of motion of the average level of technological productivity, note that in equilibrium, the expected rate of entrepreneurial and …nancial innovation is the same across sectors, i.e.
f i;t
=
f t
and
e i;t
=
e. t
Then, simply use the branches of Figure 1 and equation
(12) to derive the law of motion of average productivity:
17
At+1 = (
f e t+1 t+1 +(1
1=( f t+1 ) t+1
1) e t+1 )At+1 +(1
1=( t+1
1) e t+1
1=( f f e t+1 t+1 + t+1 t+1
1) e t+1 )At :
(22) Inspecting (22) reveals that a country’s average technological productivity in period t + 1 is a weighted average of sectors which implement the frontier technology, At+1 ; and of sectors using the average technology of period t; At . The weights are functions of (a) the rate of …nancial innovation,
f t+1 ,
(b) the quality of the …nancial screening technology,
bility of successful entrepreneurial innovation,
e . t+1
t+1 ,
and (c) the proba-
In particular, the productivity parameter
will equal At+1 both in sectors where …nanciers and entrepreneurs successfully innovated and in sectors where …nanciers did not …nancially innovate, but where …nanciers nevertheless correctly identi…ed the capable entrepreneur, who in turn successfully innovated. To derive the per capita gross domestic product within a country note that it is composed of wages in the …nal goods sector and pro…ts in the intermediate goods and …nancial sectors. In terms of wages, note that …nal good production can be summarized by Zt = At where = ( = )
=(1
),
which may be derived by substituting (4) into (1). Since by assumption
the …nal goods sector is competitive, the wage rate wt is the marginal product of labor in the production of the …nal good, so that wt = (1
) At .2 In terms of pro…ts,
)Zt = (1 1
successful entrepreneurs earn At , where
=(
1)
1
. Thus, per capita gross domestic
product is the sum of added value across sectors: Yt = wt + where
t
t t
= (1
) At +
t
At
(23)
is the fraction of goods’sectors with successful entrepreneurial innovation in period
t. The following section characterizes the growth rate of Yt as a function of the underlying entrepreneurial and …nancial structure of the economy. 2
Unlike AHM where the proportionality of the wage rate to the domestic productivity determines the level of technology investment in a credit constrained country, in our setup this ratio plays no role in determining entrepreneurial investment. As shown in equations (9) and (12), the probability of entrepreneurial innovation depends only on entrepreneurial pro…ts and the level of the standard …nancial screening technology available to those in sectors where …nanciers did not …nancially innovate. Domestic productivity just determines the amount that a …nancier and an entrepreneur can borrow from households in period t. Since we assume that neither …nanciers nor entrepreneurs can hide the proceeds, households are willing to lend any amount at the prevailing interest rates.
18
3.5
Economic Performance Across Countries
Denote a country’s distance from the world technological frontier as at = At =At . Each economy takes the evolution of the frontier as given (see below how this is derived). Thus, the technology gap evolves according to:
at+1 = (
1=( f t+1 ) t+1
f e t+1 t+1 +(1
1) e t+1 )+
1=( t+1
1
1) e t+1
f e t+1 t+1
+
1=( f t+1 t+1
1) e t+1
at
1+g
(24) This converges in the long run to the steady state value: ass = where
=
f
e
+(1
f
)1=(
)(
(1 + g) g+
1)
e
is the fraction of entrepreneurially innovating
sectors. As it is common in other Schumpeterian models, we suppose that the growth rate of the technological frontier, is determined by the equilibrium rate of entrepreneurial innovations in the leading country labeled 1. That is, g=
f 1
e 1
f 1
+ (1
)(
1=( 1)
1)
e 1
(25)
The following Proposition summarizes the properties of an economy trying to implement the world technology frontier. Proposition 1 An economy’s steady state technology gap displays the following properties: 1. An economy blocking …nancial innovation will eventually stagnate irrespective of the initial level of screening technology,
t:
ass = 0 if
f
= 0:
2. Steady state technology gap is increasing at the rate of …nancial innovation,
f
; i.e.,
@ass >0 @ f 3. Steady state technology gap is increasing at the rate of entrepreneurial innovation, i.e., @ass >0 @ e 19
e
;
H(at )
Proof. The …rst property is obtained through direct substitution of
f
= 0 in ass : The remain-
ing two properties are derived by di¤erentiating ass with respect to the relevant arguments. The next section brie‡y discusses the derived properties.
3.6
Dynamic versus Static Financial Markets
The model economy predicts that regardless of the screening capability of the …nancial system in period t,
t,
anything that prohibits …nancial innovation will eventually stop economic growth
as illustrated in Figure 2a.
at +1
at +1 45o
45o
H (at )
H (at )
0
at
at Figure 2a: Static Financial Markets
Figure 2b: Dynamic Financial Markets
Initially, the consequences of impeding innovation may have negligible e¤ects on the rate of entrepreneurial innovation if the initial e¢ ciency of the screening technology is high. Inevitably, however, as the world technology frontier advances and renders the initial screening technology increasingly obsolete, the absence of …nancial innovation produces a large and growing gap between actual and potential growth. Graphically, this scenario is equivalent to the H(at ) curve in Figure 2b shifting downwards over time in the absence of …nancial innovation. Eventually, the H(at ) curve hits the origin as in Figure 2a. This …nancially induced poverty trap is not caused by standard credit constraints. Rather, it arises because …nanciers fail to innovate and improve the screening technology in tandem with the world technology frontier. Introducing …nancial innovation in such a dormant …nancial system will boost growth, allowing for convergence to the world growth rate. It is straightforward to show this by verifying that the per capita gross domestic product in a
20
…nancially innovating economy, i.e.
f
> 0; derived in (23), grows at the rate of the world
technology frontier. Among economies that already …nancially innovate, further decreasing the barriers to …nancial innovation will shift the H(at ) curve upwards in Figure 2b, increasing a country’s steady state level of technology relative to the frontier, ass . In a similar fashion, factors a¤ecting entrepreneurial innovation also shape a country’s steady state technology gap. It is worth stressing that given the interactive feedback e¤ects between …nancial and entrepreneurial innovation, interventions in either sector will have an amplifying e¤ect on the economy’s innovation rate.
4
Evidence
In this section, we present historical observations and empirical evidence regarding the main assumptions and key predictions of the model. While these …ndings are consistent with the model, they do not represent a formal test, or validation, of the model’s predictions. In particular, we are limited by the absence of a generally accepted measure of …nancial innovation and fully valid instrumental variables for …nancial innovation. Nonetheless, these initial results advertise the potential usefulness of the model and the value of conducting more rigorous assessments of the link between …nancial innovation and technological change.
4.1
Historical Examples
We begin by describing a series of …nancial innovations that facilitated the development of the railroads in the 19th and 20th centuries. While we do not formally test hypotheses regarding the connections between …nancial and technological innovation in the railroad industry, the history of this central feature of the industrial revolution is fully consistent with this paper’s emphasis on the co-evolution of …nancial and technological innovation. Initially, the railway system was funded at the local level through private equity …nancing because of the informational problems associated with screening and monitoring railroads from afar (Baskin and Miranti, 1997, 134-146). Railroads were new, complex, and spanned a large geographic area. Consequently, prominent local investors who could observe and monitor the activities of railroads were virtually the only source of private capital during the early decades of the 19th century (Chandler, 1954, 1965, 1977). This reliance on local …nance, however, severely restricted the growth and development of railroads. Since problems with acquiring and disseminating reliable information about railroads 21
impeded pro…table investments, …nancial entrepreneurs arose to mitigate this problem and thereby spur improvements in railroad technology and expansion throughout England and the United States (Baskin and Miranti, 1997, p. 137-138). Specialized …nanciers and investment banks with reputations for integrity and competence emerged to both mobilize capital from individuals to invest in railroads and then to oversee those investments by serving on the boards of directors of railroad corporations (Carosso, 1970). In terms of specialized …nanciers, Baskin and Miranti (1997, p. 137) note that after successfully …nancing the highly pro…table line from Manchester to Liverpool, the same British investors were prominent in funding rail lines in other parts of England. In the United States, the major investment banking houses of J.P. Morgan & Company and Kuhn-Loeb & Company mobilized funds from wealthy investors in the United States and Europe to invest in the construction of railroad lines throughout the United States. This additional capital not only improved transportation through more track mileage, it also …nanced improvements in the quality of transportation in the form of faster, more comfortable, and safer trains (Chandler, 1977). Besides the emergence of specialized investment institutions, improvements in managerial accounting methods and …nancial reporting facilitated the …nancing, expansion, and improvement of railroads. As documented by Chandler (1965, 1977), the size and complexity of railroads forced them to pioneer new methods for collecting, organizing, and assessing price, usage, breakdown, and repair information. While these new forms of managerial control boosted operational e¢ ciency, they also made it easier for outside investors to assess and monitor railroads. Overtime, …nanciers were able to assemble and evaluate this information on a monthly, and then on a daily, and by the close of the 19th century on an hourly basis. These improvements in monitoring reduced the barriers to external …nance, encouraged investment and innovation, and thereby spurred growth in the railroad industry (Baskin and Miranti, 1997, p. 143-145). Financial entrepreneurs also developed new …nancial instruments and greatly expanded the use of existing securities to ease …nancial constraints on railroads, reduce the risk of bankruptcy from short-term reductions in income, and customize the risks facing potential investors in railroads. Baskin and Miranti (1997, p. 146-157) and Tufano (1997, p. 20-28) describe how these …nancial instruments were combined to facilitate the ‡ow of capital from diverse investors to railroads. For example, preferred stock holders receive income before common stock holders and are senior to common stock in bankruptcy, but preferred share holders do not have voting rights and unlike debt holders they do not have the right to push a company into bankruptcy. With income bonds, purchasers receive a promised stream of interest payments, but these
22
payments are contingent on the railroad’s pro…tability. This reduces the risk of very costly bankruptcies from short-term reductions in pro…ts. For other investors, railroads used liens, rather than debentures, to attract risk averse investors, while deferred coupon debt and super long maturity bonds allowed railroads to further custom design their securities for investors. By providing a menu of securities with di¤erent characteristics, railroads greatly expanded the range of outside investors interested in railroad securities. Financial engineering facilitated the expansion of and improvements in railroads in Britain and the United States. As a second example, consider the commercial revolution of the Middle Ages. Lopez (1976) and Braudel (1992) stress that increased trade facilitated specialization, which in turn spurred innovative improvements in productive technologies. Furthermore, Goetzmann (2005) stresses that the boom in international trade required improvements in the methodologies for valuing transactions occurring at di¤erent times, in di¤erent currencies, with di¤erent rates of payment, and with a complex variety of weights and measures. Standard …nancial practices were inadequate to address these new needs. Indeed, Goetzmann (2005) shows that Leonardo of Pisa, the mathematician best remembered for his "Fibonacci" series and for introducing Italy to the Arabic number system, wrote his magnum opus, Liber Abaci, in 1202 primarily to facilitate commerce by developing more precise, practical valuation techniques. Liber Abaci was taught throughout Europe, where it was used to train entrepreneurs to overcome common obstacles, and brought Fibonacci considerable recognition and wealth. Over time, Fibonacci’s contributions were essential ingredients in the …nancial revolution that brought liquid securities markets, life insurance, annuities, mutual funds, derivative securities, and deposit banking to Europe. These …nancial innovations in turn spurred commerce and growth. As a …nal example, the 20th century development of venture capital …rms to screen and …nance high-technology …rms and recent modi…cations to this model to support biotechnology further illustrate the vital role of …nancial innovation in encouraging technological change. During the second half of the 20th century, new, high-technology …rms found it increasingly di¢ cult to obtain …nancing. Commercial banks were reluctant to lend because there was not yet a secure cash ‡ow to repay the loan. It was di¢ cult to issue securities in public markets because the technology was complex and di¢ cult to evaluate. Furthermore, the ultimate payo¤s were highly risky, and many high-technology …rms were run by scientists with no experience in operating pro…table companies (Gompers and Lerner, 2001). Venture capital …rms arose to screen entrepreneurs and provide technical, managerial,
23
and …nancial advice to new high-technology …rms. Venture capitalists frequently became wealthy through their own successful innovations in high-technology, which provides a basis of expertise for evaluating new entrepreneurs. In terms of funding, venture capitalists hold large, private equity stakes that establish a long-term commitment to the enterprise, while o¤ering the possibility of enormous pro…ts after several years. Furthermore, venture capitalists become active investors, taking seats on the board of directors, providing regular advice, making business contacts, and solving managerial and …nancial problems. Thus, this new …nancial arrangement arose to facilitate the …nancing of frontier technological innovations, especially in information technology. As the frontiers of biotechnology opened, the venture capitalists needed to modify their model for screening, monitoring, and …nancing technological innovation. In particular, successfully developing a new biotechnology frequently required the inputs of scientists, engineers, and experts from a wide-variety of disciplines, enormous capital injections for sustained periods, and expertise with drug regulations. Overtime, venture capitalists adapted their funding structures to facilitate innovation in biotechnology. In particular, they coordinated with large pharmaceuticals to …nance and assist biotechnology …rms. Pharmaceutical companies employ, or are in regular contact with, a large assortment of scientists and engineers, have close connections with those delivering medical products to customers, and employ lawyers well versed in drug regulations. Making these resources available to biotechnology …rms increases the probability of successfully creating a valuable product. Furthermore, large pharmaceuticals help in the screening of biotechnology …rms, which makes external investors more con…dent about participating in the …nancing of these ventures. Thus, …nancial entrepreneurs facilitate technological innovators in their quests to make new and better products.
4.2
Financial and Technological Innovation
We next examine a key feature of our model and one that departs from the existing literature on …nance and growth: …nancial innovation is an increasing function of the rate at which entrepreneurs innovate and vice versa. In other words, innovation in the real sector should be positively correlated with innovation in the …nancial sector. We assess this hypothesis using data on productivity growth across U.S. industries over time from the U.S. Bureau of Labor Statistics (BLS), which has annual data on labor productivity growth by sector over the period 1967 to 2000. We use this data to contrast labor
24
productivity in the …nancial sector with that of other sectors in the U.S. economy. Speci…cally, we test if there is a positive correlation over time between labor productivity growth in the …nancial sector and that in other sectors. We compute labor productivity at the sectoral level as output per hour of all employees in the sector. We use the 1987 U.S. SIC industry classi…cation to group industries into the …nancial sector and manufacturing sectors, limiting the analysis to a comparison of the …nancial services industry to the manufacturing industry. Speci…cally, we use SIC code 602, denoting commercial banks, as proxy for the …nancial sector, and SIC code 20, denoting manufacturing, as proxy for the manufacturing sector. Using these proxies for the …nancial sector and real sector, and using annual observations on the percentage growth rate of labor productivity in either sector, we …nd that the correlation between labor productivity growth in the …nancial sector and the labor productivity growth in the real sector over the period 1967 to 2000 is high at 45 percent. The results are consistent with the view that innovation in the real sector is strongly positively correlated with innovation in the …nancial sector.
4.3
Financial Innovation and Endogenous Growth
Finally, we evaluate a second key feature of our model that di¤ers from existing models of …nancial development and growth: Economies without …nancial innovation will stagnate, irrespective of the initial level of …nancial development. This can be tested by extending the AHM regression speci…cation to include not only measures of …nancial development but also …nancial innovation. In particular, …rst consider the AHM regression framework: g where g
g1 = b0 + b1 F + b2 (y
y1 ) + b3 F (y
y1 ) + b4 X + u;
(26)
g1 is average growth rate of per capita income relative to U.S. growth over the period
1960-95, F is …nancial development in 1960, which is measured as credit to the private sector as a share of GDP, y
y1 is log of per capita income relative to U.S. per capita income, X is
set of control variables, and u is an error term. Consistent with the model developed in AHM, they …nd that b1 is not signi…cantly di¤erent from zero and that b3 is negative and signi…cant. Thus, they …nd that …nancial development accelerates the rate at which economies converge to the technological leader. In contrast to AHM, our model stresses the importance of …nancial innovation, not 25
…nancial development. Indeed, in our model the level of …nancial development in any period is an outcome of previous …nancial innovations. Building on our model above, we amend the AHM regression framework as follows:
g
g1 = b0 + b1 F + b2 (y
y1 ) + b3 F (y
y1 ) + b4 X + b5 f + b6 f (y
y1 ) + u;
(27)
where …nancial innovation, f , is measured as the average growth rate of …nancial development over the period 1960-95. Note that f is measured over the sample period, while F is measured at the beginning of the sample period. Our model predicts that b6 < 0 : the likelihood and speed of convergence depends positively on …nancial innovation. The model also predicts that b5 will be insigni…cant, indicating a vanishing steady-state growth e¤ect.3 For comparison purposes, we test these empirical predictions using the same dataset as in Aghion et al. (2005) (and con…rm the results using the more recent version, 6.2, of the Penn World Tables). We start by running a simple cross-sectional OLS regression. The results are presented in the …rst two columns of Table 1. We indeed …nd that the interaction between …nancial innovation (f ) and deviation of growth from US growth (f (y
y1 )) is negative and
signi…cant. Next, we run two sets of instrumental variables (IV) regressions to address concerns about endogeneity between growth, …nancial development and …nancial innovation. In column (3), we use both legal origin of the country and the change over the period 1973-1995 in the Abiad and Mody (2005) …nancial reform index as instruments for …nancial development and …nancial innovation. The presumption here is that countries with …nancial systems that remain …nancially depressed cannot develop and improve their …nancial practices and services (because innovation is blocked) and will thus stagnate. In column (4), we drop …nancial development and use legal origin as instrument for …nancial innovation (following Beck et al. (2003, 2005) and Gennaioli and Shleifer (2007)). The results con…rm the OLS results. In sum, the regression results con…rm the theory’s prediction: economies without …nancial innovation will stagnate, irrespective of the initial level of …nancial development. Put di¤erently, a faster rate of …nancial innovation accelerates the rate at which an economy converges to the growth rate of the technological leader. 3
This prediction derives from the assumption than the technological leader already possesses a …nancial system that innovates at the growth maximizing rate, so that faster …nancial innovation would not increase the probability of picking capable entrepreneurs.
26
5
Concluding Remarks
Historically, …nancial innovation has been a ubiquitous characteristic of expanding economies. Whether it is the development of new …nancial instruments, the creation of new corporate structures, the formation of new …nancial institutions, or the development of new accounting and …nancial reporting techniques, successful technological innovations have typically required the invention of new …nancial arrangements. In this paper, we model the joint, endogenous evolution of …nancial and technological innovation. We model technological and …nancial innovation as re‡ecting the pro…t maximizing decisions of individuals and explore the implications for economic growth. We start with a Schumpeterian endogenous growth model where entrepreneurs can earn monopoly pro…ts by inventing better goods. Financiers arise to screen potential entrepreneurs. Moreover, …nanciers engage in the costly and risky process of inventing better processes for screening entrepreneurs. Successful …nancial innovators are more e¤ective at screening entrepreneurs than other …nanciers, which generate monopoly rents and the economic motivation for …nancial innovation. Every particular screening process becomes obsolete as technology advances. Consequently, technological innovation and economic growth will eventually stop unless …nanciers innovate. The predictions emerging from our model, in which …nancial and technological entrepreneurs interact to shape economic growth, …t historical experiences and cross-country data better than existing models of …nancial development and growth. Rather than stressing the level of …nancial development, we highlight the vital role of …nancial innovation in supporting economic growth. Institutions, laws, regulations, and policies that impede …nancial innovation slow technological change and economic growth.
27
References [1] Abiad, Abdul, Mody, Ashoka. 2005. "Financial Reform: What Shakes It? What Shapes it?" American Economic Review 95, 66-88. [2] Acemoglu, Daron, Zilibotti, Fabrizio. 1997. "Was Prometheus Unbound by Chance: Risk, Diversi…cation, and Growth." Journal of Political Economy 105: 709-775. [3] Aghion, Philippe, Howitt, Peter. 1992. "A Model of Growth through Creative Destruction." Econometrica 60(2): 323-351. [4] Aghion, Philippe, Howitt, Peter. 2009. The Economics of Growth. Cambridge, MA: MIT Press. [5] Aghion, Philippe, Howitt, Peter, Mayer-Foulkes, David. 2005. "The E¤ect of Financial Development on Convergence: Theory and Evidence." Quarterly Journal of Economics 323-351. [6] Allen, Franklin, Gale, Douglas. 1994. Financial Innovation and Risk Sharing. Cambridge, MA: Cambridge University Press. [7] Baskin, Jonathan B., Miranti, Paul J. Jr. 1997. A History of Corporate Finance. New York: Cambridge University Press. [8] Beck, Thorsten, Demirguc-Kunt, Asli, Levine, Ross. 2003. “Law and Finance: Why Does Legal Origin Matter?” Journal of Comparative Economics 31 (December): 653–75. [9] Beck, Thorsten, Demirguc-Kunt, Asli, Levine, Ross. 2005. “Law and Firms’ Access to Finance.” American Law and Economic Review 7 (Spring): 211–52. [10] Beck, Thorsten, Levine, Ross, Levkov, Alexey. 2009. “Big Bad Banks? The Winners and Losers from U.S. Branch Deregulation.” NBER Working Paper 13299. [11] Bencivenga, Valerie, Smith, Bruce. 1991. "Financial Intermediation and Endogenous Growth." Review of Economics Studies 58, 195-209. [12] Black, Sandra E., Strahan, Philip E. 2002. “Entrepreneurship and Bank Credit Availability.” Journal of Finance 57, 2807-2832. [13] Bodenhorn, Howard. 2003. State Banking in Early America: A New Economic History. Cambridge University Press, New York. [14] Boyd, John H., Prescott, Edward C. 1986. "Financial Intermediary-Coalitions." Journal of Economic Theory 38, 211-232. [15] Braudel, Fernand. 1992. Civilization and Capitalism, 15th - 18th Centuries, Vol. II: The Wheels of Commerce. Berkeley, CA: University of California Press. [16] Carosso, Vincent P. 1970. Investment Banking in America: A History. Cambridge, MA.: Harvard University Press. [17] Chandler, Alfred D., Jr. 1954. “Patterns of American Railroad Finance, 1830-50”, The Business History Review 28(3), 248-263.
28
[18] Chandler, Alfred D., Jr. 1965. “The Railroads: Pioneers in Modern Corporate Management”, The Business History Review 39(1), 16-40. [19] Chandler, Alfred D., Jr. 1977. The Visible Hand: The Managerial Revolution in American Business. Cambridge, MA: Harvard University Press. [20] Dell’Ariccia, Giovanni, Igan, Deniz, Laeven, Luc. 2008. "Credit Booms and Lending Standards: Evidence from the Subprime Mortgage Market." mimeo, International Monetary Fund. [21] De la Fuente, Angel, Marin, Jose M. 1996. "Innovation, Bank Monitoring, and Endogenous Financial Development." Journal of Monetary Economics 37, 49-71. [22] Galetovic, Alexander. 1996. "Specialization, Intermediation, and Growth." Journal of Monetary Economics 38, 549-559. [23] Gennaioli, Nicola, Shleifer, Andrei. 2007. "The Evolution of the Common Law." Journal of Political Economy 115(1): 43-67. [24] Graham, B, Dodd, D. 1934. Security Analysis. New York: Whittlesey House. [25] Greenwood, Jeremy, Jovanovic, Boyan. 1990. "Financial Development, Growth, and the Distribution of Income." Journal of Political Economy. 98, 1076-1107. [26] Greenwood, Jeremy, Sanchez, Juan M., Wang, Cheng. 2009. "Financial Development: The Role of Information Costs." American Economic Review, forthcoming. [27] Goetzmann, William N. 2009. Financing Civilization. mimeo, Yale University. [28] Goetzmann, William N. 2005. "Fibonacci and the Financial Revolution." In: The Origins of Value: The Financial Innovations that Created Modern Finance, Eds: William N. Goetzmann and K. Geert Rouwenhorst. New York: Oxford University Press, p. 123-143. [29] Goetzmann, William N., Rouwenhorst, K. Geert. 2005. The Origins of Value: The Financial Innovations that Created Modern Finance. New York: Oxford University Press. [30] Gompers, Paul, Lerner, Josh. 2001. "The Venture Capital Revolution." Journal of Economic Perspectives 2(1): 145-168. [31] Jayaratne, Jith, Strahan, Phillip E. 1998. “Entry Restrictions, Industry Evolution, and Dynamic E¢ ciency: Evidence from Commercial Banking.”Journal of Law and Economics 41 (April): 239-73. [32] Harris, Ron. 1994. "The Bubble Act: Its Passage and Its E¤ects on Business Organization." The Journal of Economic History 54 (3): 610-627. [33] Harris, Ron. 1997. "Political Economy, Interest Groups, Legal Institutions and the Repeal of the Bubble Act in 1825." Economic History Review 50(4): 675-696. [34] Harris, Ron, 2000. Industrializing English Law: Entrepreneurship and Business Organization, 1720-1844. Cambridge, MA: Cambridge University Press. [35] Hubbard, Glenn R., Palia, Darius. 1995. “Executive Pay and Performance: Evidence from the U.S. Banking Industry.” Journal of Financial Economics 39 (September): 105-30. 29
[36] Kerr, William, Nanda, Ramana. 2009. "Democratizing Entry: Banking Deregulations, Financing Constraints, and Entrepreneurship." Journal of Financial Economics, forthcoming. [37] Keys, Benjamin, Mukherjee, Tanmoy, Seru, Amit, Vig, Vikrant. 2010. "Did Securitization Lead to Lax Screening? Evidence from Subprime Loans." Quarterly Journal of Economics 125(1). [38] King, Robert, Levine, Ross. 1993. "Finance, Entrepreneurship, and Growth: Theory and Evidence." Journal of Monetary Economics 32, 513-542. [39] Kuran, Timur. 2009. “The Scale of Entrepreneurship in Middle Eastern History: Inhibitive Roles of Islamic Institutions,” in Entrepreneurs and Entrepreneurship in Economic History, Eds: William J. Baumol, David S. Landes, and Joel Mokyr, (Princeton, NJ: Princeton University Press). [40] Levine, Ross. 1991. "Stock Markets, Growth, and Tax Policy." Journal of Finance 46, 1445-1465. [41] Levine, Ross. 2005a. "Finance and Growth: Theory and Evidence." In: Handbook of Economic Growth, Eds: Philippe Aghion and Steven N. Durlauf. Elsevier North-Holland. Publishers. 866-934. [42] Levine, Ross. 2005b. “Law, Endowments, and Property Rights.” Journal of Economic Perspectives 19(3), 61-88. [43] Lopez, Robert S. 1976. The Commercial Revolution of the Middle Ages, 950-1350. New York: Cambridge University Press. [44] Loutskina, Elena, Strahan, Philip E. 2009. "Securitization and the Decline of Bank Finance on Loan Supply: Evidence from Mortgage Originations." Journal of Finance 64(2): 861889 [45] Malmendier, Ulrike. 2009. "Law and Finance at the Origin." Journal of Economic Literature, forthcoming. [46] Merton, Robert C. 1995. "Financial Innovation and the Management and Regulation of Financial Institutions." Journal of Banking and Finance 19: 461-481. [47] Mian, Atif, Su…, Amir. 2009. "The Consequences of Mortgage Credit Expansion: Evidence from the 2007 Mortgage Default Crisis." Quarterly Journal of Economics 124(4). [48] Neal, Larry.1990. The Rise of Financial Capitalism: International Capital Markets in the Age of Reason. New York: Cambridge University Press. [49] Obstfeld, Maurice. 1994. "Risk-Taking, Diversi…cation, and Growth." American Economic Review 84(5): 1310-1329. [50] Romer, Paul M. 1986. "Increasing Returns and Long-Run Growth." Journal of Political Economy 94(5): 1002-1037. [51] Romer, Paul M. 1990. "Endogenous Technological Change." Journal of Political Economy 98(5): S71-102.
30
[52] Schweitzer, Stuart. 2006. Pharmaceutical Economics and Policy. New York: Oxford University Press. [53] Tufano, Peter. 1997. “Business Failure, Judicial Intervention, and Financial Intervention: Restructuring U.S. Railroads in the Nineteenth Century.” The Business History Review 71(1), pp. 1-40. [54] Tufano, Peter. 2003. "Financial Innovation." In: Handbook of the Economics of Finance (Volume 1a: Corporate Finance). Eds: George Constantinidis, Milton Harris, and Rene Stulz. Elsevier North-Holland. 307-336.
31
Table 1. Financial Development, Financial Innovation, and Growth This table presents ordinary least squares (OLS) and instrumental variable (IV) estimates of a regression model that extends the AHM model of financial development and growth to include financial innovation. The dependent variable is the growth rate of real per capita GDP of the country minus the US growth rate in real per capita GDP, g - g1. Both are computed over the period 1960-95. F is financial development, measured as private credit to GDP in 1960, and f is financial innovation, measured as the growth rate of private credit to GDP over the period 1960-95. We include the same control variables as AHM. The regression in Column (1) is estimated using OLS and replicates the AHM results, limiting the sample to those countries with data on private credit to GDP in 1960. The regression in Column (2) is estimated using OLS and adds financial innovation, f. The instrumental variables in regression (3) are legal origin and the change in the Abiad and Mody (2005) financial reform index over the period 1973-1995. We are missing data on financial reform index for 9 countries. The instrumental variable in regression (4) is the legal origin of the country. ***, **, and * denote significance at the 1 percent, 5 percent, and 10 percent level, respectively.
VARIABLES y - y1 F F (y - y1)
(1) g - g1
(2) g - g1
(3) g - g1
(4) g - g1
-0.472 (0.529) -0.005 (0.007) -0.030** (0.013)
0.233 (0.598) 0.003 (0.008) -0.017 (0.020) 0.037 (0.167) -0.310*** (0.105) -0.007 (0.114) 0.010 (0.031) -0.000 (0.009) 0.004 (0.004) -0.006 (0.007) -3.487** (1.570) 0.287 (0.521) -2.378** (0.951) 0.291 (1.650)
-0.261 (0.517)
0.200* (0.112) 0.013 (0.041) -0.001 (0.014) -0.017*** (0.005) 0.015** (0.006) -1.435 (0.959) -0.007 (0.285) -0.064 (0.986) -2.172* (1.183)
-0.305 (0.404) 0.000 (0.006) -0.032** (0.014) 0.047 (0.083) -0.091** (0.041) 0.178* (0.097) 0.004 (0.038) 0.011 (0.010) -0.012** (0.005) 0.009 (0.006) -2.553** (0.992) 0.036 (0.325) 0.197 (0.936) -2.195** (0.953)
0.001 (0.168) -0.240* (0.137) 0.125 (0.116) -0.020 (0.031) 0.014 (0.011) -0.008 (0.006) 0.002 (0.006) -4.104** (1.706) 0.343 (0.467) -0.556 (0.933) -0.610 (1.127)
-56 0.558
-56 0.682
0.26 47 0.371
0.19 56 0.398
f f (y - y1) Average years of schooling in 1960 Government size Inflation Black market premium Openness to trade Revolutions and coups Political assassinations Ethnic diversity Constant
Hansen J-test (p-value) Observations R-squared
32