Field-Experimental Evidence on Unethical Behavior Under Commitment Tobias Cagala, Ulrich Glogowsky, Johannes Rincke∗ May 18, 2016
Abstract To prevent fraud and unethical behavior, many firms request that managers and employees commit to a code of conduct. Studying the cheating behavior of future managers and firm employees on exams, this paper provides fieldexperimental evidence regarding the effectiveness of such commitment requests. Our main results are as follows. First, commitment to a no-cheating rule shifts subjects’ attitudes toward unethical behavior and strengthens their aversion to cheating. Second, whereas close monitoring eliminates cheating, requesting commitment to a no-cheating rule has strongly heterogeneous effects. Commitment reduces cheating if monitoring is sufficiently strong, but it is ineffective or may even backfire if monitoring is weak. This indicates that requesting commitment to a no-cheating rule is effective only if enforcement-related policies like monitoring lend credibility to the underlying rule.
Keywords: code of conduct; code of ethics; rules; commitment; compliance; cheating; enforcement; monitoring; auditing; field experiment
∗
Cagala: University of Erlangen-Nuremberg (
[email protected]); Glogowsky: University of Munich (
[email protected]); Rincke: University of Erlangen-Nuremberg (
[email protected]). We thank Imran Rasul, Joel Slemrod, and numerous seminar participants for helpful comments. We are grateful for financial support from the Emerging Field Initiative of the University of Erlangen-Nuremberg. All errors are our own.
1
Introduction
In 2010, Volkswagen enacted a code of conduct to support “employees in mastering the legal and ethical challenges in their daily work.” The document stated that “we consider compliance with international conventions, laws, and internal rules to be the basis for sustainable and successful economic activities. We act in accordance with our declarations.” In September 2015, U.S. authorities revealed that despite this commitment, Volkswagen had equipped vehicles with software that was used to cheat on emissions tests. Volkswagen had to admit to the scheme, which involved over 11 million cars. Although the specifics of the Volkswagen case are unique, the general theme is not: from the failure of Enron to the business practices in the financial industry that, among other factors, triggered the recent economic crisis, history provides an abundance of examples of firms that operate under a strict code of conduct but become involved in massive fraud nonetheless.1 What makes the recent string of high-powered fraud schemes even more striking is the fact that the managers and employees involved could operate the schemes for years unobstructed by internal or external audits.2 In short, the recent anecdotal evidence calls into question the effectiveness of a commitment to a code of conduct, at least in the absence of policies directed toward enforcing the rules set out in firms’ business principles. In this paper, we present a field experiment that tests the effectiveness of requesting that subjects commit to a code of conduct. The experiment allows us to assess whether individuals who receive a request to sign a declaration of compliance with a simple no-cheating rule behave differently from individuals from whom a commitment is not requested. We complement this analysis with an investigation of how monitoring, a contextual factor in our experimental design, interacts with the effectiveness of commitment. We implemented our experiment with business 1
The incongruity between what firms state to be their highest business principles and reality is often striking. Enron’s Code of Ethics as of 2000 promised that employees “are charged with conducting their business affairs in accordance with the highest ethical standards” and that they “work with customers and prospects openly, honestly and sincerely.” In 2001, Enron went bankrupt over a massive accounting-fraud scheme. Goldman’s “Business Principles” begin with the statement that “our clients’ interests always come first.” The Code of Business Conduct and Ethics of Deutsche Bank claims that “we live by the highest standards of integrity in everything we say and do. We will do what is right – not just what is allowed.” Like many other major banks, Goldman and Deutsche Bank had to pay billions of U.S. dollars to settle claims of faulty mortgages issued before the financial crisis. 2 In the Enron case, the risk of detection for managers and employees was minimized by collusion with external accountants. Transcripts of test messages among traders involved in the LIBOR scandal (where several banks, including Deutsche Bank, were found to having manipulated the LIBOR interest rate) provide dramatic evidence of fraudulent behavior under the (false) perception of a zero detection risk.
1
students at a German university and investigated the students’ cheating behavior on exams. Two features render the business school setting useful for our study. First, by considering business students, we were able to study the behavior of future managers and firm employees shortly before they join the workforce. This links our study directly to the firm context. Second, the business school setting allowed us to randomly induce variation in commitment to a no-cheating-rule at the individual level. Because companies are reluctant to treat employees differently with respect to commitment to no-cheating rules, and because data access is frequently restricted, a similar experiment would be difficult to implement within firms. Our field-experimental design exposed a large population of business students to variation in commitment and monitoring in multiple-choice exams. We randomly assigned students to three treatment groups: control, commitment, and monitoring. In the control group, we implemented a baseline level of monitoring, that is, we established a low supervisor-to-student ratio that exposed students to a weak average monitoring intensity. In the commitment treatment, students also experienced baseline monitoring. The only difference to the control group was that students were asked to actively commit to a no-cheating-rule by signing a declaration of compliance. Another key feature of our treatments with baseline monitoring was that we implemented within-treatment variation in the supervisor-to-student ratio. This allows us to study not only the average effect of commitment, but also the interaction between commitment and monitoring. The monitoring treatment completes the experimental design. Relative to baseline monitoring, this treatment implemented close monitoring by increasing the average supervisor-to-student ratio by a factor larger than five relative to baseline monitoring. Close monitoring made cheating prohibitively risky and thus provided us with a situation in which outcomes reflect full compliance. Our design aims at identifying the effect of subjects’ active commitment to the no-cheating rule rather than the effect of the rule as such. We therefore communicated the no-cheating rule and the sanctions on detected cheaters through identical announcements in all treatments. The focus on commitment reflects the fact that in the firm context, codes of conduct are ubiquitous, but firm policies vary widely in terms of whether employees are required to actively commit to the underlying rules.3 Much of the related literature on compliance behavior has used self-reported 3
In many firms, explicit commitment to a code of conduct is included in contracts of employment. The UK-based Institute of Business Ethics (IBE) estimates that at least 85 of the FTSE 100 companies have an explicit code of conduct. In a survey from 2007, seven out of ten companies stated that conformity to the code was included in contracts of employment.
2
compliance and indirect measures of cheating (e.g. Case et al., 2004; Mazar et al., 2008). We propose an innovative statistical test that identifies cheating more directly. In our context, the test identifies informational spillovers between students due to copying answers from neighbors, but the procedure can be used to test for spatial patterns of similarity in many other settings.4 In addition to examining our data with this novel method, we show how cheating translates into exam performance and investigate the impact of commitment on cheating by means of simple treatment comparisons with regressions. Our main findings are as follows. First, exploiting data from an additional survey experiment, we provide evidence that commitment to a no-cheating rule shifts subjects’ attitudes: signing a no-cheating declaration makes individuals more averse to cheating. This establishes that individuals are mentally affected by the commitment. Second, whereas close monitoring eliminates cheating, requesting commitment to a no-cheating rule has heterogeneous effects: Commitment reduces cheating if monitoring is sufficiently strong, but it is ineffective or may even backfire if monitoring is weak. Hence, the power of commitment emerges from a positive interaction with standard tools of rule enforcement, like monitoring subjects’ behavior. Put differently, when used as tools to induce rule-compliant behavior, requesting commitment and standard enforcement policies function in a complementary fashion. As a consequence, requesting that subjects commit to a no-cheating rule is likely to be ineffective in settings with weak enforcement. This may be the case because subjects abide by the rules set out in a code of conduct only if monitoring and auditing policies lend sufficient credibility to the underlying rules and the sanctions associated with violating them. This would suggest that in the examples mentioned before, it was the insufficient enforcement of internal rules that rendered the high ethical standards set out in the firms’ business principles ineffective. The paper contributes to two strands of literature. First, it adds to the organizational compliance literature that studies influences beyond enforcement. This literature has found that rewards (Gneezy, 2005) and agreement on norms between leaders and subordinates (Burks and Krupka, 2012) promote compliance. We add to this literature by evaluating the effect of commitment requests on compliance. Second, our study contributes to the literature that studies whether signing forms make individuals more compliant (Mazar et al., 2008; Shu et al., 2011, 2012; Behavioural Insights Team, 2012). Importantly, this literature has produced mixed 4
The testing procedure can be used to identify spatial patterns of similarity under the condition that the units of observation are located within a well-defined spatial structure. The test could be used, for instance, to identify spillovers among employees working in an open-office environment, or spillovers between a firm’s branches or subsidiaries.
3
findings for different settings. We contribute to explaining this heterogeneity by highlighting the relevance of context. Specifically, we show that enforcement is an important contextual factor. The remainder of the paper is organized as follows. In Section 2, we briefly present our conceptual considerations regarding the way in which commitment affects compliance. Section 3 describes the field experiment, and Section 4 reports the results. Section 5 provides concluding remarks.
2
Conceptual Considerations
In this section, we outline our conceptual considerations regarding the way in which commitment to a rule affects compliance. The literature in economics and psychology has provided several explanations: individuals feel guilty and socially uncomfortable when breaking a promise (Charness and Dufwenberg, 2006), have a preference for keeping their word (Ellingsen and Johannesson, 2004), are averse to lying (Gneezy, 2005; Erat and Gneezy, 2012), and feel a duty to comply with rules (Dwenger et al., 2016). Furthermore, Mazar et al. (2008) and Shu et al. (2012) conjectured that explicit commitment to a rule makes it more difficult for subjects to ignore their own moral standards and to maintain a positive self-image when breaking the rule. These ideas can be summarized by the simple notion that noncompliance entails a trade-off between an increase in utility (e.g., by increasing monetary payoffs) and a psychic disutility (e.g., by imposing a psychic cost of noncompliance). Accordingly, commitment should induce more norm-compliant behavior as long as the act of commitment increases the marginal disutility of noncompliance. Building on these and similar conceptual considerations, researchers have studied the effectiveness of commitment requests. However, as discussed in the introduction, results have been mixed. Inspired by an emerging literature on the value of randomized controlled trials (Deaton, 2010; Ludwig et al., 2011), we conjecture that interactions of treatment effects with contextual factors explain the observed heterogeneity in treatment effects. Enforcement in the form of monitoring and/or auditing may be a key contextual factor of the effectiveness of commitment requests.5 More precisely, commitment to a rule could interact with enforcement in various ways, of which we emphasize two. First, enforcement in the form of monitoring or 5 For instance, as a large body of research has shown, being observed by another individual reduces unethical behavior (Jones and Kavanagh, 1996; Goldstein et al., 2008; Gino et al., 2009a,b; Ariely et al., 2009; Gino et al., 2013).
4
auditing increases the probability that norm violations will be detected. If commitment to a rule makes being identified as a cheater socially more uncomfortable, the effect of requesting commitment should be larger in regimes with stronger enforcement. Second, requesting that subjects commit to a norm may direct their attention to how strictly the norm is enforced. If enforcement is strong, directing a subject’s attention to enforcement via commitment could increase compliance. In contrast, if enforcement is weak, a commitment request may make subjects aware of the lack of enforcement and thereby prompt them to cheat more. In sum, we conjecture that commitment requests can have positive or negative effects on compliance. The field experiment discussed in the following section reflects our conceptual considerations by combining two design elements. The first element is a standard policy evaluation. It exploits between-treatment variation and aims at testing whether commitment requests affect behavior on average. The second element exploits within-treatment variation and explores the interaction between commitment and monitoring as a contextual factor.
3
The Natural Field Experiment
3.1
Background
We implemented the natural field experiment in two written undergraduate exams at the business school of a German university. The exams were compulsory for students in their first semester and were part of the curriculum for a bachelor’s degree. Each exam lasted 60 minutes. Exam 1 was on principles of economics, whereas Exam 2 covered principles of business administration. Both exams included 30 multiple choice questions, each consisting of four statements, only one of which was correct. The students’ task was to mark the correct statement on an answer sheet. All multiple choice questions had the same weight. In the years before the experiment, standard exam procedures did not include any form of commitment to the existing no-cheating rules.6 Moreover, monitoring of students during the exams was far from perfect: commonly, up to 200 students took exams in lecture halls with up to 800 seats and were supervised by only two to four members of the university staff who had little incentive to monitor students. Before the experiment, students were rarely reported to the examination board for attempted cheating.7 6
The university does not have an honor code. In fact, the records for the two years before the experiment show that no student failed either of the two exams because of (attempted) cheating. 7
5
3.2
Design
In this section, we provide an overview of the field-experimental design.8 The exams took place in several lecture halls. We restricted the sample to students who registered for both exams and stratified this sample by gender and grade of university admission as a proxy for ability.9 In Exam 1, we randomly allocated students from strata to one of three treatments: control, commitment, and monitoring. Importantly, we assigned all students in a given hall to the same treatment. To avoid spillovers between exams, we used only students who were assigned to the control group of Exam 1 when allocating students to a control and a commitment treatment in Exam 2. In both exams, we also randomly allocated supervisors to lecture halls and students to seats within halls.10 In accordance with local exam regulations, we implemented a second-row-second-seat seating arrangement in all treatments. Our treatments exposed students to experimental variation in two dimensions. First, treatments implemented between-treatment variation in terms of commitment to a no-cheating rule and in terms of monitoring. Second, in the control and commitment treatments, we exposed students to within-treatment variation in terms of the level of monitoring. The within-treatment variation allowed us to identify interaction effects between commitment and monitoring. Between-Treatment Variation In the control group, we implemented baseline monitoring (on average, 44.2 students per supervisor) and did not request commitment to the no-cheating rule. The monitoring treatment deviated from the control treatment by imposing close monitoring (on average, 8.4 students per supervisor) that made cheating during the exam virtually impossible. In the commitment treatment, students were subject to baseline monitoring. The only difference between the commitment and control treatments was that in the former, students had to commit to the no-cheating rule by signing a declaration of compliance printed on the first page of the exam materials. The declaration of compliance was positioned prominently below a form in which students in all treatments had to fill in their name and university ID (see Appendix). The no-cheating rule read as follows: I hereby declare that I will not use unauthorized materials during the exam. Further8
The department’s examination board and the lecturers who were responsible for the exams agreed upon all interventions. 9 By focusing on freshmen, we ensured that individuals were unaware of the changes in examination conditions that we introduced with our treatments. Because both exams were part of the first year’s bachelor curriculum, our sample naturally consists of freshmen who signed up for both exams. 10 Students looked up their preassigned seat number in a list upon entering the examination hall. Supervisors checked students’ IDs and ensured that students took their predefined seats.
6
more, I declare neither to use unauthorized aid from other participants nor to give unauthorized aid to other participants. Before the exam began, students were given extra time to complete the form and sign the declaration. The placement of the declaration on the first page of the exam materials ensured that students’ attention was directed to the declaration immediately before the start of the examination.11 Although signing the declaration changed the degree of commitment to the no-cheating rule, the rule itself and the consequences of cheating did not vary across treatments. Immediately before the exam started, supervisors announced in all treatments that cheating was forbidden and that detected cheaters would fail the exam. This was done to ensure that any potential heterogeneity in the perception of the rule was unrelated to the treatments. Within-Treatment Variation We designed our experiment in a way that enables us to investigate how the strength of monitoring influences the effectiveness of the commitment treatment. For this purpose, we implemented both interhall and intrahall variation in the level of monitoring within the control and commitment treatments. To implement interhall variation, we varied the number of students per supervisor across lecture halls. Specifically, the student-to-supervisor ratio varied between 29.0 and 56.5 (mean: 44.2, sd: 10.8). To introduce a salient form of intrahall variation in monitoring, we instructed supervisors in the commitment and control treatments to stay in front of the middle seats in the first row. This design element builds on the idea that the monitoring intensity decreases with increasing physical distance to the nearest supervisor. Hence, students sitting in the center of the first row were subject to the strongest monitoring, whereas students in an aisle seat in the back row experienced the weakest monitoring. In the experiment, the physical distance between students and supervisors was between 3.2 and 25.8 meters (mean: 11.5, sd: 4.7). Importantly, the randomization of students to seats ensured that the distance was a proper measure of monitoring and did not pick up confounding variables such as students’ characteristics. Whereas there was within-treatment variation in terms of monitoring in the control and commitment treatments, monitoring was similar for all students in the monitoring treatment. We achieved this by assigning supervisors to hall-specific locations that we distributed uniformly across the hall. Figure 1 provides a stylized illustration of monitoring conditions under baseline and close monitoring. 11
We checked the forms after the exams and found that all students in the commitment treatment had signed the declaration of compliance.
7
Further Details
Identification of the causal effects of interest requires that all con-
ditions other than the treatment variations were the same across all lecture halls. We therefore instructed the supervising staff to conform to a scripted exam schedule and to behave in a specific manner. The schedule included the exact wording of all announcements to be made before and after the exam. We also instructed supervisors to start and end the exam at the same time in all halls. Another matter of concern is no-shows among students who were registered for an exam. In our university setting, students had the option of postponing exams to later semesters without de-registering from the exams. These no-shows raise two issues. First, empty seats could alter opportunities for cheating in an unknown way. To prevent this loss of control, we overbooked lecture halls when randomly allocating students to treatments. This enabled us to draw from a hall-specific pool of students to fill seats that otherwise would have remained empty. We therefore kept actual monitoring levels identical to planned levels.12 Second, students’ on-thespot decisions whether to take part in the exam could correlate with the treatments. To avoid this type of self-selection into treatment conditions, we made sure that all conditions related to the treatment interventions were unobservable to students before the beginning of the exam.13 Figure 2 presents an overview of treatments and sample sizes. Of the 1007 students in the overall sample, 766 students took Exam 1 (333 in control, 208 in commitment, and 225 in monitoring). Of the 432 students who were allocated into the control group of Exam 1, 353 students took Exam 2 (204 in control and 149 in commitment).
3.3
Data
The empirical analysis uses individual data on student characteristics and exam performance. We collected the exam data by scanning and electronically evaluating the multiple choice answer sheets. This automated procedure ensures that the data are free from corrector bias and measurement error. We linked the exam data to data on student characteristics, which we obtained from the university administration. Table A1 in the Appendix reports mean student characteristics by treatment for the sample of students who took part in the exams; it demonstrates that treatments are 12
Excess students who could not be seated in the initially assigned hall were relegated to additional halls that were excluded from the experiment. 13 Supervisors entered the room and took their preassigned positions only after all students took their preassigned seats. Therefore, students could not observe the monitoring intensity before the exam started. In contrast, we ensured that during the exam, students in all treatments could easily observe how many supervisors were in the hall and where they were located.
8
balanced across all characteristics.
4
Effects of Commitment and Monitoring on Cheating
Our analysis proceeds in three steps. First, we demonstrate that requesting commitment to a no-cheating rule affects attitudes toward cheating. Second, we discuss a new statistical test, which shows that students cheat under baseline monitoring but stop doing so under close monitoring. Third, we show how cheating translates into exam performance and investigate the impact of commitment on cheating. In this step, we also explore interactions between compliance and monitoring.
4.1
Commitment Requests and Attitudes Toward Cheating
Before addressing the behavioral responses in our field experiment, we investigate whether commitment to a no-cheating rule changes the way individuals think about cheating. The goal of our analysis of attitudes toward cheating is to determine whether signing a declaration of compliance has the potential to affect compliance behavior. The main difficulty of performing such an analysis is that attitudes are not directly observable. We responded to this challenge by conducting a survey experiment in the laboratory, comprising 62 undergraduate students drawn from the same population as the sample for the field experiment.14 The survey experiment consisted of a commitment and a control treatment. Subjects assigned to the commitment treatment signed a declaration of compliance immediately after the start of the experiment. Importantly, we implemented a declaration of compliance in the treatment group that was very similar to the declaration used in the field experiment. It read as follows: I hereby declare that I will not use unauthorized materials during the experiment. Furthermore, I declare neither to use unauthorized aid from other participants nor to give unauthorized aid to other participants. Subjects in both treatments then answered a questionnaire on attitudes toward cheating. After the survey, subjects in both treatments answered multiple choice questions similar to those used in the field experiment, earning €0.50 for each correctly solved question.15 14
The experiment took place in the Laboratory for Experimental Research, Nuremberg. See Appendix, Part A, for details on the experimental design and the questionnaire. The average payoff for participating in the 60-minute experiment was €9.2, including the show-up fee of €5. 15 We are mainly interested in the effects on attitudes. However, we do not find any effect of the commitment on performance.
9
Table 1 summarizes our main findings on attitudes toward cheating. Column (1) shows the effect of the commitment request on the acceptance of cheating. To elicit acceptance, the questionnaire asked subjects to indicate the degree to which they believe it is justifiable to cheat on exams, using a scale from 1 (never) to 10 (always).16 Responses show that subjects in the commitment treatment consider cheating significantly less acceptable than do those in the control treatment. The effect is large, indicating a 26.5% decrease in acceptance relative to the control group (p-value 0.025, Mann-Whitney U). Column (2) reports the effect of commitment on the reported psychic cost of cheating. To measure psychic cost, we described a scenario in which compliant behavior in a laboratory experiment yields a payoff of €5. We then asked subjects about the minimal monetary payoff that would make them engage in cheating. We interpret the difference between the answer and the €5 payoff under compliance as the monetary payoff that is necessary to compensate individuals for the psychic cost of cheating. In the commitment treatment, the average psychic cost is €20.8, compared to €14.7 in the control group. This indicates a 41.4% increase in the reported psychic cost of cheating (p-value 0.086, MannWhitney U). We conclude that requesting commitment to a no-cheating rule affects subjects mentally: signing a no-cheating rule triggers a shift in subjects’ attitudes toward cheating and increases the psychic cost of rule violations. Column (3) complements the evidence on shifts in attitudes by showing the effect of the commitment request when subjects predict their own cheating behavior in a hypothetical exam situation. Interestingly, we do not find any difference between the treatment and control group. Hence, although requesting commitment affects subjects’ stated attitudes toward cheating, the subjects themselves do not predict that this would affect their own behavior in an exam situation. We return to this seemingly contradictory finding when we discuss the results of the field-experiment. However, we note at this stage that the insignificance of the estimate in column (3) weakens the possibility that the significant effects on attitudes toward cheating in columns (1) and (2) are driven by homogeneous experimenter demand effects.
4.2
Cheating Behavior by Treatment Group
Like many other forms of norm-violating behavior, cheating on exams is a concealed activity that is difficult to measure. Before discussing the effects of cheating on students’ exam performance, we provide more direct evidence of plagiarism on exams. For this purpose, we develop a simple test that identifies the copying of answers 16
The wording of the questions on the acceptance of cheating is similar to that of the World Values Survey questions on the acceptance of tax evasion and free-riding.
10
from neighbors using only the within-treatment variation. The test is based on a spatial permutation procedure and does not impose assumptions about how cheating translates into exam performance. The underlying idea is straightforward: the test uses spatial permutations of the seating arrangement to derive the unobserved counterfactual distribution of similarities in the absence of cheating. The testing procedure then compares the counterfactual distribution of similarities to similarities in multiple choice answers between subjects who were actually seated next to each other. This enables us to test for the existence of cheating-driven similarities in students’ answers and hence to identify the presence of cheating.17 The details of the testing procedure are as follows. In a first step, we construct a treatment-specific index that captures the average share of identical incorrect answers given by students seated next to each other in the same row.18 Of course, identical incorrect answers can result from copying neighbors’ answers or from factors unrelated to cheating. We therefore need to separate cheating-caused similarities in answers from non-cheating-caused similarities. To do so, the second step of the testing procedure uses permutations. In each permutation, we derive a counterfactual seating plan by randomly reassigning students within lecture halls, without replacement to seats. The random assignment removes any cheating-caused similarities in answers of neighbors, because we compare answers of students who were not sitting next to each other in the exam. We then calculate the treatment-specific counterfactual index for each counterfactual seating plan. Running a large number of permutations, we obtain a counterfactual distribution of the index for a situation characterized by the absence of cheating.19 The final step of the testing procedure is to compare this counterfactual distribution to the actual value of the similarity index to derive p-values for inference.20 This comparison allows us to test the null 17
A few studies have used similar methods to identify causal effects: Fischbacher and FöllmiHeusi (2013) designed a laboratory experiment in which the true distribution of the outcome if people behave honestly is known. They used this counterfactual to test for the existence of cheating. Levitt and Lin (2015) developed an alternative algorithm that exploits the seating arrangement in a university exam to derive counterfactual answers to multiple choice questions. Using this algorithm, they showed that random assignment of seats heavily reduces cheating. Falk and Ichino (2006) used a related approach to identify peer effects. By comparing the standard deviation of output between true and simulated pairs, they found large and significant peer effects. 18 See Appendix, Part B, for a detailed discussion and formal representation of the index. Relying on identical incorrect answers alone makes the test robust to spatial heterogeneity that could affect the share of correctly solved questions. Furthermore, identical incorrect answers are a stronger indicator of cheating than identical correct answers (Levitt and Lin, 2015). 19 All our results are based on 10,000 permutations. 20 To derive the p-value, we calculate the share of permutations that result in a counterfactual index value that is greater than the actual value of the index. Dividing this share by two gives us the p-value of a two-sided test. Intuitively, this p-value is equivalent to the probability that we reject the null of no cheating, although similarities occur randomly. Note that for negative index values, we calculate the share of permutations that result in a counterfactual index value that is smaller than
11
hypothesis that spatial similarities in answers are unrelated to cheating. The permutation test rests on the assumption of exchangeability; that is, the test assumes that the counterfactual reassignment of seats removes only cheatingcaused similarities in answers of neighbors. Because of the random assignment of students to seats in our experiment, similarities in answers between neighbors can occur only randomly or because of cheating. Consequently, reshuffling seats removes only cheating-caused similarities and does not violate the exchangeability assumption.21 Figure 3 reports the treatment-specific permutation tests for cheating in Exam 1. For each treatment, the vertical line shows the index value for the actual seating plan. The solid line represents the counterfactual distribution, and the dashed line represents the cumulative counterfactual distribution function. Three findings emerge from Figure 3. First, Panel A illustrates that for the control group, the actual index value is located in the tail of the counterfactual distribution. As a consequence, we can clearly reject the null hypothesis of no cheating (p-value 0.004). This is evidence that students cheat by copying answers from neighbors under weak monitoring. Second, we can also reject the null of no cheating for the commitment treatment (Panel B, p-value < 0.001). The actual index value turns out to be even larger than in the control group if evaluated against the counterfactual distribution. We conclude that the commitment request in our field experiment does not eliminate cheating.22 Third, and in stark contrast to the results for the control group and the commitment treatment, we cannot reject the null hypothesis of no cheating for the monitoring treatment (Panel C, p-value 0.802). The actual index value is very close to the mode of the counterfactual distribution. Taken together, our results provide clear-cut evidence regarding cheating behavior on exams. Under baseline monitoring, students copy answers from neighbors in the same row. This finding holds irrespective of whether subjects commit to the no-cheating rule. In contrast, close monitoring effectively prevents cheating on exams.23 the actual value of the index. 21 In contrast, if students could self-select to sit next to students with similar ability and answering behavior, reshuffling the seats would remove more than cheating-caused similarities in answers and therefore violate the exchangeability assumption. 22 Figure A1 in the Appendix confirms the presence of cheating for the control group and the commitment treatment in Exam 2. 23 We report additional results and a number of robustness checks for the permutation tests in the Appendix. First, we perform permutation tests while treating only students sitting next to each other in the same column as neighbors. Figures A2 and A3 show that we cannot reject the null of no column-wise cheating in any of the treatments. We conclude that under weak monitoring, students cheat by interacting exclusively with their row-wise neighbors. Second, we also extend the testing procedure to capture between-treatment differences in cheating. This allows us to determine
12
4.3
Effects on Exam Performance
Next, we investigate how the treatments affect exam performance. We proceed in two steps. The first step is to consider average treatment effects on performance. Specifically, we compare students’ performance between the monitoring and the control treatment. Given the evidence from Figure 3 that monitoring prevents cheating, this treatment comparison identifies the total impact of cheating on performance. We then compare students’ performance between the commitment and the control treatment to identify the average treatment effect of commitment. In the second step, we consider how commitment and monitoring interact to influence cheating behavior. Table 2 presents treatment effects, which we obtain from simple ordinary least squares (OLS) regressions. The dependent variable is the share of correctly solved multiple choice questions. Column (1) displays unconditional estimates, and column (2) reports estimates of regressions controlling for strata variables (gender and university admission grade). We cluster standard errors by rows to account for any form of spatial correlation in residuals that might result from row-wise cheating. Panel A of Table 2 reports the effect of the monitoring treatment. The sample consists of 558 students assigned to either the monitoring treatment or the control group in Exam 1.24 The table shows that close monitoring significantly reduces students’ average exam performance. The unconditional estimate shows that under close monitoring, students’ performance is on average 2.7 percentage points worse than under baseline monitoring. Given that the average student in the control group answers 72.4% of multiple choice questions correctly, the estimate implies that cheating increases students’ exam performance on average by 3.7%. Controlling for strata variables does not change the effect size. Combining this evidence with the evidence from the permutation tests in Figure 3, we conclude that (a) students cheat when they have an opportunity, (b) monitoring prevents cheating, and (c) cheating translates into significantly better exam performance. Panel B of Table 2 shows the average treatment effect of requesting commitment to a no-cheating rule. Here, we use the sample of 894 students assigned to the commitment treatment or the control group in either of the two exams. Despite the increased sample size, the effect of commitment is insignificant.25 Taken together, whether similarities in answers of neighbors differ between the commitment and the control treatment groups. Figure A4 in the Appendix shows that the null of no difference in cheating cannot be rejected in either of the exams. We conclude that the commitment request did not reduce cheating relative to the control group. 24 Because we implemented the monitoring treatment only in Exam 1, we could not use students from Exam 2 in these regressions. 25 We obtain the same results whether we use two-way cluster-robust standard errors (row and
13
the evidence from the permutation tests and the average treatment effects suggests that under weak enforcement of rules, requesting commitment to a no-cheating rule is ineffective. Interestingly, this finding mirrors the result from the survey experiment, where we find that signing a no-cheating declaration does not affect subjects’ expectations regarding their own cheating behavior in a hypothetical exam with weak monitoring. It may be the case that under strong incentives to cheat and in the absence of enforcement, the act of committing to a rule shifts students’ attitudes toward cheating but too weakly to affect actual compliance behavior. The next step of our analysis is to examine how the effects of commitment requests vary with the level of enforcement. To this end, we exploit the variation in the level of monitoring within the commitment and control treatment groups. This allows us to run regressions that account for a potential interaction effect between monitoring and commitment. We use two sources of within-treatment variation in monitoring: interhall variation, which stems from differences in the number of students per supervisor between halls, and intrahall variation in the distance between students’ seats and the nearest supervisor. Table 3 displays results from the OLS regressions, which indicate the heterogeneity of the effect of commitment on performance with respect to both forms of within-treatment variation. Column (1) uses the student-to-supervisor ratio as the source of variation in monitoring and uses all 541 students in the commitment and control treatment groups in Exam 1.26 Column (2) includes the interaction between commitment and the distance to the nearest supervisor and uses all 894 students in the commitment and control treatment groups from both exams. From both regressions, we obtain a negative coefficient for the treatment indicator (p-values ≤ 0.06) and a positive coefficient for the interaction between commitment and the inverse measure of monitoring (p-values ≤ 0.04). This means that if monitoring as a contextual factor is sufficiently strong, requesting commitment to a no-cheating rule is effective in preventing cheating. In fact, the effect of commitment turns out to be substantial for subjects who happened to experience rather high levels of monitoring. For example, evaluating the effect of monitoring in column (1) for the lowest implemented student-to-supervisor ratio (29 students per supervisor), we obtain a treatment effect of −10.0. Relative to the average performance of 72.4% correctly answered multiple choice questions in the control subject) or run regressions separately for both exams. Specifically, the conditional effect of commitment in both exams is close to zero and insignificant (Exam 1, p-value 0.980; Exam 2, p-value 0.944). 26 In Exam 2, all 204 students in the control treatment were seated in one lecture hall. Therefore, we lack interhall variation in the level of monitoring in Exam 2.
14
group, this indicates a 13.8% decrease in exam performance. A similar exercise for column (2) reveals that the commitment triggers a 5.5% decrease in performance for students sitting closest to supervisors.27 The positive interaction between commitment and monitoring may indicate that when subjects are asked to commit to a no-cheating rule, they behave in a more rule-compliant manner only if monitoring and auditing lend sufficient credibility to the rule and the sanctions associated with violating it. The estimates from Table 3 suggest that the commitment request improves exam performance relative to the control group among students acting under very weak monitoring. This unintended effect of increased cheating may be due to several factors. One possibility is that the commitment request directs subjects’ attention to the lack of enforcement and thereby prompts them to cheat more. In view of all the evidence from our setting, we arrive at the following conclusions. First, requesting commitment to a no-cheating rule has the potential to shift subjects’ attitudes toward rule-violating behavior. Second, commitment requests can be quite effective tools for inducing rule-compliant behavior. However, the signing of a declaration of compliance does not have this effect on its own. Rather, the effect arises from a positive interaction between the commitment request and standard tools of rule enforcement. Put differently, as tools for inducing rule-compliant behavior, codes of conduct and rule enforcement are complements. As a consequence, commitment requests tend to be ineffective or may even backfire when applied in settings with weak enforcement.
5
Robustness and Discussion
To evaluate the robustness of the evidence from our field experiment, we further tested the hypothesis that requesting commitment to a no-cheating rule is ineffective in the absence of enforcement. To this end, we set up a simple cheating experiment in the laboratory, where it was very clear to subjects that cheating could not be detected. In the Appendix, Part C and Table A2, we document the experimental setup and the results. Our findings from the lab clearly confirm those from the field experiment: without any monitoring, subjects cheat quite extensively, and commitment to a no-cheating rule has no discernible effect on behavior. In sum, the main implication of our study is that firms and other organizations should be cautious when implementing policies involving the request that members 27
Specifically, column (2) uses the distance in meters to the nearest supervisor divided by the maximum distance by treatment as the (inverse) measure of monitoring. This measure of monitoring varies between 12.7 and 100.
15
of the organization declare their compliance with a code of conduct. Our key finding is that behavioral responses to commitment strongly depend on how well-enforced the rules set out in the code of conduct are. Requesting commitment can be an effective tool when it serves as a complement to existing enforcement policies like monitoring and auditing, but it is likely to be ineffective when enforcement is weak. The evidence from our field experiment suggests that if enforcement is below a critical level, commitment requests may even backfire, inducing more cheating than in a situation without commitment. We conclude that the fight against fraud and unethical behavior in firms and other organizations is not about choosing correctly between enforcing a rule or relying on commitment requests – it is about doing both and finding the right mix. Our study has implications for contexts other than fraud and unethical behavior in organizations. In fact, formal requests to commit to a given set of rules or to certify the truthfulness of self-reported information are ubiquitous, ranging from contexts like tax filing to making insurance claims. What is more, monitoring through third-party information in such settings is often incomplete. Our findings suggest that one should not be too optimistic about the ability of commitment requests to boost compliance in such settings. Finally, although context matters, it is likely not the only factor that influences the effectiveness of commitment requests. For example, the norm or rule to which commitment refers may have important implications for compliance. Mazar et al. (2008) and Shu et al. (2011) conducted a laboratory experiment involving a commitment request that referred to morally charged norms like the Ten Commandments or honor codes of academic institutions. Despite low levels of enforcement, both studies suggested that such morally charged commitment requests reduce cheating. We leave it to future research to investigate the interplay between the content of rules, enforcement policies, and the effectiveness of commitment.
References ARIELY, D., BRACHA, A. and MEIER, S. (2009). Doing Good or Doing Well? Image Motivation and Monetary Incentives in Behaving Prosocially. American Economic Review, 99 (1), 544–55. BEHAVIOURAL INSIGHTS TEAM (2012). Applying Behavioural Insights to Reduce Fraud, Error and Debt. Cabinet Office, London. BURKS, S. and KRUPKA, E. L. (2012). A Multimethod Approach to Identifying Norms 16
and Normative Expectations Within a Corporate Hierarchy: Evidence from the Financial Services Industry. Management Science, 58 (1), 203–217. CASE, A., ROUX, I. L. and MENENDEZ, A. (2004). Medical Compliance and IncomeHealth Gradients. American Economic Review, 94 (2), 331–335. CHARNESS, G. and DUFWENBERG, M. (2006). Promises and Partnership. Econometrica, 74 (6), 1579–1601. DEATON, A. (2010). Instruments, Randomization, and Learning about Development. Journal of Economic Literature, 48 (2), 424–55. DWENGER, N., KLEVEN, H. J., RASUL, I. and RINCKE, J. (2016). Extrinsic and Intrinsic Motivations for Tax Compliance: Evidence from a Field Experiment in Germany, forthcoming in: American Economic Journal: Economic Policy. ELLINGSEN, T. and JOHANNESSON, M. (2004). Promises, Threats and Fairness. Economic Journal, 114 (495), 397–420. ERAT, S. and GNEEZY, U. (2012). White Lies. Management Science, 58 (4), 723–733. FALK, A. and ICHINO, A. (2006). Clean Evidence on Peer Effects. Journal of Labor Economics, 24 (1), 39–58. FISCHBACHER, U. and FÖLLMI-HEUSI, F. (2013). Lies In Disguise–An Experimental Study On Cheating. Journal of the European Economic Association, 11 (3), 525– 547. GINO, F., AYAL, S. and ARIELY, D. (2009a). Contagion and Differentiation in Unethical Behavior. The Effect of One Bad Apple on the Barrel. Psychological Science, 20 (3), 397–420. —, GU, J. and ZHONG, C.-B. (2009b). Contagion or Restitution? When Bad Apples Can Motivate Ethical Behavior. Journal of Experimental Social Psychology, 45 (6), 1299–1302. —, KRUPKA, E. L. and WEBER, R. A. (2013). License to Cheat: Voluntary Regulation and Ethical Behavior. Management Science, 59 (10), 2187–2203. GNEEZY, U. (2005). Deception: The Role of Consequences. American Economic Review, 95 (1), 384–394.
17
GOLDSTEIN, N. J., CIALDINI, R. B. and GRISKEVICIUS, V. (2008). A Room with a Viewpoint: Using Social Norms to Motivate Environmental Conservation in Hotels. Journal of Consumer Research, 35 (3), 472–482. JONES, G. E. and KAVANAGH, M. J. (1996). An Experimental Examination of the Effects of Individual and Situational Factors on Unethical Behavioral Intentions in the Workplace. Journal of Business Ethics, 15 (5), 511–523. LEVITT, S. D. and LIN, M.-J. (2015). Catching Cheating Students. NBER Working Papers 21628, National Bureau of Economic Research, Inc. LUDWIG, J., KLING, J. R. and MULLAINATHAN, S. (2011). Mechanism Experiments and Policy Evaluations. Journal of Economic Perspectives, 25 (3), 17–38. MAZAR, N., AMIR, O. and ARIELY, D. (2008). The Dishonesty of Honest People: A Theory of Self-Concept Maintenance. Journal of Marketing Research, 45, 633–644. SHU, L. L., GINO, F. and BAZERMAN, M. H. (2011). Dishonest Deed, Clear Conscience: When Cheating Leads to Moral Disengagement and Motivated Forgetting. Personality and Social Psychology Bulletin, 37 (3), 330–349. —, MAZAR, N., GINO, F., BAZERMAN, M. H. and ARIELY, D. (2012). Signing at the Beginning Makes Ethics Salient and Decreases Dishonest Self-Reports in Comparison to Signing at the End. Proceedings of the National Academy of Sciences, 109 (38), 15197–15200.
18
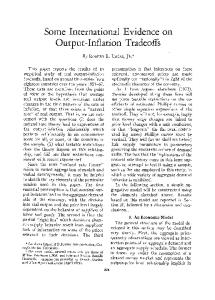
Figure 1: Monitoring Conditions in the Field Experiment Baseline Monitoring
Close Monitoring
Notes: This figure is a stylized illustration of baseline monitoring (control group and commitment treatment) and close monitoring (monitoring treatment). Gray dots represent students; black squares represent supervisors. The average monitoring intensities were 44.2 students per supervisor under baseline monitoring, and 8.4 students per supervisor under close monitoring.
19
Figure 2: Overview of Field-Experimental Design
Exam 1 Sample 1007 students sampled 766 students took exam
Control
Commitment
Monitoring
432 students sampled 333 students took exam
265 students sampled 208 students took exam
310 students sampled 225 students took exam
Exam 2 Control
Commitment
262 students sampled 204 students took exam
170 students sampled 149 students took exam
Grading / Data Collection Notes: This figure visualizes the experimental design. The field experiment was implemented in two written exams. Exam 1 comprised a control group and two treatment groups, commitment and monitoring. Students assigned to the control group in Exam 1 were also sampled for the intervention in Exam 2, comprising a control group and a commitment treatment group. The figure indicates, for each treatment, the number of students assigned to the respective treatment group, and the number of students who actually took the exam. Differences between the two figures are due to the fact that students could postpone participation to later semesters.
20
.03
.035
.04
p-value of two-sided test: 0.000
.03
B: Commitment
p-value of two-sided test: 0.004
.045
CDF
Index
.04
Kernel Density
Index
.035
A: Control
.045
Kernel Density
CDF
.03
Figure 3: Permutation Tests: Cheating by Treatment Group
.04 Index
.045 p-value of two-sided test: 0.802
.035
C: Monitoring
.05
CDF
Notes: This figure shows permutation tests for the presence of cheating by treatment groups in Exam 1. The tests were designed to capture copying from neighbors in the exam and were based on an index of similarities in incorrect answers among students sitting next to each other in the same row. In each panel, the vertical line represents the index value for the actual seating arrangement. The solid line shows the counterfactual distribution of the index on the basis of Epanechnikov kernels. The dashed line shows the respective cumulative distribution function (CDF). p-values below panels are for two-sided tests of the actual index value against the counterfactual distribution.
Kernel Density
200
150
100
50
0
1 .8 .6 .4 .2 0
200 150 100 50 0
1 .8 .6 .4 .2 0
150 100 50 0
1 .8 .6 .4 .2 0
21
Table 1: Effects of Commitment on Attitudes Towards Cheating
Commitment vs. Control Average Outcome in Control Group Number of Observations
Acceptance of Cheating (1) -0.960** [0.025] 3.62 61
Psychic Cost of Cheating (2) 6.07* [0.086] 14.7€ 50
Predicted Own Cheating Behavior (3) -0.233 [0.738] 5.20 60
Notes: This table shows average treatment effects of commitment on attitudes towards cheating. Column (1) reports the treatment effect on how acceptable subjects consider cheating in university exams. Responses lie between one (do not accept at all) and 10 (fully accept). Column (2) shows the treatment effect on the psychic cost associated with cheating, measured as the minimum additional payoff required to make cheating in a laboratory experiment acceptable. Column (3) displays the treatment effect on subjects’ predicted own cheating behavior in a hypothetical exam situation, standardized to lie between one (would not take advantage of cheating opportunity) and 10 (would take full advantage). Differences in the number of observations between columns are due to different numbers of students with non-response or “don’t know” answers. Significance: ** 5%; * 10%, inference based on Mann-Whitney U-tests (p-values in brackets).
22
Table 2: Monitoring and Commitment: Average Treatment Effects Dependent Variable: Share of Correct Answers
A: Effect of Monitoring (Monitoring vs. Control)
Unconditional Estimates (1) -2.70** [0.036]
Share of Correct Answers in Control Group Number of Observations B: Effect of Commitment (Commitment vs. Control)
Controlling for Strata Variables (2) -2.39* [0.053] 72.4 558
-0.181 [0.866]
Share of Correct Answers in Control Group Number of Observations
-0.066 [0.947] 72.4 894
Notes: This table shows OLS estimations of average treatment effects on exam performance, measured by the share of correct multiple choice answers. Panel A reports the effect of the monitoring treatment (monitoring vs. control), using subjects from Exam 1 (the monitoring treatment was implemented in this exam only). Panel B shows the effect of the commitment treatment (commitment vs. control), using pooled data from Exam 1 and Exam 2. Specifications in Panel B include a dummy variable for Exam 2. Significance: ** 5%; * 10%. Standard errors are clustered by row (p-values in brackets).
23
Table 3: Heterogeneity in Response to Commitment Dependent Variable: Share of Correct Answers
Commitment Students per Supervisor Commitment × Students per Supervisor Distance to Supervisor Commitment × Distance to Supervisor Share of Correct Answers in Control Group Number of Observations
Within-Treatment Variation in Monitoring: Students per Supervisor Distance to Supervisor (1) (2) -24.2* -5.21* [0.054] [0.060] -0.157 [0.100] 0.488** [0.042] -0.045 [0.103] 0.095** [0.040] 72.4 72.4 541 894
Notes: This table shows OLS estimations of the heterogeneous effect of the commitment treatment on exam performance, measured by the share of correct multiple choice answers. We investigate the heterogeneity of the treatment effect with respect to within-treatment variation in monitoring, measured by the number of students per supervisor (column 1) and the physical distance in meters between the student’s seat and the location of the next supervisor, divided by the maximum distance by treatment (column 2). The relative distance measure varies between 12.7 and 100. Column (1) uses only subjects from Exam 1 (we did not implement within-treatment variation in students per supervisor in Exam 2). Column (2) uses subjects from Exam 1 and Exam 2. Both specifications control for strata variables. Column (2) also includes a dummy variable for Exam 2. Significance: ** 5%; * 10%. Standard errors are clustered by row (p-values in brackets).
24
Online Appendix (Not For Publication) A
Experiment on Attitudes Towards Cheating: Details
The lab experiment discussed in subsection 4.1 had two treatments: control and commitment. The sequence of events in the experiment was as follows. In the commitment treatment, the experimenter asked participants to sign a declaration to adhere to a no-cheating rule and checked if all participants did so. The declaration read: I hereby declare that I will not use unauthorized materials during the experiment. Furthermore, I declare neither to use unauthorized aid from other participants nor to give unauthorized aid to other participants. In the control treatment, the declaration-stage of the experiment was not implemented. In both treatments, the experimenter distributed a questionnaire (see the following pages for a sample) and participants answered it. Next the experimenter distributed materials for a real-effort task and read out instructions. The experimenter then started the stage with the real-effort task. Participants had five minutes to answer 20 multiple choice questions on principles of economics. The type of multiple choice questions was similar to those in Exam 1 in the field experiment. After finishing the real-effort task, participants handed in their answers to the experimenter who counted the number of correct answers. Subjects were paid according to their performance, using a piece rate per correct answer of €0.50. The show-up fee was €5. The experimenter made sure that participants did not learn about other participants’ performance in the real effort task. The following table summarizes the design of the experiment. Laboratory Experiment on Attitudes Towards Cheating: Summary of Design Treatment Stage of Experiment
Commitment
Control
1 2 3 4
Subjects Sign Declaration Questionnaire Real Effort Task Evaluation by Experimenter
No Declaration Questionnaire Real Effort Task Evaluation by Experimenter
Question 1 Please indicate for each of the following actions whether you think it can always be justified, never be justified, or something in between. Please choose a value from the following list: 1 means “never justifiable”, 10 means “always justifiable”.
Always Don’t N/A justifiable know
Never justifiable
1
Using unauthorized materials during exams ............
2
3
4
5
6
7
8
9
10
Using unauthorized aid from other students during exams ............................................................
Giving unauthorized aid to other students during exams ........................................................................
Using unauthorized materials during laboratory experiments ..............................................................
Question 2 Imagine you earn €5 during this laboratory experiment without using unauthorized materials. Assume that using unauthorized materials cannot be detected. Please indicate the minimum payoff under usage of unauthorized materials that would let you choose this option.
___________________________ €.
Question 3 Imagine you obtain the mark 2.3 in the exam of a compulsory course. Assume that using unauthorized materials cannot be detected. Please indicate the minimum mark under usage of unauthorized materials that would let you choose this option.
____________________________.
Question 4 Imagine you participate in an exam and using unauthorized materials cannot be detected. Please indicate to what extent you would use unauthorized materials and what kind of behavior you would expect from other students. Please choose a value from the following list for yourself and regarding other students: 1 means “no usage of unauthorized materials”, 10 means “full usage of unauthorized materials”.
Full usage of Don’t
No usage of any
N/A
unauthorized know
unauthorized material
material
1
2
3
4
5
6
7
8
9
10
You ............................................................................
Other students ..........................................................
26
Question 5 For every of the statements below, please indicate to what extent you agree with them. Please choose a value from the following list: 1 means “I totally disagree”, 4 means “I totally agree”.
Totally
Totally
Don’t
disagree
agree
know
1
2
3
4
N/A
I’m always trying to figure myself out .....................
Generally, I’m not very aware of myself ..................
I reflect about myself a lot .......................................
I’m often the subject of my own fantasies ..............
I never scrutinize myself ...........................................
I’m generally attentive to my inner feelings .............
I’m constantly examining my motives ......................
I sometimes have the feeling that I’m off somewhere watching myself .................................... I’m alert to changes in my mood .............................. I’m aware of the way my mind works when I work through a problem...........................................
Question 6 a)
Age b) Gender c) Begin of studies (year) d) Field of Studies e) Number of computer
____________________________
____________________________
____________________________
____________________________
____________________________
27
B
Permutation Tests: Similarity Index
The test procedure is based on a treatment-specific index of similarity, P P It =
i
j6=i
P
k 1[ j
∈ Wn (i)] × 1[mcki = mck j ] × 1[mcki ∈ Sk ] P P P , i j6=i k 1[ j ∈ Wn (i)]
where treatments are indexed t ∈ {control, commitment, monitoring}, students are indexed i ∈ {1, 2, . . . , Nt }, and multiple choice questions are represented by k ∈ {1, 2, . . . , 30}. The indicator function 1[ j ∈ Wn (i)] gives spatial weights of value 1 if j is part of the set of n neighbors Wn (i) = { j(1), j(2), ..., j(n)} of i, and 0 otherwise. For each k, i chooses one answer mcki ∈ M Ck = {a), b), c), d), no unique mar k}. The indicator function 1[mcki = mck j ] takes the value 1 if i and j gave the same answer to question k, and 0 otherwise. By specifying the subset Sk ⊆ M Ck , we can restrict the index to measure similarities in correct or incorrect answers. The indicator function 1[mcki ∈ Sk ] takes the value 1 if the answer of student i is part of the subset Sk , and 0 otherwise.
C
Laboratory Experiment on Cheating Behavior
Design The evidence documented in the paper comes from a field experiment implemented in a setting that is, of course, specific in many ways. As a robustness check, we tested the effectiveness of the same type of commitment requests in the laboratory, which arguably provides a more neutral setting. The experiment we implemented was based on the design of Mazar et al. (2008). It identifies the effect of requesting commitment to a no-cheating rule on subjects’ decisions to cheat when self-reporting their performance in a real effort task. The experiment also identifies the extent of cheating by including a treatment with perfect monitoring. The subjects for the laboratory experiment were drawn from the same population of undergraduate students as in the field experiment. The experiment had three treatments: control, commitment, and monitoring.28 The sequence of events in the experiment was as follows: The experimenter started the experiment by distributing materials (including a questionnaire) and reading out instructions.29 In the commitment treatment, the experimenter asked partici28
We implemented all treatments in separate sessions. Apart from questions on age, gender, field of study and beginning of studies, the questionnaire includes a field for the number of correct answers. 29
28
pants to sign a declaration containing a no-cheating rule and checked if all participants did so. The declaration read: I hereby declare that I will not use unauthorized materials during the experiment. Furthermore, I declare neither to use unauthorized aid from other participants nor to give unauthorized aid to other participants. In the control treatment, the declaration-stage of the experiment was not implemented. The experimenter then started the stage with the real-effort task. Participants had five minutes to answer 20 multiple choice questions on principles of economics. The type of multiple choice questions was similar to those in Exam 1 in the field experiment. To test for robustness regarding the type of real effort task, we re-ran the experiment using the same matrix task as Mazar et al. (2008). This task consists of 20 matrices containing a set of 12 numbers with two decimal digits. Participants get four minutes to find two numbers per matrix adding up to 10.30 In the control and in the commitment treatment, the experimenter distributed a solution sheet once the stage with the real-effort task was over. Participants were asked to check their answers. Answer sheets wee not recollected in treatments with self-evaluation. Hence, subjects overstating their performance in these treatments did not face any risk of being detected.31 In the monitoring treatment, participants handed in their answers to the experimenter who counted the number of correct answers. Participants then answered a questionnaire. In the control and in the commitment treatment, participants had to self-report the number of correct answers in a separate field on the questionnaire. In the control and the commitment treatment, the experimenter paid participants according to their self-reported performance, using a piece rate per correct answer of €0.50. The show-up fee was €5. In the monitoring treatment, subjects were paid according to their actual performance. The experimenter made sure that participants did not learn about other participants’ performance and/or self-reports. The following table summarizes the design of the experiment.
Data The experiment took place in December 2013 in the Laboratory for Experimental Research, Nuremberg. In total, 184 students participated in the experiments. 91 30
According to Mazar et al. (2008), subjects do not view this task as one reflecting math abilities or intelligence. 31 We made sure that participants realized the detection probability was zero by stating upfront that answer sheets would not be recollected. We also made sure that participants did not learn about other participants’ (actual or self-reported) performance.
29
Laboratory Experiment on Cheating Behavior: Summary of Design Treatment Stage of Experiment 1 2 3
Commitment
Monitoring
Control
Subjects Sign Declaration No Declaration No Declaration Real Effort Task Real Effort Task Real Effort Task Self-Evaluation Evaluation by Experimenter Self-Evaluation
subjects worked on the multiple choice task, while 93 subjects worked on the matrix task. Sessions lasted 45 minutes on average. Participants on average earned €9.8, including the show-up fee. Subject samples were balanced across treatments in observable characteristics.
Results Table A2 summarizes the results for the multiple choice and for the matrix task. The outcome studied is the share of correct answers in percent. We report average treatment effects in relative terms (average treatment effect divided by mean outcome in control group). Column (1) shows the effect of monitoring (monitoring vs. control treatment) for the multiple choice task. Without any opportunity to cheat, subjects’ performance is 37.5 percent lower compared to the condition with self-evaluation (p-value = 0.006). This demonstrates that subjects make heavy use of a cheating opportunity if one is available to them. Column (2) shows the effect of commitment (commitment vs. control treatment). The commitment request has no significant effect on performance under self-evaluation (p-value = 0.278). Columns (3) and (4) report the effects of monitoring and commitment from the experiment using the matrix task. We find the results from the multiple choice task confirmed.
30
31 0.81
Bavaria
0.83
0.01
19.6
0.06
0.73
0.84
0.02
19.6
0.09
0.73
2.50
(3) 0.50
Monitoring
Difference Commitment– Control (4) 0.02 (0.04) 0.02 (0.05) -0.02 (-0.02) -0.01 (0.02) -0.04 (0.10) -0.01 (0.01) 0.02 (0.03)
Difference Monitoring– Control (5) -0.04 (0.04) 0.03 (0.05) -0.02 (-0.02) 0.02 (0.02) -0.03 (0.10) 0.00 (0.01) 0.02 (0.03) 0.80
0.02
19.7
0.08
0.75
2.48
(6) 0.53
Control
0.83
0.02
19.5
0.08
0.74
2.50
(7) 0.53
Commitment
Exam 2 Difference Commitment– Control (8) 0.00 (0.05) 0.02 (0.06) -0.01 (0.02) 0.00 (0.03) -0.14 (0.11) 0.00 (0.02) 0.03 (0.04)
Notes: This table shows balancing checks for both exams covered in the field experiment. Columns (1) to (3) report treatment-specific means for Exam 1. Column (4) shows the difference in means between commitment and control with heteroscedasticity-robust standard errors in parentheses. Column (5) reports the difference in means between monitoring and control. Columns (6) to (8) report means and the difference in means for Exam 2. Female is a dummy variable (female = 1). University Admission Grade is the overall grade of the university admission qualification (from High School), ranging from 1.0 (outstanding) to 4.0 (pass). Math Proficiency is obtained from a university math exam taken prior to the exams studied in the experiment. The proficiency score gives the percentage of total points the student obtained in the math test. Field of Study is a dummy for students with a major in Economics & Sociology, the reference group being students enrolled in Economics and Business Administration. Foreign and Bavaria are dummies indicating where students obtained their university admission (reference group: German states other than Bavaria). The sample consists of the 766 students in the experiment. Gender and University Admission Grade were used for stratification.
0.02
0.07
Field of Study (Econ. & Sociology = 1)
Foreign
0.75
Math Proficiency
19.6
2.47
University Admission Grade
Age
(2) 0.56
(1) 0.54
Gender (Female = 1) 2.48
Commitment
Control
Exam 1
Table A1: Balancing Checks Field Experiment
Table A2: Effects of Monitoring and Commitment on Performance in the Lab Multiple Choice Task Effects in % Monitoring (1) Treatment vs. Control Performance in Control Group Number of Observations
Commitment (2)
-37.5*** [0.006]
13.5 [0.278]
Matrix Task Effects in % Monitoring (3) -37.5*** [0.000]
52.0% 60
Commitment (4) -11.3 [0.222]
57.1% 61
61
63
Notes: This table reports average treatment effects on the share of correct answers from real effort tasks in percent. Columns (1) and (2) show the effects of monitoring and commitment from the experiment using the multiple choice task. Columns (3) and (4) report the same effects from the experiment using the matrix task. Significance: *** 1%, based on Mann-Whitney U-tests (p-values in brackets).
32
Figure A1: Permutation Tests: Cheating by Treatment Group (Exam 2) B: Commitment
.8
1
40
CDF
.6
30
.4
20
.2 .02
.04
.06
.08
.1
Index
Index
p-value of two-sided test: 0.054
p-value of two-sided test: 0.000
0
.08
0
.06
10
.4 .2 .04
0
.02
Kernel Density
.8 CDF
.6
30 20 0
10
Kernel Density
40
1
50
A: Control
.12
Notes: This figure shows permutation tests for the presence of cheating by treatment groups in Exam 2. The tests are designed to capture copying from neighbors in the exam and are based on an index of similarities in incorrect answers among students sitting next to each other in the same row. In each panel, the vertical line represents the index value for the actual seating arrangement. The solid line shows the counterfactual distribution of the index on the basis of Epanechnikov kernels. The dashed line shows the respective cumulative distribution function (CDF). p-values below panels are for two-sided tests of the actual index value against the counterfactual distribution.
33
.03
Index
.04
p-value of two-sided test: 0.818
.035
A: Control
.045
.03
.04 Index
.045
p-value of two-sided test: 0.346
.035
B: Commitment
.05
Kernel Density
CDF
Kernel Density
CDF
Figure A2: Testing for Column-Wise Cheating (Exam 1)
.03
.04 Index
.045 p-value of two-sided test: 0.774
.035
C: Monitoring
.05
CDF
Notes: This figure shows permutation tests for the presence of cheating by treatment groups in Exam 1. The tests are designed to capture copying from neighbors in the exam and are based on an index of similarities in incorrect answers among students sitting next to each other in the same column. In each panel, the vertical line represents the index value for the actual seating arrangement. The solid line shows the counterfactual distribution of the index on the basis of Epanechnikov kernels. The dashed line shows the respective cumulative distribution function (CDF). p-values below panels are for two-sided tests of the actual index value against the counterfactual distribution.
Kernel Density
200
150
100
50
0
1 .8 .6 .4 .2 0
200 150 100 50 0
1 .8 .6 .4 .2 0
150 100 50 0
1 .8 .6 .4 .2 0
34
Figure A3: Testing for Column-Wise Cheating (Exam 2) B: Commitment
p-value of two-sided test: 0.233
.4
20
CDF
.6
30
.8
1
40
.1
.2 .02
.04
.06 Index
.08
0
.08
0
.06 Index
10
.4 .2 .04
0
.02
Kernel Density
.8 CDF
.6
30 20 0
10
Kernel Density
40
1
50
A: Control
.1
p-value of two-sided test: 0.330
Notes: This figure shows permutation tests for the presence of cheating by treatment groups in Exam 2. The tests are designed to capture copying from neighbors in the exam and are based on an index of similarities in incorrect answers among students sitting next to each other in the same column. In each panel, the vertical line represents the index value for the actual seating arrangement. The solid line shows the counterfactual distribution of the index on the basis of Epanechnikov kernels. The dashed line shows the respective cumulative distribution function (CDF). p-values below panels are for two-sided tests of the actual index value against the counterfactual distribution.
35
Figure A4: Testing for Differences in Cheating Between Treatments
.01
p-value of two-sided test: 0.235
1 .8 CDF
.6
30
.4 -.04
.2 -.02
0 Difference
.02
0
.005
0
0 Difference
20
Kernel Density
.4 .2 -.005
0
-.01
10
1 .8 CDF
.6
150 100 50 0
Kernel Density
40
B: Exam 2
200
A: Exam 1
.04
p-value of two-sided test: 0.670
Notes: This figure shows permutation tests for differences in cheating between the control and the commitment treatment. Panel A shows the test for Exam 1, and Panel B for Exam 2. To make treatment comparisons, we extend the spatial permutation test to the hypothesis of no difference in the similarity-index between the control group and the commitment treatment. To impose the null of random differences between treatments, we now allow for random reassignments across halls and treatments when deriving the counterfactual distribution. In each panel, the vertical line shows the difference between the treatment-specific indices (commitment vs. control) for the actual seating arrangement. The solid line shows the counterfactual distribution of the difference between indices on the basis of Epanechnikov kernels. The dashed line shows the respective cumulative distribution function (CDF). p-values below panels are for two-sided tests of the actual index value against the counterfactual distribution.
36
Front sheet of exam materials in the field experiment Answer Sheet for Exam in „Principles of Economics“ First Name
Date
Last Name
Semester
Matriculation Number
Seat Number
Field of Study
Room
Email Address
Framed part varied in field experiment: included in Commitment, not included in Monitoring and Control
Declaration I hereby declare that I will not use unauthorized materials during the exam. Furthermore, I declare neither to use unauthorized aid from other participants nor to give unauthorized aid to other participants. ________________________ Signature
37