FEPSTRUM REPRESENTATION OF SPEECH SIGNAL Vivek Tyagi and Christian Wellekens Institute Eurecom B.P 193 -06904 Sophia Antipolis, France
[email protected] and
[email protected] ABSTRACT
matic sinusoidal signal). Therefore to be able to extract the AM signals of a wide-band signal such as speech (typically 4KHz), it is necessary to decompose the speech signal into narrow spectral bands. We follow this approach in this paper as opposed to the previous use of the speech modulation spectrum [10, 11, 12, 13, 14] which was derived by decomposing the speech signal into increasingly wider spectral bands (such as critical, Bark or Mel). Similar arguments from the modulation filtering point of view, were presented by Schimmel and Atlas[3]. In their experiment, they consider a wide-band filtered speech signal , where is the AM signal and is the broadband carrier signal. Then, they perform a low-pass modulation filtering of the AM signal to obtain . is then multiplied The low-pass filtered AM signal with the original carrier to obtain a new signal . is not necThey show that the acoustic bandwidth of essarily less than that of the original signal . This unexpected result is a consequence of the signal decomposition into wide spectral bands that results in a broad-band carrier[3]. We realise that this is not only a serious problem for modulation filtering[3], but also for modulation spectrum analysis (which is used as feature vector for ASR and is the topic of this paper). As a solution, we propose using non-overlapping and narrow-band filters to decompose speech signal, followed by the AM signal estimation in each band. The usefulness of this modification is further explained, later on in this paper. Over the past few decades, pole-zero transfer functions that are used for modeling the frequency response of a signal, have been well studied and understood [7, 8, 19]. In this work we will denote them by “F-PZ”. Lately, Kumaresan et. al.[1, 2] have proposed to model analytic signals[17] using pole-zero models in the temporal domain (denoted by TPZ to distinguish them from the F-PZ). Along similar lines, Athineos et. al.[11, 12] have used the dual of the linear prediction in the frequency domain to improve upon the TRAP features. An inherent advantage of working with the analytic signal is that it elegantly allows the decomposition of an arbitrary signal (possibly non-stationary) into its amplitude
Pole-zero spectral models in the frequency domain have been well studied and understood in the past several decades. Exploiting the duality between the temporal domain and the frequency domain, Kumaresan et al[1, 2] have shown that the pole-zero model of the analytic speech signal in the temporal domain leads to its characterization in terms of the positive amplitude modulation (AM) and positive instantaneous frequency (PIF). In this paper, we carefully define AM and frequency modulation (FM) signals in the context of ASR. We show that for a theoretically meaningful estimation of the AM signal, it is necessary to decompose the speech signal into several narrow spectral bands as opposed to the previous use of the speech modulation spectrum[10, 11, 12, 13, 14], which was derived by decomposing the speech signal into increasingly wider spectral bands (such as critical, Bark or Mel). The estimated AM message signals are downsampled and their lower DCT coefficients are retained as speech features. These features carry information that is complementary to the MFCCs. A Tandem[5, 16] combination of these two features is shown to improve recognition accuracy. 1. INTRODUCTION In past several years, significant efforts have been made to develop new speech signal representations which can better describe the non-stationarity (spectral dynamics) inherent in the speech signal. Some representative examples are temporal patterns (TRAPS) features[5, 12], MLP based features[6] and the several modulation spectrum related techniques[10, 12, 13, 14, 15]. In TRAPS technique, temporal trajectories of spectral energies in individual critical bands over windows as long as one second are used as features for pattern classification. Recently, Sukittanon and Atlas have proposed a multi-scale modulation frequency decomposition technique for a communication signal classification task[4]. The notion of the amplitude modulation (AM) and the frequency modulation (FM) were initially developed for the communication signals[17]. In theory, the AM signal modulates a narrow-band carrier signal (specifically, a monochro-
0-7803-9479-8/05/$20.00 2005 IEEE
11
ASRU 2005
modulation (AM) and frequency modulation (FM) signals. We make extensive use of T-PZ representation in this paper. For the sake of completeness and clarity, we state and prove several interesting time-frequency dualities for the analytic signals. These properties are then used to develop “meaningful” AM-FM decomposition of the speech signal. There are two main contributions of this paper. Firstly, we develop a theoretically consistent AM signal analysis technique as compared to the previous ones[11, 10, 13, 14, 15]. We show that a “meaningful” AM signal estimation is possible only if we decompose the speech analytic signal into several narrow-band filters which results in narrowband carrier signals. As a consequence, the unexpected modulation filtering behaviour reported in [3] can be partly avoided. Secondly, we use the lower modulation frequency spectrum of the downsampled AM signal, as a feature vector (termed FEPSTRUM for reasons to be explained in the following sections). The Fepstrum provides complementary information to the MFCC features and a Tandem[5, 16] combination of the two features provides a significant ASR accuracy improvement over several other features. This paper is divided into four sections. In Section 2, we describe the dual properties of the pole-zero models and the associated notation. In Section 3, the Fepstrum feature extraction is described. Through examples, we show how the bandwidth of the analysis filter influences the estimated AM signal. In Section 4, experimental results are described followed by a conclusion in Section 5.
where is an arbitrary frequency translation, and is sufficiently large. Noting that is a polynomial, it can be factored in terms of T-PZ as follows,
(3) where and and are the complex roots, inside and outside the unit circle respectively. More generally, if s(t) is not band-limited, it can be represented using poles and zeros.
(4) where, and are the zeros inside and outside the unit circle respectively. The poles are guaranteed to be inside the unit circle as proved in the following lemma. Lemma 1 The T-PZ factorization of an analytic signal has all the poles inside the unit circle. Proof: Lets assume that there is a pole the unit circle, with . The expansion of have a term,
2. POLE-ZERO MODELS (ELEMENTARY SIGNALS) IN THE TEMPORAL DOMAIN
outside will then
(5)
Traditionally, the pole-zero transfer functions have been used to approximate a discrete time frequency response which is inherently periodic with a period of . Voelcker and Kumaresan have used the T-PZ to approximate analytic signals in the temporal domain. We recall that given a real periodic 1 signal with period T seconds, its analytic version is given by, (1)
where, A is a constant. (5) implies that has non-zero spectrum for negative frequencies. This is in contradiction being an analytic signal has zero spectral to the fact that energy for negative frequencies. Hence . The importance of lemma 1 will become apparent later on. Let us now specify the dual analogues of three well known properties which are,
denotes the Hilbert transform of . If is where band-limited, then so is . Moreover has non-zero can spectrum for only positive frequencies. Therefore be expressed in terms of a finite number of Fourier series coefficients at positive frequencies.
Minimum-phase: Traditionally, minimum phase is a frequency domain phenomenon. A frequency response (F-PZ) is termed minimum-phase if all its poles and zeros are inside the unit circle. Similarly, a T-PZ is called T-MinP if all its poles and zeros are inside the unit circle.
(2)
All-pass: Traditionally, all-pass is a frequency domain phenomenon. A frequency response, (F-PZ), is said to be all-pass if its magnitude is unity at all frequencies. Similarly, a T-PZ is called T-AllP if it has . unity magnitude for
1 This is not a limitation as in short-time Fourier analysis, we implicitly make the signal periodic with the base period equal to the second long windowed segment.
12
Causality: Traditionally, causality is a time-domain phenomenon. A signal is said to be causal if it . Similarly, we define is non-zero only for the a frequency response to be F-causal if it is non-zero only for the . Therefore, an analytic signal is F-causal.
sequence). Using the duality principle we note that is the FT of . In fact, is the complex cepstrum(CC) . As has the same funcof a signal whose FT is tional form as , this implies that is a discrete and causal CC sequence. Therefore in light of lemma (3), it folis minimum-phase F-PZ with all the zeros lows that and poles inside the unit circle. Therefore we get,
With these definitions in place, we are ready to describe the into its T-MinP and decomposition of an analytic signal T-AllP part which will lead to its AM and FM parts. Therefore, reflecting the zeros inside the unit circle, we get,
substituting t for ’-f’ we get, (7)
(6) that is T-MinP results in its This proves that the T-PZ phase being the HT of its log-envelope. can expressed as folTherefore, using Lemma (4), lows,
T-MinP
T-AllP
(8)
We recall the following two well-known lemmas, T-MinP
Lemma 2 Given a frequency response (F-PZ) , its phase response is the Hilbert trans, if and only if the freform of its log-envelope quency response is minimum phase (i.e a F-PZ with all the poles and zeros inside the unit circle).
where is a constant, is the logarithm of the AM sigits HT and is the phase signal and its nal, derivative is the FM signal. As can be determined from 3 , it forms the redundant informathe log AM signal tion and hence is excluded from the FM signal. Therefore, is the FM (instantaneous frequency) signal of interest, where denotes derivative. The next step is to develop algorithms that can automatically achieve the decomposition as in (8). Noting that the all-pole F-PZ as estimated using classical linear prediction technique is guaranteed to be minimum phase, Kumaresan et. al. used the dual of linear prediction in the spectral domain (LPSD)[2], with sufficiently high prediction order ’M’, to derive the T-MinP signal. The T-AllP signal was obtained as the residual signal of the LPSD. It is well know that the LP technique overestimates the peaks and poorly models the valley. Moreover, the results are highly susceptible to the model order ’M’ whose actual value is not known. Therefore, in this work, we use a nonparametric technique to estimate the AM signals. From (8), , where is we note that a constant over the frame. Therefore the logarithm of the absolute magnitude of the analytic signal in each band is an estimate of the corresponding AM signal + a constant term. In this work, we have used only the AM modulation spectrum as a feature and the work on FM signal inclusion in under progress.
Lemma 3 Given a frequency response (F-PZ) , it is minimum phase, if and only if, its comis causal (i.e plex cepstrum (CC) ) The proof of above two lemmas can be found in the pages 782-783 of [18]. Using the time-frequency duality, we will state and prove a dual of the lemmas (2), (3). Lemma 4 Given an analytic T-PZ signal , all of its poles and zeros are within the unit-circle (i.e s(t) is T-MinP) if and only if is the Hilbert transform of its log envelope its phase . Proof: Let
be the Fourier transform (FT) of . We note that consists of spectral lines at integral multiple of 2 and hence is a discrete seis the Hilbert quence. Lets assume that the phase transform of the log envelope . This implies that is an analytic signal and hence its FT is zero is a discrete and f-causal for negative frequencies (i.e. 2 This
T-AllP
can be seen by series expansion of 3 Due
13
to the HT relationship between the two
filter−1
log absolute magnitude
filter−2
log absolute magnitude
AM
AM
fepstrum_b1
downsample
lower DCT
downsample
lower DCT
fepstrum_b2 KLT tranform Dim. reduction
Analytic signal s(t)
Tandem Fepstrum Trained MLP
filter−J
log absolute magnitude
AM
downsample
fepstrum_bJ
lower DCT
Narrow band filterBank
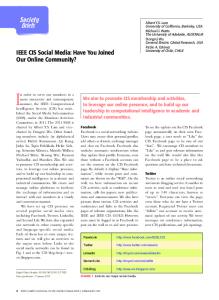
Fig. 1. The FEPSTRUM feature extraction 500
3. FEPSTRUM FEATURE EXTRACTION
400
AM signal
300
200
Amplitude
2000 1000
0
0
−100
−200
−1000
−300
A Speech segment −2000
100
0
100
200
300
Speech filtered by a broad filter of bandwidth 533 Hz centered at 533Hz.
−400
400
500
600
−500
0
100
200
300
400
500
600
Discrete time
400
AM signal 200
Fig. 3. The AM signal derived using broad-band filters
0
−200
−400
Speech filtered by a filter of bandwidth 160 Hz centered at 416Hz 0
100
200
300
400
500
output of each filter to obtain its corresponding AM signal . The AM signal is then downsampled and its lower DCT coefficients are retained as the feature vector. To distinguish this representation from the previous use of the word “modulation spectrum”[10, 13, 14], which has been weakly specified/defined in the ASR literature[3], we have termed this representation as FEPSTRUM. It bears certain followed by DCT opsimilarity to the cepstrum (due to eration) while it essentially is a spectrum of an AM signal, .4 The fepstrum features from each band are concatenated together, then uncorrelated using a KL transform followed by the dimensionality reduction. This representation is then fed to a Tandem[5, 6, 16] system to finally derive a Fepstrum-Tandem feature. In Tandem modeling, phoneme aposteriors obtained at the output of the MLP, which has been trained to classify phonemes, are used as features in a usual HMM-GMM system. Fig.2 illustrates the case when we use narrow-band fil-
600
Amplitude
400 AM signal
200
0 −200
−400
Speech filtered by a filter of bandwidth 104 Hz centered at 598 Hz 0
100
200
300
400
500
600
Discrete time
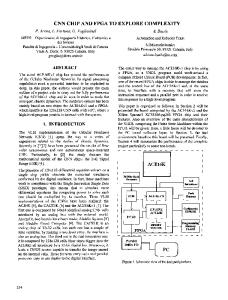
Fig. 2. The AM signal derived using narrow-band filters Fig.1 illustrates our feature extraction scheme. A fullband analytic speech signal s(t) is decomposed into linearly spaced, non-overlapping narrow bands. We have used narrow-bandwidth filters to achieve our objective of a more “meaningful” modulation analysis by keeping the carrier signal narrow-band (ideally, a sinusoid)[3]. The use of Mel, critical or Bark scale filters will lead to broad-band carriers for higher frequencies. We take the log magnitude of the
4 the
14
name FEPSTRUM denotes this dual nature
ters to decompose the speech analytic signal, followed by the AM signal estimation in each band. Second and third pane shows the narrow band-pass filtered speech signals and their corresponding AM signals. We note that these AM signals are low modulation frequency signals. The narrow band-pass filters used have band-widths 160 Hz and 104 Hz respectively. Fig.3 illustrates the case where a broad-band filter (bandwidth 533 Hz) has been used. For voiced speech, each pitch harmonic can be roughly seen as a monochromatic sinusoidal carrier signal. The spectrum of the signal at the output of a broad-band filter will have several pitch harmonics in it and therefore will violate the condition of a narrow-band carrier signal. As can be noted in the Fig.3, the pitch component manifests itself as sharp spikes in the AM signal. Therefore a modulation spectrum of this AM signal will reflect the pitch frequency as well, which is undesirable in the context of a speaker independent ASR system. We present these arguments to justify our choice of the non-overlapping narrow-band filterbank instead of a critical, Bark or Mel-scale filterbank, in the Fepstrum estimation.
aposteriors which are again KL transformed to obtain 27 dimensional Tandem-Fepstrum features6 . Tandem[5, 6, 16] has been shown to be an effective technique for combining different kind of features. Fepstrum being a modulation spectrum carries information that is complementary to the usual spectral envelope based MFCC features. Therefore we have concatenated MFCC feature with the FepstrumTandem features. Mel-frequency cepstral coefficients (MFCC) and their temporal derivatives along with cepstral mean subtraction have been used as additional features. For comparison, four feature sets were generated: 1. [T-MFCC:] 27 dim. Tandem representation of MFCC + delta features. 2. [T-Fepstrum:] 27 dim. Tandem representation of Fepstrum features 3. [Concat. MFCC+ (T-MFCC):] (27+39) dim. feature vector which is a concatenation of the MFCC and Tandem-MFCC
4. EXPERIMENTS AND RESULTS
4. [Concat. MFCC+ (T-FEPSTRUM):] (27+39) dim. feature vector which is a concatenation of the MFCC and Tandem-Fepstrum features.
In order to assess the effectiveness of the fepstrum features, speech recognition experiments were conducted on the OGI Numbers corpus [21]. It consists of spontaneously spoken free-format connected numbers over a telephone channel. The lexicon consists of 31 words.5 The Fepstrum features were extracted as per the scheme outlined in Fig.1. We used linearly spaced, non-overlapping rectangular filters to decompose the speech analytic signal into narrow-band sigHz each. The AM signal is obtained nals of bandwidth as the logarithm of the absolute magnitude of the narrowband filter output. At this stage, the AM signal has the same ). sampling frequency as the original speech signal ( As can be noted in the Fig2, the AM signals are low modulation frequency signals. Therefore, we filter the AM sigHz nals through a low-pass filter of cutoff-frequency and then downsample them by a factor of . Long rectangular windows of size ms were used to frame the narrow band-pass filtered analytic signals. This was done to ensure that we have sufficient number of samples after downsampling the AM signal. We chose a rectangular shape of the window to avoid any artificial tilt in the lower DCT coefficients. We then retain its first DCT coefficients (Fepstrum) that correspond to Hz. Fepstrum sub-vector from each band are concatenated together to form a vector ( ). We perform a KL transform of dimensionality on this vector, followed by dimensionality reduction to obtain a 60 dim. feature vector. These features are then fed to a trained multi-layer perceptron (MLP) to obtain phoneme 5 with
All the above features were then used in a Hidden Markov Model and Gaussian Mixture Model (HMM-GMM) based speech recognition system that was trained using public domain software HTK [20] on the clean training set from the original Numbers corpus. The system consisted of 80 tiedstate triphone HMMs with 3 emitting states per triphone and 12 mixtures per state. Table 1 indicates the performance of these feature sets. T-Fepstrum features have only the modulation frequency information and hence they perform slightly worse than the T-MFCC feature. However, as they carry complementary information, their concatenation (MFCC+T-FEPSTRUM) results in the lowest (4.1%) WER. For a fair comparison, we compare this to a concatenation of the MFCC+ T-MFCC features which has a WER of 4.6%. This is an encouraging result and we are further working on the feature represenations that will include the FM signal information in it. This may improve the results further. Table 1. Word error rate (WER) in clean conditions T-MFCC T-FEPSTRUM Concat. MFCC+ (T-MFCC) Concat. MFCC+ (T-FEPSTRUM)
6 each
confusable words like nine, ninety and nineteen.
15
5.2 5.5 4.6 4.1
dimension corresponds to a monophone which are 27 in number
5. CONCLUSION
[9] Y. Wang, J. Hansen, G. K. Allu, and R. Kumaresan, “ Average Instantaneous Frequency (AIF) and Average Log-envelopes (ALE) for ASR with the Aurora 2 database, ” Proc. of the Eurospeech 2003, Geneva, Switzerland.
We have extended the work of Kumaresan[2] to develop a theoretically sound AM-FM decomposition technique suitable for ASR application. We point out to the deficiency in the previous use of the modulation spectrum that was caused due to the use of the broad-band filters. Finally we present a suitable representation of the AM signal in form of the lower modulation frequencies of the downsampled AM signals in each band. A concatenation of the MFCCs with the Tandem-Fepstrum features achieves the lowest WER (4.1%). We are further working on new representations to include the information carried by the FM signal as well.
[10] V. Tyagi, I McCowan, H. Bourlard, H. Misra, “ MelCepstrum Modulation Spectrum (MCMS) features for Robust ASR, ” In the Proc. of IEEE ASRU 2003, St. Thomas, Virgin Islands, USA. [11] M. Athineos and D. Ellis, “Frequency domain linear prediction for temporal features, ” In the Proc. of IEEE ASRU 2003, St. Thomas, Virgin Islands, USA.
6. ACKNOWLEDGMENTS This work was supported by European Commission 6th Framework Program project DIVINES under the contract number FP6-002034. 7. REFERENCES
[12] M. Athineos, H. Hermansky, D. Ellis, “LP-TRAP: Linear predictive temporal patterns, ”, Proc. of SAPA, Jeju, S. Korea, April 2004. [13] Q. Zhu and A. Alwan, “AM-Demodualtion of speech spectra and its application to noise robust speech recognition,” Proc. ICSLP, Vol. 1, pp. 341-344, 2000. [14] B.E.D. Kingsbury, N. Morgan and S. Greenberg, “ Robust speech recognition using the modulation spectrogram,” Speech Communication, vol. 25, Nos. 1-3, August 1998.
[1] R. Kumaresan and A. Rao, “ Model-based approach to envelope and positive instantaneous frequency estimation of signals with speech appications, ” J. Acoust. Soc. Am. 105(3), March 1999.
[15] N. Kanedera, H. Hermansky and T. Arai, “Desired Characteristics Of Modulation Spectrum For Robust Automatic Speech Recognition, ” In the Proc. of IEEE-ICASSP, 1998.
[2] R. Kumaresan, “An Inverse signal Approach to Computing the envelope of a real valued signal, ” IEEE Signal Processing Letters, Vol. 5, No.10, October 1998.
[16] D.P.W. Ellis, R. Singh, S. Sivadas, “ Tandem acoustic modeling in large-vocabulary recognition, ” In the Proc. of ICASSP-2001, pp. I-517-520, Salt Lake City, May 2001.
[3] S. Schimmel and L. Atlas, “Coherent Envelope Detection for Modulation Filtering of Speech, ” Proc. of ICASSP 2005, Philadelphia, USA. [4] S. Sukittanon, L. Atlas, J. W. Pitton and K. Filali, “ Improved Modulation Spectrum through Multi-scale Modulation Frequency Decomposition, ” Proc. of ICASSP 2005, Philadelphia, USA.
[17] S. Haykin, “Communication Systems, ” 3rd ed., pages 79-95, John Wiley Sons, New York, 1994. [18] A. V. Oppenheim and R. W. Schafer, “ Discrete-time signal Processing, ” Prentice-Hall, Inc., 1989, Englewood Cliffs, New Jersey.
[5] H. Hermansky, “ TRAP-TANDEM: Data driven extraction of the features from speech, ” In the Proc. of IEEE ASRU 2003, St. Thomas, Virgin Islands, USA.
[19] S. Haykin, “Adaptive Filter Theory, ” Prentice-Hall Publishers, N.J., USA, 1993.
[6] Q. Zhu, B. Chen, N. Morgan and A. Stolcke, “ON using MLP features in LVCSR ” In the Proc. of ICSLP, Jeju, Korea, 2004.
[20] S. Young, J. Odell, D. Ollason, V. Valtchev, and P. Woodland, The HTK Book, Cambridge University, 1995.
[7] B. S. Atal and S. L. Hanauer, “Speech analysis and synthesis by linear Prediction of the speech wave, ” J. Acoust. Soc. of America, Vo. 50, pp.637-655, Aug. 1971.
[21] R. A. Cole, M. Fanty, and T. Lander, “Telephone speech corpus at CSLU,” Proc. of ICSLP, Yokohama, Japan, 1994.
[8] J. Makhoul, “Linear Prediction: A Tutorial Review, ” In the Proc. of IEEE, vol.63, No.4, April 1975.
16