JMLR: Workshop and Conference Proceedings 10: 64-73 The Fourth Workshop on Feature Selection in Data Mining
Feature Extraction for Outlier Detection in High-Dimensional Spaces Hoang Vu Nguyen
[email protected]
Vivekanand Gopalkrishnan
[email protected]
School of Computer Engineering Nanyang Technological University 50 Nanyang Avenue, Singapore
Editor: Huan Liu, Hiroshi Motoda, Rudy Setiono, and Zheng Zhao
Abstract This work addresses the problem of feature extraction for boosting the performance of outlier detectors in high-dimensional spaces. Recent years have observed the prominence of multidimensional data on which traditional detection techniques usually fail to work as expected due to the curse of dimensionality. This paper introduces an efficient feature extraction method which brings nontrivial improvements in detection accuracy when applied on two popular detection techniques. Experiments carried out on real datasets demonstrate the feasibility of feature extraction in outlier detection. Keywords: Feature Extraction, Dimensionality Reduction, Outlier Detection
1. Introduction Outlier detection is an important data mining task and has been widely studied in recent years (Knorr and Ng, 1998). As opposed to data clustering, where patterns representing the majority are studied, anomaly or outlier detection aims at uncovering abnormal, rare, yet interesting knowledge which may stand for important events. Popular techniques for outlier detection, especially distance-based ones (Knorr and Ng, 1998), usually compute distances of every data sample to its neighborhood to determine whether it is an outlier or not. However, as these approaches compute distances in the full feature space, they suffer the curse of dimensionality (Aggarwal and Yu, 2005). Reducing data dimensions for better learning process, especially in sparsely filled highdimensional spaces has been studied for a long time. Various solutions, ranging from principle component analysis (PCA) (Kirby and Sirovich, 1990), linear discriminant analysis (LDA) (Swets and Weng, 1996), null space LDA (NLDA) (Liu et al., 2004), etc., have been successfully proposed to address this issue for the classification task. Outlier detection itself can be regarded as a binary asymmetric/unbalanced pattern classification problem, where one class has much higher cardinality than the other, provided that some training data are available (Lazarevic and Kumar, 2005). Recently, Chawla et al. (2003) pointed out that the high imbalance in class cardinalities of asymmetric classification causes normal classification techniques to yield unsatisfactory accuracy (e.g., too complex learning rules which cause overfitting). This necessitates the development of new techniques to specifically deal with c ⃝2010 Nguyen and Gopalkrishnan.
Feature Extraction for Outlier Detection
the issue. Analogously, existing feature extraction techniques for normal classification also do not work well when applied to our problem of interest. Particularly, Chen et al. (2008) highlights that traditional techniques typically seek accurate performance over a full range of instances, and hence, tend to classify all data into the majority class. This causes the minority class, which is usually more important, to be missed out. More suitable methods, like those in (Lee and Stolfo, 2000; Wu and Banzhaf, 2010), have been proposed to address the problem. In other words, it is impractical to apply standard discriminant feature extraction approaches for outlier detection. In general, being able to reduce the number of data dimensions helps to overcome the lack of data and avoid the over-fitting issue. Recognizing this need, we present Dimensionality Reduction/Feature Extraction for OUTlier Detection (DROUT), an efficient method for feature extraction in outlier detection. In brief, DROUT first applies eigenspace regularization on a training set randomly sampled from the considered dataset. It then extracts a relevant set of features, and finally transforms the testing set where detection algorithms are applied using the features obtained. By performing eigenspace regularization, we are able to mitigate the loss of discriminant information during the feature extraction process. Furthermore, different from other techniques on feature extraction, in DROUT, eigenvalue regularization and feature extraction are performed on weight-adjusted scatter matrices (explained in Section 3) instead of normal ones. Those matrices specifically target at outlier detection where class cardinalities (normal class v/s. outlier class) are highly unbalanced. This helps DROUT to work better than existing techniques in mining anomalies. The rest of this paper is organized as follows. Related works are presented in the next section. We present the DROUT approach in Section 3. In Section 4, we apply DROUT on two existing outlier detection techniques and empirically evaluate its performance on real datasets. Finally, we conclude the paper in Section 5 with directions for future work.
2. Literature Review Linear subspace analysis for feature extraction and dimensionality reduction has been studied in depth for a long time and many methods have been proposed in the literature, including principle component analysis (PCA) (Kirby and Sirovich, 1990), linear discriminant analysis (LDA) (Swets and Weng, 1996), null space LDA (NLDA) (Liu et al., 2004) etc. Though applied very successfully for pattern classification, these methods usually miss out some discriminant information while extracting relevant features for the classification task. In particular, the eigenspace spanned by eigenvectors of the data within-class scatter matrix can be divided into three subspaces: the principal, the noise, and the null subspaces (Jiang et al., 2008). In words, the principal subspace, corresponding to eigenvectors of large eigenvalues contains the most reliable discriminant information extracted from the training data. The noise subspace, on the other hand is spanned by eigenvectors with nonzero small eigenvalues. These eigenvalues are unreliable and cause over-fitting to each specific training set. Finally, the null subspace consists of eigenvectors of zero eigenvalues. The impact of the null subspace is similar to that of the noise one. Feature extraction methods typically: (a) solve the eigenvalue problem to obtain a set of eigenvectors and corresponding eigenvalues, and (b) discard the unreliable dimensions with small eigenvalues and keep the rest 65
Nguyen and Gopalkrishnan
for performing the classification task. The noise and null subspaces are caused by noise and mainly by the insufficient training data. As new data are added to the training set or as the training set is replaced by a different one, small or zero eigenvalues can be easily changed, i.e., zero eigenvalues become nonzero and small ones become larger. Therefore, simply getting rid of them in the early stage may cause loss of discriminant information. This is especially true in the case of outlier detection because: (a) outliers are rare and hard to collect, (b) selecting subspaces for outlier detection is a complex problem (Aggarwal and Yu, 2005). The second factor implies that outliers may be present in only some lower-dimensional projections of data. Thus, accidentally rejecting some dimensions just for the sake of easy computation may lead to some loss of knowledge. Motivated by the issue, Jiang et al. (2008) proposes ERE, a dimensionality reduction method that first regularizes all three subspaces of the data within-class scatter matrix, and then extracts discriminant features on the transformed total scatter matrix. The merit of ERE lies in the fact that no dimensionality reduction is done during the regularization phase, i.e. discriminant information is likely preserved. Current solutions for feature extraction (including ERE) are unsuitable for binary asymmetric classification, because they rely on the usual within-class scatter matrix that after being processed by solving the eigenvalue problem, usually leads to rejection of reliable features. To overcome this issue, (Jiang, 2009) suggest to adjust the weights of class conditional covariance matrices. However, their proposed approach (APCDA) extracts discriminant features after applying PCA on the adjusted total scatter matrix. According to our aforementioned discussion, this will cause loss of discriminant features.
3. The DROUT Approach Our approach aims to overcome the weaknesses of the ERE and APCDA approaches. Similar to APCDA, our DROUT approach performs eigenspace decomposition as well as feature extraction on the weight-adjusted scatter matrices. But in order to preserve the discriminant information till the feature extraction phase, DROUT applies the strategy of ERE, and does not discard any feature during the eigenspace regularization process. Thus, our approach can take advantage of both ERE and APCDA to overcome the curse of dimensionality in outlier detection. In DROUT, the selected set of features is not a subset of the initial set of attributes, but is extracted from a transformation of the original data space (vector space). In order for DROUT to work, we make the following assumptions. First, a training set containing both normal data and a small amount of outliers is available. We further assume that training and testing sets have similar structures, allowing features extracted from the training set to be applicable on the testing set. While the latter assumption is widely used in almost all works on dimensionality reduction (Liu et al., 2004), the former appears frequently in works on anomaly detection (Lazarevic and Kumar, 2005). The training set in our assumption consists of two classes: the normal class ωm and the anomaly class ωa . The class ωm contains Nm points with class-conditional mean vector µm and covariance matrix Σm . Analogously, Na , µa , and Σa are the support, class-conditional mean vector, and covariance matrix of ωa . Each data point p is expressed as a column vector of d dimensions, i.e., p ∈ Rd . Let Nt = Nm + Na be the training set’s total cardinality and 66
Feature Extraction for Outlier Detection
Algorithm 1: ExtractFeatures Input: DSt : the training set, ξm and ξa : the adjusted weights, b: the number of extracted features Output: AT : the transformation matrix 1 Compute Σm , Σa , and Σb from DSt ξ 2 Set Σw = ξm Σm + ξa Σa ˜ d based on Σξw and (2) 3 Compute Φ w,ξ ˜ξ 4 Compute Σ t b in (3) by solving the eigenvalue problem on Σ ˜ ˜ξ Compute Φ 5 t t,ξ b d Φ ˜ ˜ Set A = Φ 6 T w,ξ
t,ξ
µt be the mean vector of all training data. The within-class, between-class, and total a scatter matrices of the training set are defined as: (a) Σw = NNmt Σm + N Nt Σa , (b) Σb = Nm Na Nm Na T T Nt (µm − µt )(µm − µt ) + Nt (µa − µt )(µa − µt ) , (c) Σt = Σw + Σb = Nt Σm + Nt Σa + Σb , respectively. In order to overcome the limitations of existing techniques as well as to better align DROUT towards outlier detection, we propose to apply eigenspace decomposition and regularization as in ERE on weight-adjusted scatter matrices instead of the usual ones. The details are summarized in Algorithm 1 and explained in the remaining of this section. 3.1 Weight-Adjusted Within-Class Scatter Matrix While computing the within-class scatter matrix, Σm and Σa are weighted by Nm and Na , respectively, which are required by PCA for minimizing the least-mean-square reconstruction error (M¨ uller et al., 2001). Since normal data abound while outliers are very rare and hard to collect, the ratio Nm /Na is typically very large and Σa is far less reliable than Σm . APCDA demonstrates that this weight imbalance causes some of the small eigenvalues of Σm to be unexpectedly less than some unreliable small values of Σa though their corresponding eigenvectors are more reliable. To overcome this issue, the less reliable covariance matrix, i.e., Σa , must be given higher weight (Jiang, 2009). The within-class scatter matrix is subsequently rewritten as Σξw = ξm Σm + ξa Σa , where ξm and ξa are the adjusted weights of Σm and Σa , respectively. They are uncorrelated to class prior probabilities of the training set and ξm + ξa = 1, ξm < ξa . The total scatter matrix now becomes: Σξt = ξm Σm + ξa Σa + Σb
(1)
By using Σξw and Σξt for feature extraction, APCDA is able to achieve a better result for the asymmetric classification task. This motivates us to apply the same heuristic in DROUT since it also targets at the same issue. 3.2 Subspace Decomposition and Feature Extraction One would expect to extract features that minimize the within-class and maximize the between-class variances. Since the within-class variances are estimated from limited training data, the small variances estimated tend to be unstable and cause over-fitting. Hence, 67
Nguyen and Gopalkrishnan
similar to ERE, we first proceed with regularizing the three subspaces spanned by eigenvectors of the adjusted within-class scatter matrix Σξw . Subspace identification: By solving the eigenvalue problem for Σξw , we obtain its d w,ξ w,ξ w,ξ eigenvectors {ϕw,ξ ≥ λw,ξ ≥ . . . ≥ λw,ξ 1 , ϕ2 , . . . , ϕd } with corresponding eigenvalues λ1 2 d . The set of eigenvectors is then divided into three subsets (corresponding to three subw,ξ w,ξ w,ξ w,ξ w,ξ w,ξ w,ξ w,ξ spaces): {ϕw,ξ 1 , ϕ2 , . . . , ϕm }, {ϕm+1 , ϕm+2 , . . . , ϕr }, and {ϕr+1 , ϕr+2 , . . . , ϕd } where r = max{i|1 ≤ i ≤ d ∧ λw,ξ ̸= 0} and m is the index of the least eigenvalue in the principal i subspace. While the identification of r is straightforward, finding the value of m is slightly complex. More specifically, to determine the starting point of the noise dominant region m + 1, the w,ξ point near the center of the noise region is identified by: λw,ξ med = mediani≤r {λi }. The w,ξ w,ξ distance between λw,ξ med and the smallest nonzero eigenvalue is dm,r = λmed − λr . The w,ξ upper bound of the unreliable eigenvalues is estimated by λmed + dm,r . The value of m is w,ξ w,ξ w,ξ subsequently defined as: λw,ξ < 2λw,ξ m+1 = maxi≤r {λi |λi med − λr }. Subspace Regularization: Based on ERE, the three subspaces spanned by eigenvec˜ w,ξ = λw,ξ , (b) if tors of Σξw are regularized as follows (Jiang et al., 2008): (a) if i ≤ m: λ i i w,ξ λw,ξ w,ξ w,ξ α α 1 λm (m−1) ˜ ˜ , and m < i ≤ r: λ = , and (c) if r < i ≤ d: λ = , where α = w,ξ w,ξ i
β=
i
i+β
r+1+β
w,ξ mλw,ξ m −λ1 w,ξ . −λ λw,ξ m 1
λ1
−λm
Let us denote: d ˜ d = [˜ Φ ωiw,ξ ϕw,ξ w,ξ i ]i=1
(2)
√ ˜ w,ξ , and λ ˜ w,ξ is the resulting regularized eigenvalue. In words, Φ ˜ d is where = 1/ λ i i w,ξ the full-dimensional intermediate transformation matrix, meaning it is used to transform the original data space to another feature space without doing any dimensionality reduction. Specifically, an arbitrary data point p of the original training data vector is transformed to ˜ d )T p. p˜ = (Φ w,ξ The weight-adjusted regularized total scatter matrix formed by the transformed training ˜ ξ (computed based on (1)). By solving the eigenvalue problem for Σ ˜ ξ , we set is denoted as Σ t t ˜t,ξ , . . . , ϕ˜t,ξ } with corresponding eigenvalues λ ˜ t,ξ ≥ λ ˜ t,ξ ≥ obtain its d eigenvectors {ϕ˜t,ξ , ϕ 1 2 1 2 d ˜ t,ξ . Dimensionality reduction is carried out here by extracting the first b eigenvectors ... ≥ λ d with largest eigenvalues: ˜ b = [ϕ˜t,ξ ]b Φ (3) t,ξ i i=1 ω ˜ iw,ξ
Note that discriminant feature extraction is only done after eigenvectors of the adjusted within-class scatter matrix are regularized and no eigenvector is discarded before that. Hence, according to ERE, the discriminant capability of data is likely preserved. The final ˜b ˜d Φ transformation matrix AT = Φ w,ξ t,ξ is used for converting the d-dimensional testing set to the b-dimensional feature space (with b < d), and hence, reduces the data dimensionality. 3.3 Discussions Though ERE is shown to be effective in extracting discriminative features for general classification task, it works directly on usual scatter matrices. According to APCDA, this 68
Feature Extraction for Outlier Detection
is irrelevant for asymmetric classification. In particular, the less reliable covariance matrix corresponding to the rare class (i.e., the class of anomalies) must be assigned higher weight. Though APCDA adjusts the scatter matrices for the feature extraction task, it starts extracting features at the eigenvalue regularization stage, which causes a loss in discriminant power (Jiang et al., 2008). The topic of dimensionality reduction for asymmetric classification is also explored in (Lindgren and Sp˚ ang´eus, 2004). Their technique, ACP, measures the spread of class ωa with respect to ωm ’s mean rather than to that of ωa itself. It then solves the following generalized eigenvalue problem to extract discriminant features: ˜ a D = Σm DΛ, where (a) Σ ˜ a is the modified version of Σa , (b) Λ, DT Σm D, and DT Σa D are Σ diagonal. However, ACP neither considers the issue of imbalanced class cardinalities, nor the importance of the noise and null subspaces. As a consequence, ACP does not perform well for outlier detection (c.f., empirical evaluation in Section 4). Combining the findings in both ERE and APCDA, we perform eigenspace decomposition and feature extraction on the weight-adjusted scatter matrices. The weights assigned here are unrelated to the class prior probabilities. This allows us to benefit from both feature extraction techniques for overcoming the curse of dimensionality in outlier detection. APCDA suggests to set ξm = 0.2 and ξa = 0.8. However, in outlier detection, the number of normal data points are expected to be much larger than anomalies. Hence we propose to use ξm = 0.1 and ξa = 0.9 with asymmetric ratio ξa /ξm = 9. In other words, we expect outliers to occupy only up to 10% of the total dataset’s size. This agrees with many previous studies (Angiulli and Fassetti, 2009; Lazarevic and Kumar, 2005). In this paper as well as in other these works, the number of outliers in an arbitrary dataset is assumed to be much less than 10% of the dataset’s cardinality (e.g., 1% or 5%). Nonetheless, we find that setting the asymmetric ratio to 9 is good enough for practical applications, though a good performance is achieved even with larger values. The runtime cost of DROUT is O(Nt d·min(Nt , d)), which is comparable to other feature extraction techniques (Swets and Weng, 1996). However, since DROUT is only performed once on a small training set, this time complexity is not that important. Instead, the runtime overhead of the testing phase which is executed on a much larger dataset is of our great interest. Note that running detection methods on a transformed testing set will cost less time than on a full-dimensional one since their runtime overheads are proportional to the number of dimensions (Angiulli and Fassetti, 2009).
4. Outlier Detection with DROUT In this section, we demonstrate the benefit of applying DROUT on two popular outlier detection techniques, through experiments on real datasets. 4.1 Detection Techniques ORCA: In the field of distance-based outlier detection, ORCA (Bay and Schwabacher, 2003) is one of the most popular methods due to its high efficiency in terms of time complexity and accuracy. In ORCA, we aim to detect top n outliers whose total distances to their respective k nearest neighbors are largest. Since its outlier definition is based on the notion of nearest neighbors, and we know that nearest and farthest neighbors are roughly the same in such spaces (Aggarwal and Yu, 2005), ORCA suffers the curse of dimensionality 69
Nguyen and Gopalkrishnan
(i.e. its accuracy is reduced in high-dimensional spaces). BSOUT: Kollios et al. (2003) introduces Biased Sampling OUTlier Detection (BSOUT) which aims to flag outliers whose total numbers of neighbors within radius R (called Rneighborhood) are less than a threshold P . In BSOUT, each data point p’s local density is first estimated using a nonparametric kernel density estimator. Its R-neighborhood’s cardinality is then approximated based on the calculated density. If this amount falls below P , it is placed in the candidate set which will be refined later to obtain true outliers. Similar to ORCA, the performance of BSOUT also degrades in high-dimensional data because of two reasons. While the first reason is analogous to ORCA’s, the second one stems from the fact that BSOUT utilizes nonparametric density estimation, and it is known that estimation accuracy downgrades greatly in such data (M¨ uller et al., 2001). 4.2 Experiment Setup Testing Procedure: We evaluate the performance of DROUT, ERE, APCDA, and ACP (Lindgren and Sp˚ ang´eus, 2004) when applying to ORCA and BSOUT. The detection accuracy here is measured as the area under the ROC curve, called AUC, which is widely used to assess outlier detectors. We compare the performance of ORCA and BSOUT on the original set of attributes, against ORCA on the new feature set obtained by applying each of the dimensionality reduction techniques. In order to use AUC as the evaluation metric, we employ real datasets that can be converted to the binary classification problem. This setup procedure has been successfully used for studying outlier detection (Lazarevic and Kumar, 2005). Benchmark Datasets: The first dataset is extracted from the KDD Cup 1999 one following the method introduced in (Lazarevic and Kumar, 2005). Particularly, the smallest intrusion class, U2R, consisting of 246 data points is selected as the outlier class ωa . This class contains a variety types of attacks like ftp write, imap, multihop, nmap, phf, pod, and teardrop. The total dataset hence includes the normal class ωm of 60593 data records and 246 outliers in d-dimensional space with d = 34 (we have excluded the 7 categorical attributes from the total of 41 attributes). The second dataset, Ann-Thyroid, is taken from the UCI Machine Learning Repository. It contains 3428 records in 21-dimensional space. The largest class (class 3) is selected as the normal class ωm , and we generate two test sets: Ann-Thyroid 1 (ωa is class 1), and Ann-Thyroid 2 (ωa is class 2). The maximum dataset dimensionality in our experiment is 34 which is similar to that of (Aggarwal and Yu, 2005). 4.3 Results With the KDD dataset, we randomly sample 50 records from ωa and 1000 records from ωm for training, and keep the remaining 59789 records for testing. For the Ann-Thyroid dataset, we randomly select 50 records from ωa and 450 records from ωm for training, and keep the remaining (2751 records for Ann-Thyroid 1, and 2855 for Ann-Thyroid 2) for testing. Notice that the asymmetric ratio is 20 and 9 for the KDD and Ann-Thyroid datasets, respectively. This means our approach’s performance is also assessed in the case the asymmetric ratio is not exactly 9. 70
1
1
0.9
0.9
0.8
0.8
0.8
0.7 ORCA APCDA ACP ERE DROUT
0.6 0.5 0.4 1 2
4
6
8
10
12
14
16 17
Number of Extracted Features (b)
(a) KDD Cup 1999
0.7 ORCA APCDA ACP ERE DROUT
0.6 0.5 0.4 1
2
4
6
8
Number of Extracted Features (b)
(b) Ann-Thyroid 1
10
AUC
1 0.9
AUC
AUC
Feature Extraction for Outlier Detection
0.7 ORCA APCDA ACP ERE DROUT
0.6 0.5 0.4 1
2
4
6
8
10
Number of Extracted Features (b)
(c) Ann-Thyroid 2
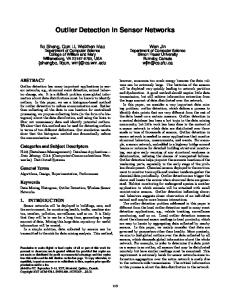
Figure 1: Effect of feature extraction techniques on accuracy of ORCA. For ORCA, the number of nearest neighbors k is varied in the range 0.02%N ≤ k ≤ 0.1%N with N being the underlying dataset’s size, while n is chosen to be 0.05%N . With BSOUT, P is also varied from 0.02%N to 0.1%N and R is chosen such that the number of outliers flagged using the algorithm in (Knorr and Ng, 1998) is exactly 0.05%N . These parameter settings follow the proposal in previous work (Angiulli and Fassetti, 2009). For each value of b (number of extracted features) tested (b ≤ ⌊d/2⌋), we construct the training set using random split described above for five times. The resultant average AUCs and their respective standard deviations are computed. Since the values of standard deviations are negligible, we do not present them in our results. Dimensionality Reduction on ORCA: Figure 1 describes how the AUC values of ORCA using different dimensionality reduction methods change as b increases. Notice that the performance of the original ORCA is unrelated to b. With small values of b, ORCA with feature extraction performs worse than the original ORCA. This is because by using insufficient number of features, discriminant information is likely lost even though the extraction process has been carefully designed to preserve it. However, for higher values of b, feature extraction starts producing better accuracy. The performance of APCDA is slightly better than ERE in general while ACP loses out in all test cases. On the other hand, DROUT achieves the best accuracy and highest gain in detection quality attributed to the fact that it performs dimensionality reduction on the adjusted scatter matrices and no feature rejection is carried out during the eigenspace regularization process. Overall, increasing b does not ensure a better detection accuracy for methods utilizing feature extraction. This is reflected by a slight reduction and then relative stabilization of the AUC curves. The outcomes suggest that b should not be too large (e.g., b ≤ ⌊d/2⌋), otherwise the curse of dimensionality will happen again on the new feature space. Dimensionality Reduction on BSOUT: From Figure 2, it can be seen that with BSOUT, the performance gain by applying feature extraction is even more pronounced. This is because, as compared to ORCA, BSOUT has one more factor causing its accuracy to downgrade in high-dimensional spaces: the nonparametric kernel density estimation. Therefore, reducing dimensions in BSOUT brings two benefits, it: (a) makes the notion of nearest neighbors more meaningful, and (b) improves the accuracy of estimating data local densities. Among the feature extraction techniques utilized, DROUT once again yields the 71
1
1
0.9
0.9
0.8
0.8
0.8
0.7 BSOUT APCDA ACP ERE DROUT
0.6 0.5 0.4 1 2
4
6
8
10
12
14
16 17
Number of Extracted Features (b)
(a) KDD Cup 1999
0.7 BSOUT APCDA ACP ERE DROUT
0.6 0.5 0.4 1
2
4
6
8
Number of Extracted Features (b)
(b) Ann-Thyroid 1
10
AUC
1 0.9
AUC
AUC
Nguyen and Gopalkrishnan
0.7 BSOUT APCDA ACP ERE DROUT
0.6 0.5 0.4 1
2
4
6
8
10
Number of Extracted Features (b)
(c) Ann-Thyroid 2
Figure 2: Effect of feature extraction techniques on accuracy of BSOUT. best accuracy. In addition, since ACP fails to preserve discriminant information, it suffers the worst performance. APCDA on the other hand slightly outperforms ERE. As b keeps increasing and exceeds a threshold, the accuracies of techniques based on feature extraction tend to first decrease and then become stable. These findings agree with the results obtained from the experiment on ORCA.
5. Conclusions This paper explored the application of feature extraction on outlier detection research and proposed a novel method (DROUT) to accomplish the task. In brief, DROUT operates in two phases: eigenspace regularization and discriminant feature extraction. During the first phase, DROUT decomposes the data eigenspace into three components (the principal, the noise, and the null subspaces) where different regularization policies are applied and no subspace is discarded. This helps DROUT to preserve the discriminant information in the data before entering the actual feature extraction process. In the second phase, discriminant features are obtained from the regularized eigenspace by solving the traditional eigenvalue problem on the regularized total scatter matrix. One additional advantage of our method is that both of its phases are carried out on the weight-adjusted scatter matrices which makes DROUT better tuned to outlier detection than other existing techniques. Though the idea of doing feature extraction to improve the performance of outlier detectors in high-dimensional spaces is rejected by the subspace mining community (Aggarwal and Yu, 2005), empirical studies of DROUT applied to ORCA and BSOUT (two outstanding anomaly detectors) verify that DROUT (and hence, feature extraction methods) is able to bring nontrivial accuracy gain for detection methods. As future work, we are considering to extend our analysis on more large and high-dimensional datasets to better study the full benefits of DROUT. We are also carefully examining other possibilities of dimensionality reduction for outlier detection apart from our proposed technique. This will help us to better choose suitable ways for dealing with the curse of dimensionality.
References Charu C. Aggarwal and Philip S. Yu. An effective and efficient algorithm for highdimensional outlier detection. VLDB J., 14(2):211–221, 2005. 72
Feature Extraction for Outlier Detection
Fabrizio Angiulli and Fabio Fassetti. Dolphin: An efficient algorithm for mining distancebased outliers in very large datasets. TKDD, 3(1), 2009. Stephen D. Bay and Mark Schwabacher. Mining distance-based outliers in near linear time with randomization and a simple pruning rule. In KDD, pages 29–38, 2003. Nitesh V. Chawla, Aleksandar Lazarevic, Lawrence O. Hall, and Kevin W. Bowyer. SMOTEBoost: Improving prediction of the minority class in boosting. In PKDD, pages 107–119, 2003. Mu-Chen Chen, Long-Sheng Chen, Chun-Chin Hsu, and Wei-Rong Zeng. An information granulation based data mining approach for classifying imbalanced data. Inf. Sci., 178 (16):3214–3227, 2008. Xudong Jiang. Asymmetric principal component and discriminant analyses for pattern classification. IEEE Trans. Pattern Anal. Mach. Intell., 31(5), 2009. Xudong Jiang, Bappaditya Mandal, and Alex ChiChung Kot. Eigenfeature regularization and extraction in face recognition. IEEE Trans. Pattern Anal. Mach. Intell., 30(3):383– 394, 2008. M. Kirby and L. Sirovich. Application of the karhunen-loeve procedure for the characterization of human faces. IEEE Trans. Pattern Anal. Mach. Intell., 12(1):103–108, 1990. Edwin M. Knorr and Raymond T. Ng. Algorithms for mining distance-based outliers in large datasets. In VLDB, pages 392–403, 1998. George Kollios, Dimitrios Gunopulos, Nick Koudas, and Stefan Berchtold. Efficient biased sampling for approximate clustering and outlier detection in large data sets. IEEE Trans. Knowl. Data Eng., 15(5):1170–1187, 2003. Aleksandar Lazarevic and Vipin Kumar. Feature bagging for outlier detection. In KDD, pages 157–166, 2005. Wenke Lee and Salvatore J. Stolfo. A framework for constructing features and models for intrusion detection systems. ACM Trans. Inf. Syst. Secur., 3(4):227–261, 2000. David Lindgren and Per Sp˚ ang´eus. A novel feature extraction algorithm for asymmetric classification. IEEE Sensors Journal, 4(5):643–650, 2004. Wei Liu, Yunhong Wang, Stan Z. Li, and Tieniu Tan. Null space approach of fisher discriminant analysis for face recognition. In ECCV Workshop BioAW, pages 32–44, 2004. Klaus-Robert M¨ uller, Sebastian Mika, Gunnar R¨atsch, Koji Tsuda, and Bernhard Sch¨olkopf. An introduction to kernel-based learning algorithms. IEEE Transactions on Neural Networks, 12(2):181–201, 2001. Daniel L. Swets and Juyang Weng. Using discriminant eigenfeatures for image retrieval. IEEE Trans. Pattern Anal. Mach. Intell., 18(8):831–836, 1996. Shelly Xiaonan Wu and Wolfgang Banzhaf. The use of computational intelligence in intrusion detection systems: A review. Applied Soft Computing, 10(1):1–35, 2010. 73