Fall Detection Using RF Sensor Networks Brad Mager, Neal Patwari, and Maurizio Bocca Department of Electrical and Computer Engineering University of Utah Salt Lake City, USA Abstract—The number of people aged 65 and over continues to rapidly increase, leading to a greater need for technologies to assist in caring for an aging population. Among these technologies are fall detection systems, since falling is a major concern for the elderly. In this paper we present a method of detecting falls using radio tomographic imaging. A two-level array of RF sensor nodes is deployed around the perimeter of a room, and the shadowing losses in the signals relayed between sensors is used to detect a person’s horizontal and vertical position. Training data is used to provide a relationship between the attenutation measured as a function of height and a person’s pose, which is then used in a hidden Markov model. During system operation, a forward algorithm estimates the most likely current state at each time. If the time between a standing pose and a lying down pose is too short, the system detects a fall. Using a collected experimental test set, we show that the system can distinguish falls from controlled lying down actions (e.g., sitting on the floor) with 100% reliability and no false alarms.
I.
I NTRODUCTION
Due to increases in life expectancy, the number of people aged 65 and older is expected to nearly triple in the next 35 years, reaching about 1.5 billion globally in 2050. A large concern for the elderly is that of falling. For people who live in their own homes or apartments, about 30 percent of those 65 and older fall each year. In residential care facilities, the number is higher: about half of older people fall at least once a year. Moreover, falls are the leading cause of injury-related deaths among people 65 and older [1], [2]. While the most desirable goal is to prevent falling, the next best scenario is to alert caregivers immediately if someone has fallen so that help may arrive quickly. Fall detection is largely divided into two categories: wearable sensors and environment monitoring. Proposed technology for wearable devices use accelerometers and gyroscopes to detect a person’s posture and rate of vertical motion [3], [4]. Other wearable devices require a person to push a button to call for help after falling. To be completely effective, however, these devices must be worn at all times, including when getting up at night to go to the bathroom, which is an unrealistic expectation. Of people over 90 who own an emergency callbutton system and fall, one cohort study reports that 80% do not press the button, typically because they did not wear the call button and thus it is out of reach after the fall [5]. Ideally, there would be no need for the inconvenience of having to wear (and remember to wear) a device. Instead, the environment itself would be able to detect if someone has fallen and send an alert. Work in this area includes microphone arrays, Doppler radar systems, and camera-based systems that process the image data to detect falls [6], [7], [8]. More
recently, RF-based device-free localization (RF-DFL) has been successfully employed to accurately localize a person in a domestic environment over several days [9]. This technology uses measurements of the radio signal strength to determine a person’s 2-D coordinate in the area in which the static wireless network is deployed without requiring the person to wear any device [10], [11]. One type of RF-DFL algorithm is called radio tomographic imaging (RTI), which exploits the shadowing losses experienced by links in an RF sensor network to create an image map of the locations of people and objects that have moved [12]. In experiments using RTI, an array of sensor nodes positioned in a single plane approximately one meter above the floor suffices to determine a person’s horizontal location in an environment. Such networks have been shown to locate a person with an error as low as 0.10 m [13]. The primary advantage of such a system is that the person being located does not need to carry or wear a device, which makes this technology suitable for assisted living applications. In contrast to a Doppler radar system, this technology can localize a person who is stationary and can detect motion perpendicular to the direction of radio wave propagation. This paper develops and demonstrates an RF-based devicefree system which uses three-dimensional radio tomography and state estimation methods to detect falling. An array of RF sensor nodes configured in two parallel horizontal planes is deployed in a living environment and the received signal strength (RSS) data is processed to construct a 3D image of the shadowing losses caused by the subject being in various positions and poses. A hidden Markov model is used to model which pose a person is in at each time, and a forward algorithm is used to estimate the current state. The time interval between the “standing” state and the “lying down” state is used to determine if the transition between the two states occurs quickly enough to indicate that a potentially dangerous fall has happened. A test data set collected via experiment in an uncluttered room achieved 100% reliability in fall detection with no false alarms, demonstrating that RTI is a promising technology to employ in detecting falls. The applicability of our system to larger and cluttered domestic environments will require more advanced methods that are left to future work. II.
M ETHODS
We assume a network of N RF sensor nodes is deployed in an indoor area to be monitored for falls. We denote the coordinate of sensor n as zn ∈ R3 , where the sensors are on one of two parallel planes at different heights. We assume that any pair of nodes can communicate, and each link is denoted
by l = (txl , rxl ), where txl ∈ {1, . . . , N } is the transmitting node and rxl ∈ {1, . . . , N } is the receiving node. We collect data about the RSS of each link on each of C channels, where rl,c is the RSS value in dB for link l on channel c. In general, a person crossing the line between nodes na and nb will change the RSS of the link l due to the shadowing of the line-of-sight path. In multipath environments the received signal is a phasor sum of multipath components, and the shadowing of any one path may either decrease or increase the phasor sum that determines the RSS. By measuring on multiple channels, we increase our chances of finding one channel in an anti-fade condition [14], which tends to decrease in signal strength only when a person blocks the line-of-sight path [13]. We follow the procedure in [13] to estimate “link attenuation” on link l, that is, yl . This procedure can be briefly described as follows. We first compute the transmit-power normalized version of RSS (by correcting for differences in transmit power as a function of channel c). Then we compute the change in transmit-power normalized RSS compared to a reference time (when no one was in the area), which is denoted ∆rl,c . Finally, we set yl to be the average change in link attenuation in the m < C channels with the highest average transmit-power normalized RSS [13]. We model the vector of link attenuation, y = [y1 , . . . , yL ]T , as y = Wx + n
(1)
T
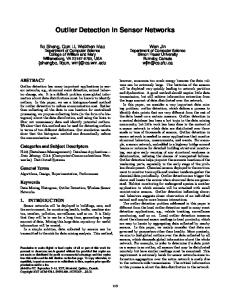
where x = [x1 , . . . , xJ ] and xj is the attenuation in the jth voxel (of which there are J arranged in a grid), W is a weight matrix for which Wlj describes the impact of voxel j’s attenuation on link l, and n = [n1 , . . . , nL ]T is the noise vector [12]. We denote the center coordinate of voxel j as vj , which in general, is in R3 . Note that Wlj is a function of the coordinates of the transmitter and receiver of link l, that is, ztxl and zrxl , and the voxel coordinate vj . We use the ellipse model in [13]. In RTI, we measure y and estimate x, using a regularization method to ensure a solution [15]. We refer to the image estimate as x ˆ, and we use the regularized P least-squares approach 2 described in [13]. We define g(x) = i xi to describe the “image intensity” of image x. A. Dual-Level RTI To detect falling, our system requires data about a person’s pose, accomplished by deploying the sensor network in two levels, as in Fig. 1(a). The human torso causes more attenuation than the ankles, so when a person is standing, we expect more attenuation on links between nodes in the upper layer and less in the lower layer. In contrast, a person lying on the floor causes more shadowing on the lower layer and very little on the upper layer. A simple means to determine if someone is standing is to process the data as two separate layers of 2-D RTI images corresponding to the two levels of nodes. We define two sets of sensors, where Lu and Ll indicate links between sensors in the upper and lower sets, respectively. In dual-level RTI we separate measurements: we consider {rl,c } for all links l ∈ L2u to be “upper layer link measurements”, and the set {rl,c [k]} for all links l ∈ L2l to be “lower layer link measurements”.
We use the upper layer link measurements to generate the upper layer image that we denote x ˆu , and the lower layer link measurements to generate the lower layer image x ˆl . In dual-level RTI, the images are formed using 2-D pixel and node coordinates, as is done in published work in RTI [15], [16], [13]. In other words, two sets of data are processed separately to generate two separate images corresponding to the attenuation measured on two levels, and measurements on links between one upper layer node and one lower layer node, or vice versa, are ignored. From each image, we calculate the image intensities gu = g(ˆ xu ) and gl = g(ˆ xl ). A fall is indicated when gl shows a rapid increase ∆g over time ∆k, while gu shows a decrease. Experimental results for this configuration are shown in III. B. 3-D RTI The potential limitation with the dual-level RTI approach is it ignores data from the diagonal cross links in the network, which might provide additional information about a person’s vertical position. The alternative method we propose is to create a full 3-D RTI image by taking into account all the links in the network, where nodes and voxels have three-dimensional coordinates zn and vj , respectively. In 3-D RTI, we continue to use the weight model of [13], with the modification that the weight on link l is zero for any pixel j outside of the (3D) ellipsoid with ztxl and zrxl as foci, rather than simply the (2-D) ellipse. From the RTI estimate x ˆ, which contains the attenuation in each voxel in the 3-D grid, we view the output as H separate horizontal layers, denoting the hth horizontal layer of the 3D RTI estimate as x ˆ(h) . The orientation of a human body within an RF sensor network can now be determined with greater precision by considering the total attenuation on each of the H layers, achieved by summing up the attenuation values for all the voxels on each layer. This provides a 1xH vector g of normalized values, where g0 (k) represents the bottom layer and gH−1 (k) represents the top layer at each time k. C. Hidden Markov Model We assume that a person present in the environment may be in one of three vertical positions in a discrete set of poses S. These positions, which can be thought of as a person’s vertical state, are: 1,“lying down,” which corresponds to the subject lying on the floor; 2,“mid-position,” which includes lying on a bed, sitting in a chair, bending over, or crouching down; and 3, “standing,” which corresponds to a person either standing still or walking around the environment. Thus, S = {1, 2, 3}. To detect falls, we are primarily concerned with a person’s motion between the standing and lying down states. We include the mid-position state because people spend a large fraction of their time sitting. Not having such a state would force the estimation algorithm to choose between standing or lying down, which would often result in error. In addition, the midposition state provides a transitional state between standing and lying down, and thus provides a means to distinguish falls from purposeful, slow transitions to lying down.
where β is a shape parameter, µs is the mean of g given a person is in state s, and Cg is the covariance matrix for vector g. A shape parameter of β = 1 results in a Gaussian distribution, while 0 < β < 1 results in heavier tails than the Gaussian distribution. The GGD with β < 1, as opposed to the Gaussian distribution, allows more flexibility to account for the wide variability observed in g with different people, and with different heights. Further, the HMM assumes that transitions represent a Markov chain, that is, future states are independent of the past state given the present state. We assign a transition probability matrix P that is assumed known a priori, where Pij is the one-step probability of transition from state i to state j. We then use the forward algorithm to determine the probability pi [k] a person being in state i at time k, for each of the three states and each time k [18]. We choose the maximum a posteriori estimate, that is, the state with maximum probability, sˆ[k] = arg maxi pi [k]. D. Detection In general, we would like to know how quickly a person transitions from one state to another. In this paper, we define a fall as the transition between standing up and lying on the floor, where the transition is shorter than a certain threshold time, δ. We incorporate an extra degree of reliability by first ensuring the person was in a “standing” state before a “lying down” state was detected. At any time k, the system determines that the person is standing with a high degree of certainty if p3 (k) is greater than 1 − �, where � is a small positive value. This helps avoid errors due to noise, and helps distinguish states in transition, such as during a slower downward motion correlating with lying down, when p3 (k) is the maximum of the three states by a small margin just before a transition to s2 and then s1 , which could occur within time δ. We define k3 as the most recent time k when p3 [k] > 1−�, indicating standing, and k1 as the first time k > k3 when sˆ[k] = 1, indicating lying down. The system detects a fall when k1 − k3 ≤ δ. III.
E XPERIMENTS
A two-level network of 24 RF sensor nodes was set up in a living room in a 3.0 m x 3.0 m arrangement shown in Fig. 1(b), such that the sensor nodes on the lower level were placed 17 cm from the floor and those on the upper level were placed directly above at a height of 140 cm (the height is taken as the position of the node’s antenna). This places the top level
a
3
y coordinate [m]
The model is a “hidden Markov model” (HMM) because the true position state cannot be observed directly, and instead attenuation per level data is used as a noisy observation that differs by state. To be specific, we must specify the distribution of the measurement g conditioned on the true state s, that is, f (g|s). In this paper, we model the measurement vector g as having a multivariate generalized Gaussian distribution (GGD) [17]. This model says that, given that the person is in state s ∈ S, � � �β 1� T −1 f (g|s) ∝ exp − (g − µs ) Cg (g − µs ) (2) 2
c d
2
1
0
(a)
b
(b)
0
1 2 x coordinate [m]
3
Fig. 1. Nodes are deployed in two levels at locations of • in (b). In (a), dual-level RTI only uses links a and b, while 3-D RTI also includes links c and d.
of nodes at a height near the upper part of the torso for most people in the U.S. [19]. The sensor nodes are USB dongle nodes, which use a Texas Instruments CC2531 System-on-Chip with an IEEE 802.15.4 compliant radio operating in the 2.4 GHz band [20]. The nodes transmit their measured data to a base-station node which forwards the data to a laptop for processing and storage. We use a TDMA protocol and channel-switching scheme as described in [21]. Each transmission takes approximately 3.1 ms, so in an experiment employing 24 nodes the total cycle length is 74 ms, allowing for 3.4 measurements per second over four channels. We conducted a series of experiments 40–55 s in duration in which a subject entered the network and performed various pre-arranged motions, which included walking, sitting on the floor, bending down, sitting in a chair, lying down, and two types of falling motion to mimic tripping and crumpling to the floor. Two subjects participated in the experiment and each set of nine different motions was performed three times, for a total of 54 experiments. A thick foam pad on the floor helped to cushion the subject’s fall, allowing for a realistic falling motion that occurred within about one second. The timing of all the movements was determined beforehand so that the data could later be compared to the actual timing of the motions. These experiments only involved scenarios where the subject stands still and falls, or walks at about 0.5 m/s and falls. We did not test a range of walking speeds or falling while running. IV.
R ESULTS
We process the data from the 54 experiments described in Section III. When we process the data using dual-level RTI as described in Section II-A, an upper and lower image are generated. We define the image intensity g, which we use to approximate a person’s vertical position. When a person is standing, the average image intensity for each layer will remain constant, but as the person lies down or falls, the value for the lower layer will increase, while that for the upper layer will decrease. However, this system cannot adequately distinguish between “lying down” and being in several of the “mid positions,” which is necessary for detecting falling. The three pairs of RTI images in Fig. 2 illustrate the difficulty here. In Fig. 2(a) the person is standing up and the top layer shows
2
2
2
1
1
1
0
0
0 1
2
3
0
3
3
3
2
2
2
1
1
0 1
2
3
2
(a)
1
2
3
0
(b)
1
2
Fig. 2. Dual-level RTI estimates for (a) standing, (b) mid-position, and (c) lying down poses. Red is highest attenuation, and blue is lowest. Coordinates are in meters. From Pose: Lying Down Mid-Position Standing
TABLE I.
Lying Down 0.99900 0.00050 0.00005
To Pose: Mid-Position 0.00095 0.99900 0.00095
3
2
2
2
1
1
1
0
0
Standing 0.00005 0.00050 0.99900
Processing the data using 3-D RTI and viewing the output as five layers, as described in Section II-B, yields the additional information needed for fall detection, as seen in the RTI images in Fig. 3. Each of the three sets, shown in Fig. 3 (a), (b), and (c), shows the same position for the corresponding duallevel images, captured at the same time during the experiment. Here, we can clearly distinguish the differences between standing, mid-position, and lying down, suggesting that 3-D RTI provides the information necessary for our system.
2
3
0 0
1
2
3
3
3
2
2
2
1
1
1
0
0 0
1
2
1
2
3
3
3
2
2
2
1
1
1
0
0 0
1
2
1
2
3
3
3
3
2
2
2
1
1
1
0
0 0
1
2
1
2
3
3
3
3
2
2
2
1
1
1
0
0 0
1
2
(a)
3
2
3
0
1
2
3
0
1
2
3
0
1
2
3
0
1
2
3
0 0
3
1
0 0
3
0
0 0
3
3
T RANSITION PROBABILITY MATRIX
a larger image intensity than the bottom layer, since a person’s torso causes more attenuation in the RF links than the ankles. In Fig. 2(c) the person is lying down, indicated by the greater amount of attenuation in the bottom layer. However, there is significant overlap between these images and the data from the “mid position” (here, crouching down) case, which is shown in Fig. 2(b). For this reason, the dual-level RTI approach proved inadequate, yielding an unacceptable number of false positives.
1
3
3
(c)
Lying Down
3
0
0 0
Mid Position
3
3
1
0 0
1
Layer 4
0
Layer 3
3
Layer 2
2
Layer 5
3
1
Standing
Lying Down
3
0
Bottom Layer
Mid Position
Layer 1
Top Layer
Standing 3
0 0
1
2
(b)
3
(c)
Fig. 3. Five-layers of RTI estimates when using 3D RTI for (a) standing, (b) mid-position, and (c) lying down poses. Red is highest attenuation, and blue is lowest. Coordinates are in meters.
incorrectly determines that the person is lying down, perhaps due to noise, and this state occurs within the specified δ after a state of standing is detected; or 2) The system correctly determines that the person is lying down after a state of standing was detected, but δ was set too long, so that even a controlled action of lying down appears as a fall.
To generate the covariance matrix Cg and conditional means µs for s = {1, 2, 3} needed in f (g|s) as described in (2), we first gather training data representing the three states in the model. For the results shown in this paper, we used data from one subject’s set of experiments as a training set to generate the model, then used the data from the second subject as the test set. We use a value of β = 0.4 in (2).
We expect that when δ is set too low we will not detect any falls, because a person cannot make the transition between standing and lying down quickly enough. In contrast, when δ is set too large the system will indicate false positives, though it will correctly detect all the actual falls. To find the optimal value of δ, we adjust its value between two extremes while processing the data for all the tests, providing us with the rates of error for the different values. Fig. 4 shows the error rate for a range of δ values for the number of falls not detected and the number of false positives. Note that this chart includes only the experiments in which the subject sat on the floor, lay down, or fell—that is, those in which the person went from a “standing” state to a “lying down” state (here, our model considers sitting on the floor equivalent to lying down). Experiments in which the person only went into a “mid-position” pose are of less interest, as they offer no direct comparison between falling and lying down. In addition, these “mid-position” experiments indicated no false positives regarding falls.
We then run the forward algorithm and the fall detection algorithm as described in Section II-D. In general, the system can indicate a false positive in two ways: 1) The Markov model
With this set of data, we find a range for δ between 1.26 s and 2.15 s in which the system achieves optimal results. We caution that this 100% reliabililty rate is for a limited
The transition probability matrix, Pij , which contains the probabilities of going from state i to state j, is created based on an estimate of how often people change state. Typically, transitions happen with low probability because we infrequently change between sitting, standing, and lying down during an average day. Thus Pij for i 6= j are typically low. Table I shows the transition probability matrix used in the HMM for these experiments. Future work will adapt this matrix based on observed data, e.g., using the Baum-Welch algorithm.
100
Missed detection False positive
Error (%)
80
60
40
20
0 0
0.5
1
1.5
δ (s)
2
2.5
3
3.5
Fig. 4. As the value of δ increases, the number of missed detections decreases, while the number of false positives increases.
set of experiments in a single-room sensor network. However, this approach demonstrates the possibility of using 3-D RTI to detect falling, and how to optimize the system’s parameters. V.
C ONCLUSION
In this paper we present a proof-of-concept RF-based fall detection system that does not require the user to wear any device. Instead, a two-level array of RF sensor nodes is used to determine the vertical position and motion of a person inside the network, based on the RSS data measured by the nodes. A forward algorithm uses the attenuation on each layer of a 3-D RTI image to estimate the current pose of the person. The system uses the time between a state of “standing” and “lying down” to detect a fall. In experiments conducted in an uncluttered environment, the system is able to accurately detect falling without error, suggesting the viability for such a system in elder care situations. Future work will focus on adapting the system to larger, cluttered environments, with longer experiments involving a greater variety of motions. Running the experiments with more people who represent a wider range of body types will help ensure that the system can recognize falling in any type of adult. The choice of models and parameters could be further studied to further optimize performance and reliability. ACKNOWLEDGMENT We would like to thank Merrick McCracken for his help in performing the experiments. This material is based upon work supported by the U.S. National Science Foundation under Grant Nos. #0748206 and #1035565. R EFERENCES [1] C. Todd and D. Skelton, “What are the main risk factors for falls among older people and what are the most effective interventions to prevent these falls?” WHO Regional Office for Europe, Tech. Rep., 2004. [2] J. Stevens, G. Ryan, and M. Kresnow, “Fatalities and injuries from falls among older adults United States, 1993–2003 and 2001–2005,” Morbidity & Mortality Weekly Report, vol. 55, 2006.
[3] J. Dai, X. Bai, Z. Yang, Z. Shen, and D. Xuan, “PerFallID: A pervasive fall detection system using mobile phones,” in Proceedings of IEEE PerCom Workshop on Pervasive Healthcare (PerHealth), 2010. [4] Q. Li, J. A. Stankovic, M. A. Hanson, A. T. Barth, J. Lach, and G. Zhou, “Accurate, fast fall detection using gyroscopes and accelerometer-derived posture information,” in Proceedings of the 2009 Sixth International Workshop on Wearable and Implantable Body Sensor Networks, ser. BSN ’09. Washington, DC, USA: IEEE Computer Society, 2009, pp. 138–143. [Online]. Available: http://dx.doi.org/10.1109/BSN.2009.46 [5] J. Fleming and C. Brayne, “Inability to get up after falling, subsequent time on floor, and summoning help: prospective cohort study in people over 90,” British Journal of Medicine, vol. 337:a2227, Nov. 2008. [Online]. Available: http://dx.doi.org/10.1136/bmj.a2227 [6] Y. Li, K. C. Ho, and M. Popescu, “A microphone array system for automatic fall detection,” IEEE Trans. Biomed. Engineering, vol. 59, no. 5, pp. 1291–1301, 2012. [7] L. Liu, M. Popescu, M. Skubic, M. Rantz, T. Yardibi, and P. Cuddihy, “Automatic fall detection based on doppler radar motion signature,” in Pervasive Computing Technologies for Healthcare (PervasiveHealth), 2011 5th International Conference on, May 2011, pp. 222 –225. [8] D. Anderson, J. Keller, M. Skubic, X. Chen, and Z. He, “Recognizing falls from silhouettes,” in Engineering in Medicine and Biology Society, 2006. EMBS ’06. 28th Annual International Conference of the IEEE, 30 2006-sept. 3 2006, pp. 6388 –6391. [9] O. Kaltiokallio, M. Bocca, and N. Patwari, “Follow @grandma: longterm device-free localization for residential monitoring,” in 7th IEEE International Workshop on Practical Issues in Building Sensor Network Applications (SenseApp 2012), October 2012. [10] K. Woyach, D. Puccinelli, and M. Haenggi, “Sensorless sensing in wireless networks: Implementation and measurements,” in WiNMee 2006, April 2006. [11] D. Zhang, J. Ma, Q. Chen, and L. M. Ni, “An RF-based system for tracking transceiver-free objects,” in IEEE PerCom’07, 2007, pp. 135– 144. [12] J. Wilson and N. Patwari, “Radio tomographic imaging with wireless networks,” IEEE Trans. Mobile Computing, vol. 9, no. 5, pp. 621–632, May 2010, appeared online 8 January 2010. [13] O. Kaltiokallio, M. Bocca, and N. Patwari, “Enhancing the accuracy of radio tomographic imaging using channel diversity,” in 9th IEEE International Conference on Mobile Ad hoc and Sensor Systems (MASS 2012), October 2012. [14] J. Wilson and N. Patwari, “A fade level skew-Laplace signal strength model for device-free localization with wireless networks,” IEEE Trans. Mobile Computing, vol. 11, no. 6, pp. 947–958, June 2012, appeared online 12 May 2011. [15] ——, “Regularization methods for radio tomographic imaging,” in 2009 Virginia Tech Symposium on Wireless Personal Communications, June 2009. [16] J. Wilson and N. Patwari, “See through walls: motion tracking using variance-based radio tomography networks,” IEEE Trans. Mobile Computing, vol. 10, no. 5, pp. 612–621, May 2011, appeared online 23 September 2010. [17] C. Bouman and K. Sauer, “A generalized Gaussian image model for edge-preserving MAP estimation,” IEEE Trans. Image Processing, vol. 2, no. 3, pp. 296–310, 1993. [18] S. M. Ross, Introduction to Probability Models, 9th ed. Academic Press, 2006. [19] C. L. Ogden, C. D. Fryar, M. D. Carroll, and K. M. Flegal, “Mean body weight, height, and body mass index, United States 1960–2002. Advance data from vital and health statistics,” Centers for Disease Control and Prevention: National Center for Health Statistics, Tech. Rep. 347, 2004. [20] Texas Instruments. A USB-enabled system-on-chip solution for 2.4 GHz IEEE 802.15.4 and ZigBee applications. [Online]. Available: http://www.ti.com/lit/ds/symlink/cc2531.pdf [21] M. Bocca, O. Kaltiokallio, and N. Patwari, Radio Tomographic Imaging for Ambient Assisted Living. Springer - Communications in Computer and Information Science 362, 2013.