Weed Science 2008 56:767–774
Factors Affecting the Presence and Persistence of Plant DNA in the Soil Environment in Corn and Soybean Rotations Robert H. Gulden, Sylvain Lerat, Robert E. Blackshaw, Jeff R. Powell, David J. Levy-Booth, Kari E. Dunfield, Jack T. Trevors, K. Peter Pauls, John N. Klironomos, and Clarence J. Swanton* This study investigated factors that influence occurrence and persistence of plant DNA in the soil environment in three crop rotations. In each rotation, soil was sampled in May before planting, in July and August while crops were growing, and in October after harvest. Total DNA was recovered from soil samples taken at two different depths in the soil profile and quantified. Three target plant genes (corn CP4 epsps, corn 10-kD Zein, and soybean CP4 epsps) also were quantified in these DNA extracts using species-specific quantitative real-time PCR assays. In general, total plant DNA content in the soil environment was greatest when the crop was growing in the field and decreased rapidly after harvest. Nevertheless, low levels of target plant DNA were often still detectable the following spring. Age of rotation did not influence target DNA quantities found in the soil environment. Data were collected for a combination of 10 location-years, which allowed for estimation of the variance components for six factors including time of sampling, year, location, crop, sampling depth, and herbicide to total and target DNA content in the soil samples. Mean target recombinant DNA content in soil was influenced most strongly by time of sampling and year (85 and 6%, respectively), whereas total soil DNA content was less dynamic and was most strongly influenced by location and year (49 and 25%, respectively). Over the duration of this study, no accumulation of transgenic plant DNA in the soil environment was observed. Nomenclature: Corn, Zea mays L.; soybean, Glycine max (L.) Merr. Key words: 10-kD Zein, corn, CP4 epsps, crop rotation, DNA cycle, herbicide resistant, plant DNA, real-time PCR, soil DNA, soybean, total DNA, transgenic DNA.
The introduction and commercial success of genetically modified crops coupled with public concerns regarding the safety of these plants has resulted in scrutiny of this technology. The presence of convenient genetic markers in these crops has facilitated this research. For example, many experiments have investigated the inter- and intraspecific movement of transgenes through pollen flow (e.g., Beckie et al. 2003; Hall et al. 2000; Reagon and Snow 2006). On the other hand, far fewer studies have investigated the fate of transgenes in the soil environment (Heinemann and Traavik 2004; Nielsen and Townsend 2004). Moreover, plant transgenes offer an excellent way to study the dynamics of plant DNA in soil. Extracellular, naked, or free plant DNA enters the soil environment throughout the growing season. During active growth, free plant DNA originates from sloughed off root cap cells (de Vries et al. 2003; Hawes 1990) or necrotic root tissue infected by pathogens (Kay et al. 2002; Polverari et al. 2000). Pollen release at anthesis (de Vries et al. 2003) and DNA release from decomposing plant residue (Ceccherini et al. 2003; Widmer et al. 1997) also contribute to the presence of plant DNA in soil later during the growing season. Regardless of source, free DNA in the interstitial soil solution may move readily with bulk water flow (Gulden et al. 2005; Pote´ et al. 2003, 2007). Movement of free DNA is limited by adsorption to organomineral complexes (Crecchio et al. 2005), which is DOI: 10.1614/WS-08-044.1 * First author, Department of Plant Science, 222 Agriculture Building, University of Manitoba, 66 Dafoe Road, Winnipeg, MB R3T 2N2, Canada; second, fifth, and seventh authors, Department of Environmental Biology, University of Guelph, Guelph, ON N1G 2W1, Canada; third author, Lethbridge Research Centre, Agriculture and Agri-Food Canada, 5403 1st Avenue South, Lethbridge, AB T1J 4B1, Canada; fourth and ninth authors, Department of Integrative Biology, University of Guelph, Guelph, ON N1G 2W1, Canada; sixth author, Department of Land Resource Science, University of Guelph, Guelph, ON N1G 2W1, Canada; eighth and tenth authors, Department of Plant Agriculture, University of Guelph, Guelph, ON N1G 2W1, Canada. Corresponding author’s E-mail:
[email protected]
influenced by soil pH (Romanowski et al. 1991), cation content (Poly et al. 2000), soil mineralogy (Pietramellara et al. 2001; Poly et al. 2000) and content of humic substances (Crecchio and Stotzky 1998). Adsorption of DNA offers some protection from other processes such as degradation (Demane`che et al. 2001). Ultimately, all extracellular DNA in the free soil DNA pool is subject either to restriction and further degradation or entry into the lateral gene transfer network through uptake and transformation of soil microbes (Levy-Booth et al. 2007). The former is an important source of nutrients for soil microbes and is mediated primarily via microbial nucleases that are deliberately released into the soil environment for this purpose (Blum et al. 1997). Restriction, degradation, and turnover of unprotected DNA occur rapidly (Ceccherini et al. 2002; Gebhard and Smalla 1999; Pote´ et al. 2005) and comprise an important component of labile nutrient cycling in soil. Entry into the lateral gene transfer network, on the other hand, results in DNA sequence preservation and possible interspersed gene movement. For example, kanamycin resistance genes (nptII ) that comprise part of the transgenic constructs inserted into genetically engineered plants, have been shown to transform competent bacteria in the soil environment through homologous recombination (de Vries et al. 2003; Gebhard and Smalla 1999; Nielsen et al. 2000; Widmer et al. 1997). Further examples were reviewed by Dubnau (1999) and Levy-Booth et al. (2007). The extent of this process in situ, however, is still poorly understood. Taken together, these processes comprise the dynamics of DNA in the soil environment. Most of the understanding of the dynamics of DNA in soil has been derived from microcosm and greenhouse studies. To assess the risk of entry of plant DNA into the horizontal gene transfer network, however, its longevity and behavior in the soil environment must be understood more clearly under field conditions. Studies have shown that recombinant plant DNA can persist in the field at detectable levels ranging from 77 d Gulden et al.: Plant DNA in the soil environment
N
767
Table 1. Genotype and herbicide treatment list for the Elora experiment. Genotypes included glyphosate-resistant (GR) and conventional (conv) genotypes of corn and soybean. Herbicide treatments included glyphosate (Gly) and conventional (conv). 2003
2004
2005
2006
Corn
Soybean
Corn
Soybean
Treatment
Genotype
Herb
Genotype
Herb
Genotype
Herb
Genotype
Herb
1 2 3 4 5 6 7
GR GR conv GR GR conv conv
Gly conv conv Gly conv conv conv
GR GR conv conv conv GR GR
Gly conv conv conv conv Gly conv
GR GR conv conv conv conv conv
Gly conv conv conv conv conv conv
GR GR conv conv conv conv conv
Gly conv conv conv conv conv conv
(Widmer et al. 1997) to 2 yr (Gebhard and Smalla 1999). These studies, however, did not evaluate persistence of recombinant plant DNA over the long term or in rotation and therefore, more comprehensive investigations are needed. The objectives of the present study were to investigate and monitor the occurrence and persistence of plant DNA in the soil environment in existing herbicide-resistant corn and soybean crop rotations. Materials and Methods
Established Rotation Studies. For this study, soil DNA was sampled in three established crop rotation experiments, two of which were located in Ontario and one in Alberta, Canada. The Elora, Ontario crop rotation was a new rotation established at the beginning of this experiment, whereas the Woodstock, Ontario and Lethbridge, Alberta rotations already were established. All three experiments consisted of a randomized complete block design with four replicates. The soil was sampled for DNA analysis from 2003 through 2006. The Elora experiment was initiated at the Elora research farm (43u419N, 80u269W; silt loam soil: 26.1% sand, 60.1% silt, 13.8% clay, pH 7.3, and 5.0% organic matter [OM]) in the spring of 2003. The management, experimental design, and sampling regime for this experiment were described in detail by Lerat et al. (2007). In brief, the experiment was comprised of seven treatments (Table 1) with corn and soybean grown in rotation beginning with corn in 2003. The experiment examined the impact of different use intensities of glyphosate-resistant (GR) genotypes and the associated herbicide on the soil environment. The experiment was conducted for 4 yr. The Woodstock experiment was established in 2000 at the Woodstock experimental farm (43u89N, 80u459W, loam soil: 40.4% sand, 45.0% silt, 14.4% clay, pH 7.1, and 4.0% OM) to evaluate the effects of conventional herbicides compared to glyphosate on agronomic performance and weed control in GR crops. The experimental design, treatment structure, and management are described in detail by Swanton et al. (2007). Part of the experiment contained a fully phased (each treatment was present in each year) GR corn/GR soybean rotation to which glyphosate or conventional soil-residual herbicides were applied. No conventional genotypes were grown in this study. This experiment was sampled from 2004 until 2006 and allowed for the testing of crop and herbicide effects. The Lethbridge experiment (49u429N, 112u499W) was established in 2001 on a loam soil (37.1% sand, 38.2% silt, 24.7% clay, pH 8.0, and 4.6% OM) at the AAFC field 768
N
Weed Science 56, September–October 2008
research station in Lethbridge, AB to investigate the long-term effects of cropping systems with plants with novel traits (Floate et al. 2007). This study contained a continuous corn rotation with four treatments including GR and conventional corn genotypes in which weeds were controlled with the respective herbicides (all postemergence). In control treatments for each genotype, no herbicides were applied and weeds were controlled with the use of mechanical means. This location is arid and the experiment was irrigated as needed. At this location, corn was harvested for silage in late September or early October rather than seed as in the rotations located in Ontario. The experiment was sampled for soil DNA evaluation in 2004 and 2006 and allowed for comparisons between the herbicides and mechanical control. In 2005, heavy flooding limited crop growth and the ability to collect these data. Soil Sampling. In all experiments, soil samples were collected four times each year. Soils were sampled in the respective treatments in early May (before planting), in mid-July (after the last in-crop herbicide application), in early August (reproductive stages in corn and soybean), and in midOctober (shortly after harvest). At each sampling date, 10 soil cores (2-cm diam) were taken to a depth of 15 cm at random locations 10 cm from the crop row throughout each plot. To prevent cross-contamination, separate soil corers were used for sampling conventional and GR genotypes and the cores were contained in new acetate sleeves that were capped with different colors to signify vertical orientation. After coring, samples were stored at 4 C until further analysis. Lerat et al. (2007) discussed plant DNA dynamics of the first 2 yr of the Elora study in detail. These data were included in the analysis conducted here. Differences in sampling distance from the crop row, however, precluded the inclusion of the July and August 2003 data from Lerat et al. (2007) in this study. In addition, eight soil samples (two along each side) were taken from nearby grass swards surrounding each experiment. These samples served as negative controls for each sampling date. DNA Recovery and Quantification. Beginning the day after sampling, soil cores were subsampled as described by Lerat et al. (2007). In brief, openings were cut into each acetate core sleeve with the use of a flame-sterilized scalpel. To minimize the potential for contamination from the corer or acetate sleeves, soil around the outside of the core was removed aseptically and with a fresh, sterile wooden stick; only the soil towards the center of the core at 3- and 12-cm depth was subsampled aseptically into sterile 1.5-ml microtubes. The soil subsamples were stored at 4 C until DNA recovery. After
subsampling, 0.25 g fresh weight (FW) soil was weighed and placed into each well of the UltraClean-htpTM 96-well Soil DNA Isolation Kit.1 Care was taken not to include plant root fragments. When this was unavoidable, the presence of plant root fragments was noted. To prevent contamination among neighboring cells, the weigh paper was rolled into a tube around the soil sample and inserted into the appropriate well before the soil sample was released. For soil DNA recovery, the protocol described by Lerat et al. (2005) was followed without exception. The glass bead, aurintricarboxylic acid, and AlNH4(SO4)2 were added as indicated, and total soil DNA was eluted into a 100-ml final volume of the supplied storage buffer. Each sample extract was subjected to spectrophotometry (260 nm/280 nm) for determination of DNA content and DNA purity. In addition, 1-ml subsamples were used to quantify the target DNA content of the CP4 epsps gene for corn and soybean as described by Lerat et al. (2005) and for the indigenous corn 10-kD Zein storage protein gene as described by Gulden et al. (2005). Quantitative real-time PCR with molecular beacons and primers specific for each gene and species were used to quantify the target genes from plants. The protocols were followed as described. Real-time PCR amplifications were performed on a BioRad iCycler2 in 96-well plates containing a final volume of 20 ml of the following reaction mixture: 1 3 iQ SupermixTM2 (50 mM KCl, 20 mM Tris-HCl, pH 8.4, 0.8 mM dNTPs, 0.5 U of Taq polymerase, 3 mM MgCl2), 500 nM of forward and reverse primers, 400 nM of RRmb or 500 nM of Zeinmb, and 20 ng ml21 of T4 gene 32 protein, and 1 ml of template DNA from soil DNA extracts or sterile ultrapure water. Conditions for PCR amplifications were 3 min at 95 C followed by 45 cycles of 10 s at 95 C and 20 s at 53 C. To calculate the target DNA content of those samples that tested positive for target DNA content, the method described by Gulden et al. (2007) was used. This method uses a curve fitting approach to extract more information from the PCR fluorescence curves. Curve-fit parameters are used in soilspecific multiple regression equations to calculate the amount of target DNA in the sample. This method was shown to provide a marked improvement in accuracy and precision for estimating target DNA content in soil samples over the traditional Ct-based methods. To investigate the presence of the entire CP4 epsps gene sequence in sample determined positive for target DNA with the use of real-time PCR, conventional PCR was conducted on a number of the positive samples. For conventional PCR, the reaction mixture and reagent concentrations were the same as for real-time PCR with the exceptions that the beacon was omitted and the forward and reverse primers were exchanged to the following: forward 59-AAG CCC GCG TTC TCT CCG G, reverse 59-AAG TGC GCA TCG TCG GCG. The PCR protocol also was similar with an annealing temperature of 61 C and the addition of a 20-s elongation step at 72 C. PCR products were separated with the use of agarose gel electrophoresis (1%) and visualized by staining with ethidium bromide. Throughout these studies, all glyphosate-resistant corn genotypes contained event NK603 and all GR soybean genotypes contained event 40–3–2. Statistical Analysis. For each experimental plot, composite total and target DNA values were determined by averaging
values obtained for the subsamples at each sampling depth. All target DNA analysis was conducted on the log values obtained from real-time PCR analysis to reduce heteroskedasticity of errors. Total DNA data were not transformed prior to statistical analysis. For each experimental unit, the proportion of subsamples positive for the respective target DNA was also determined at each sampling time by summing the number of subsamples positive for target DNA and dividing by the total number of subsamples and converting this value to a percentage. To facilitate statistical analysis of target DNA and percent positive subsamples due to a high proportion of zero values in the composite data for the May and October sampling times, 0.01 was added to each value. For the recombinant CP4 epsps gene, the target gene most comprehensively studied in these experiments, the variance components of all main factors that were common among at least two locations (i.e., year, sampling time, crop, depth, and herbicide treatment) were determined with the use of the proportion of the Type 3 SS derived from a GLM ANOVA that were allocated to each factor. Experimental units at the Lethbridge location that were not treated with herbicides were excluded from this analysis. This variance component analysis was repeated on the percent positive subsamples as the covariate that revealed the impact of these factors on target DNA concentration in positive subsamples rather than absolute target DNA content. Variance component analysis was also conducted on total DNA recovered from the soils. To visualize the relative significance of the six factors, a stacked bar chart was constructed. Residual variation was excluded from this chart to evaluate the relative importance of the six factors; however, the proportion of residual variation of the total variation including that of the six factors was determined. To visualize the impact of percent positive subsamples or total recovered DNA on target CP4 epsps, scatter plots using means for experimental units were generated and regressed with the percent positive subsamples or total DNA content as the dependent variables. In addition, ANOVA was conducted for all genes to determine treatment differences within the experiments. The different treatments in each experiment precluded a combined ANOVA of these data. The GLIMMIX procedure in SAS3 was used to account for the mixed-model treatment structure in these experiments and the nonnormal distribution of errors. Factors including year, time of sampling, crop, herbicide, depth, and/or gene were considered fixed effects with only replication considered random. Depth was treated as a splitplot design. Target DNA was analyzed with the use of the Gaussian distribution with its identity link function. Total DNA was analyzed with the same model, although the lognormal distribution and identity link function were most appropriate for describing these data. To determine the impact of the percent positive subsamples or total DNA on target DNA content, analyses of covariance were conducted with the use of percent positive subsamples or total DNA as covariates. Results and Discussion
Target Plant DNA. The three experiments monitored throughout this study provided a total of 10 location-years to examine the occurrence and persistence of target plant DNA in the soil environment in crop rotations. Recombinant Gulden et al.: Plant DNA in the soil environment
N
769
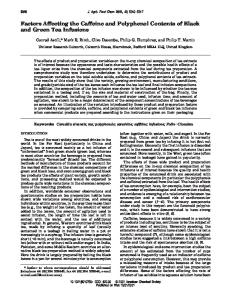
Figure 1. Contribution of the six factors investigated (year, sampling time, location, crop, sampling depth, and herbicide) to total variation of target DNA (CP4 epsps), adjusted target DNA (CP4 epsps ANCOVA), and total DNA recovered from soil in three corn and soybean rotation experiments in Canada.
plant DNA, specifically CP4 epsps, was chosen as the primary marker for plant DNA because its date of introduction was known. Moreover, the sequence of this gene is homologous within and between species, which facilitates direct comparisons among species while maintaining the ability to discern the identity of the source species (Lerat et al. 2005). The significance of the contribution of the six factors (location, year, time of sampling, crop, sampling depth, and herbicide treatment) to variation in the presence and persistence of CP4 epsps was strongly influenced by the percent positive subsamples. When not adjusted for the percent positive subsamples, mean target CP4 epsps content in the soil environment was most strongly influenced by sampling time, with all other variance components accounting for only 15% of the variation observed in target recombinant DNA content among the factors (Figure 1). From the total Type 3 SS, the total variation accounted for the by the six main factors accounted for 65% of the total variation, and residual variation accounted for the remaining 35% of the total variation of this analysis. Regression analysis of mean target recombinant DNA content in soil with the percent positive subsamples, however, revealed that between 87 and 89% of the variation observed in mean target recombinant DNA in each experimental unit was explained by the percent positive subsamples for target recombinant DNA (Figure 2a). Therefore, the variance component analysis was repeated with percent positive subsamples as a covariate. This analysis examined the impact of the factors on DNA concentration in individual subsamples rather than absolute DNA content among subsamples. Year and crop contributed most prominently to the variation in target recombinant DNA concentration, and the relative contributions of the minor factors (location, depth, and herbicide) in the unadjusted analysis remained the same. Residual variation accounted for only 10% of the total variation in this analysis. These results indicated that the large variation in target DNA levels among the sampling times was primarily due to differences in the proportion of subsamples in which target recombinant DNA was detected with high proportions of positive subsamples in crop and a low proportion of positive subsamples when the crop was not growing in the field (see below). In contrast, inherently different concentrations of target DNA in the positive subsamples were primarily related to crop and year. Source species has been shown to influence free plant DNA content in microcosms before (Gulden et al. 2005), and large differences in the mean plant target recombinant DNA content in the soil environment among these sampling times 770
N
Weed Science 56, September–October 2008
Figure 2. Relationships between mean target DNA content and the percent positive subsamples for target DNA (a) and mean target DNA content and total soil DNA recovered (b) in three different soils. Regression equations and R 2 values are indicated where applicable.
was reported by Lerat et al. (2007). No relationship was observed between total DNA recovered from soil and target recombinant DNA (R 2 , 0.01) (Figure 2b). This was somewhat unexpected, as PCR efficiency can be influenced by the quantity of nontarget DNA added to the PCR mixture (Wilson 1997). The method used for target DNA estimation in this study has been shown to correct adequately for extraction and PCR inhibition differences among these soils (Gulden et al. 2007). Therefore, the contributions of location to the total variation were not influenced by differences in DNA recovery from these soils. Quantitative real-time PCR is most effective on short target sequences between 100 and 200 base pairs (bp) in length. Therefore, conventional PCR was conducted to estimate the proportion of subsamples that contain intact sequences of the entire CP4 epsps gene. This analysis showed that amplifiable copies of the entire CP4 epsps target gene sequence were present in about 55% of the subsamples positive for the gene fragment determined with the use of real-time PCR. Thus, real-time PCR overestimated the presence of the entire gene. Figures 3 to 6 summarize the effect of treatments among the various experiments on target genes and total DNA content in the soil environment among the sampling times for which statistical analysis was conducted. Means have been summarized by treatments and year for each location, as differences in treatments among locations and a strong year effect (Figure 1) precluded a combined analysis. Together, the figures indicate the impact of sampling time, location, and year on target and total DNA levels in the soil environment. Specifically, Figure 3 summarizes the differences between corn and soybean crops determined in the Woodstock experiment. Herbicide effects, i.e., the effect of glyphosate vs. conventional herbicides on target CP4 epsps in GR corn at Elora (Figure 4), the effect of glyphosate vs. no herbicides on target CP4 epsps and total DNA at Lethbridge (Figure 5), and the effect of conventional herbicides vs. no herbicides on target 10-kD Zein and total DNA at Lethbridge (Figure 6) are also illustrated. Sampling time was the most significant variance component in this study and Figures 3 to 6 illustrate that among all locations and years, a distinct pattern of plant DNA content in soil was observed. Quantities of all target genes in soil were high in-crop and low after harvest and before seeding. The following May, before seeding, mean target DNA values were similar to those found in October ranging from 0 to 0.71 (6 0.19) log copies g21 soil FW for corn CP4 epsps, to 0.31
Figure 4. The effect of herbicide on target (wide bars) DNA in soybean and total (narrow black bars) DNA recovered from soil at three sampling times in 2 yr in the Elora experiment. Lines across target DNA bars indicate the relative distribution of target DNA with respect to sampling depth. Standard errors of the means for target and total DNA are indicated.
Figure 3. The effect of crop on target (wide bars) and total (narrow black bars) DNA recovered from soil at three sampling times in 3 yr in the Woodstock experiment. Lines across target DNA bars indicate the relative distribution of target DNA with respect to sampling depth. Standard errors of the means for target and total DNA are indicated.
(6 0.12) log copies g21 soil FW for corn Zein, and to 0.04 (6 0.03) log copies g21 soil FW for soybean CP4 epsps among the location-years. The high number of treatments negative for target DNA in May resulted in too many zero values for meaningful statistical comparison of these data. These data indicate spatial heterogeneity in the rate of target DNA degradation resulting in DNA hotspots which likely resulted from protection of target DNA from degradation by adsorption to the soil matrix (reviewed by Levy-Booth 2007). The same pattern of target DNA content in soil was reported for CP4 epsps by Lerat et al. (2007). In the negative control samples collected in the grass swards surrounding the experiments, no target DNA was detected at any time (data not shown), whereas low levels of target DNA (, 1.0 log copies g21 soil FW per positive subsample) were observed sporadically (0 to 4 subsamples per sampling date [up to 2% of the subsamples]) in conventional corn or soybean in the Elora experiment (also see Lerat et al. 2007). This was likely caused by pollen or residue contamination from neighboring plots growing transgenic genotypes. Greenhouse spray-out tests for contamination of conventional seed lots by Lerat et al. (2007) indicated that this was not the cause for the sporadic detection of low levels of target DNA in genotype treatments. The same was not observed at Lethbridge, where spatial separation between conventional and
GM genotypes was greater. High recovery efficiency and high sensitivity of the PCR method for target DNA (Gulden et al. 2007; Lerat et al. 2005) allowed for the confident designation of zero values to samples that tested negative for plant target DNA. Presence of small visible root fragments in the
Figure 5. The effect of glyphosate compared to no herbicide on target CP4 epsps (wide bars) and total (narrow black bars) DNA recovered from soil at three sampling times in 2 yr in the Lethbridge experiment. Lines across target DNA bars indicate the relative distribution of target DNA with respect to sampling depth. Standard errors of the means for target and total DNA are indicated.
Gulden et al.: Plant DNA in the soil environment
N
771
Figure 6. The effect of conventional herbicides compared to no herbicide on target 10-kD Zein (wide bars) and total (narrow black bars) DNA recovered from soil at three sampling times in 2 yr in the Lethbridge experiment. Lines across target DNA bars indicate the relative distribution of target DNA with respect to sampling depth. Standard errors of the means for target and total DNA are indicated.
subsamples subjected to DNA recovery did not influence target plant DNA content (data not shown). Upon cell death, most plant DNA is restricted rapidly within the tissue precluding entry into the soil environment (Ceccherini et al. 2003; Pote´ et al. 2005). Visible root fragments were too small to determine whether they were fresh or residue from previous growing seasons. After sampling time, the impact of year and location was second on recombinant DNA levels in the soil environment. In the soil environment, recombinant DNA levels in October and May (out of crop) varied among years and locations, but were not affected by age of the rotation. Long-term use of glyphosate-resistant crops and the associated herbicide in rotation did not result in accumulation of recombinant plant DNA in the soil environment (Figures 3 to 6) indicating that DNA cycling processes were not affected by long-term use of this technology. Short-term field (Widmer et al. 1997) and microcosm (Pote´ et al. 2005) studies have reported similar results. Nevertheless, at Elora in May 2005, two subsamples (about 0.63% of the subsamples taken in these treatments) tested positive for corn CP4 epsps in plots that had been planted to GR corn in 2003. This was 2 yr after the last corn crop was grown at this location, suggesting that in the soil environment, protection from restriction and degradation (Demane`che et al. 2001; Romanowski et al. 1991) is possible over longer time periods. Our sampling technique of intact cores was designed to avoid possible contamination with wind-borne residue or pollen that may have blown in from surrounding fields. Gebhard and Smalla (1999) also detected transgenic sugar beet (Beta vulgaris L.) DNA 2 yr after plant residue was added to the field; however, they investigated plant DNA persistence at a residue disposal site with a high initial concentration of plant residue. 772
N
Weed Science 56, September–October 2008
Crop species ranked third in impacting target plant DNA levels in the soil environment. At Woodstock, target DNA levels differed between corn and soybean in the fully phased rotation at some sampling dates. In July and August, mean target recombinant DNA levels before (Figure 3) and after (data not shown) correction for the percent positive subsamples were significantly greater in corn than in soybean. This was not observed in October, where differences in mean target plant DNA content were caused by the percent positive subsamples for CP4 epsps (data not shown). Results at Elora were similar for corn in 2005 and soybean in 2006 (data not shown). Greater in-crop target DNA levels in corn compared to soybean may be caused by differences in plant biomass, rooting pattern, and pollen release (Uribelarrea et al. 2002; Westgate et al. 2003) between these crops. Despite differences in total target DNA levels among these crops, low levels of target DNA persisted until the following spring in both species. In the experiments where both corn and soybean were grown, no clear trend in the number of positive subsamples between the crops emerged for the May sampling time. These results indicate that in-crop differences between these species gradually dissipate with time after harvest. Fourth most significant in impacting target DNA levels was year, which impacted target DNA content of soil at all sampling times (Figures 3 to 6). Differences among years were likely the result of differences in crop growth, rooting patterns, and other biological activity in the sampling zone. In August 2004, for example, low levels of target DNA were observed in corn and soybean at Woodstock (Figure 3). Uncharacteristically dry soil moisture conditions (about half of 30-yr average precipitation in August) in the sampling zone at this time likely contributed to this observation. The time interval between harvest and sampling in October was similar in all years, and therefore, differences observed among years were likely not influenced by this. No clear relationship between target DNA content of soil between August and October was found (R 2 0.14 to 0.41). Taken together, these illustrate the importance of climate and edaphic factors in driving the DNA cycle in the soil environment. The impact of sampling depth (line on bars showing target DNA levels in Figures 3 to 6) and herbicide treatment to total variation was limited and only affected target plant DNA levels in the soil environment in isolated instances. The large difference in target CP4 epsps in the soil environment between the herbicide treatments observed only in soybean at Elora in July 2006 was primarily due to the difference in the number of positive subsamples (24 vs. 10%) between the herbicide treatments at this sampling time. Low precipitation (less than half or normal), and therefore reduced early plant growth throughout June 2006, likely caused the low percentage of positive subsamples and likely contributed to the differences observed between the herbicide treatments. In general, plant target DNA dynamics of the indigenous 10kD Zein gene in conventional corn genotypes were similar to those observed for CP4 epsps in the genetically engineered corn genotypes (Figures 5 and 6) (Pearson correlation coefficient of 0.73). Differences in the quantity of these target genes recovered were greatest at the August sampling date and in October 2006, and may have been influenced by genotype through differences in either rooting pattern, DNA exudation, or both. At the other sampling dates, plant target DNA content of the soil was similar for both genotypes and genes, suggesting no gross alterations in the DNA dynamics in the soil environment between these
cropping systems. The conventional (Pioneer 39T68) and GR corn (Pioneer 39T67) genotypes grown in this study were closely related. In 2006 at Lethbridge and at Woodstock, target DNA content for CP4 epsps and 10-kD Zein were evaluated in the same treatments. Mean target DNA content for both genes were similar at all sampling times (Pearson correlation coefficient 0.77) (data not shown). Total Soil DNA. Total DNA recovered from the soil environment is a reflection of the biological presence in that soil. The most significant factors contributing to total soil DNA recovered were location and year, which accounted for about 50% and 25% of the total variation, respectively (Figure 1). The contributions of crop and time of sampling to variation in total DNA recovered from soil were similar (12 and 13%), whereas the influence of sampling depth and herbicide was negligible. Overall, recovery of total DNA from the soil environment was more consistent among sampling times and years than plant target DNA (Figures 3 to 6). Mean recovery of total DNA from soil ranged from about 3 to 60 mg DNA g21 soil FW among the experiments. These values agree with other reports (Aoshima et al. 2006; Reanney et al. 1982). In general, total DNA levels were lower at the Lethbridge location than in the experiments conducted in Ontario. This may have been due to differences in the recovery efficiency among these soils which this extraction method does not correct for (Lerat et al. 2005), the geographical location of this experiment (grasslands biome) compared to the other experiments (temperate forest biome), or both. Interestingly, total DNA recovered from soil often was greater in soybean than in corn at Woodstock where both crops were grown at the same time (Figure 3). Given lower plant target DNA content in soybean than in corn, this indicates larger quantities of DNA from other sources, which suggests greater live biomass of other species in the soil environment in soybean than in corn. This may facilitate more rapid turnover of free DNA in soybean, which may impact the quantity of target DNA recovered. In summary, this study showed that transgenic DNA can persist in rotation at detectable levels for up to 2 yr; however, the vast majority of plant target DNA was degraded shortly after harvest. These experiments illustrated that plant DNA is an important, but transient, component of the total DNA pool in the soil environment in crop rotations in the field. Rapid degradation of plant DNA in the soil environment suggests limited opportunity for natural transformation of plant DNA into soil microbes in the absence of a viable source population.
Sources of Materials 1
UltraClean-htpTM 96-well Soil DNA Isolation Kit, Mo Bio Laboratories, Inc., 1746 Loker Avenue West, Carlsbad, CA 92010. 2 BioRad iCycler, Bio-Rad Laboratories, 1000 Alfred Nobel Drive, Hercules, CA 94547. 3 Statistical Analysis System, Release 9.1, SAS Institute Inc., 100 SAS Campus Drive, Cary, NC 27513.
Acknowledgments We thank Kevin Chandler, Brendan Postman, and several summer students for their technical assistance with this research.
Funding for this work was provided by the NSERC Strategic Grant Program (STPGP 258065-02).
Literature Cited Aoshima, H., A. Kimura, A. Shibutani, C. Okada, Y. Matsumiya, and M. Kubo. 2006. Evaluation of soil bacterial biomass using environmental DNA extracted by slow-stirring method. Appl. Microbiol. Biotechnol. 71:875–880. Beckie, H. J., S. I. Warwick, H. Nair, and G. Seguin-Schwartz. 2003. Gene flow in commercial fields of herbicide resistant canola (Brassica napus). J. Ecol. Appl. 13:1276–1294. Blum, S.A.E., M. G. Lorenz, and W. Wackernagel. 1997. Mechanism of retarded DNA degradation and prokaryotic origin of DNases in nonsterile soils. Syst. Appl. Microbiol. 20:513–521. Ceccherini, M. T., J. Pote´, E. Kay, V. T. Van, J. Marechal, G. Pietramellara, P. Nannipieri, T. M. Vogel, and P. Simonet. 2002. Degradation and transformability of DNA from transgenic leaves. Appl. Environ. Microbiol. 69:673–683. Ceccherini, M. T., J. Pote´, E. Kay, V. T. Van, J. Marechal, G. Pietramellara, P. Nannipieri, T. M. Vogel, and P. Simonet. 2003. Degradation and transformability of DNA from transgenic leaves. Appl. Environ. Microbiol. 69:673–678. Crecchio, C., P. Ruggiero, M. Curci, C. Colombo, G. Palumbo, and G. Stotzky. 2005. Binding of DNA from Bacillus subtilis on montmorillonite–humic acids–aluminum or iron hydroxypolymers. Soil Sci. Soc. Am. J. 69:834–841. Crecchio, C. and G. Stotzky. 1998. Binding of DNA on humic acids: effect on transformation of Bacillus subtilis and resistance to DNase. Soil Biol. Biochem. 30:1060–1067. Demane`che, S., L. Jocteur-Monrozier, H. Quiquampoix, and P. Simonet. 2001. Evaluation of biological and physical protection against nuclease degradation of clay-bound plasmid DNA. Appl. Environ. Microbiol. 67:293–299. de Vries, J., M. Heine, K. Harms, and W. Wackernagel. 2003. Spread of recombinant DNA by roots and pollen of transgenic potato plants, identified by highly specific biomonitoring using natural transformation of an Acinetobacter sp. Appl. Environ. Microbiol. 69:4455–4462. Dubnau, D. 1999. DNA uptake in bacteria. Annu. Rev. Microbiol. 53:217–244. Floate, K. D., H. A. Carcamo, R. E. Blackshaw, B. Postman, and S. Bourassa. 2007. Response of ground beetle (Coleoptera: Carabidae) field populations to four years of Lepidoptera-specific Bt corn production. Environ. Entomol. 36:1269–1274. Gebhard, F. and K. Smalla. 1999. Monitoring field releases of transgenic modified sugar beets for persistence of transgenic plant DNA and horizontal gene transfer. FEMS Microbial Ecol. 28:261–272. Gulden, R. H., S. Lerat, M. M. Hart, J. R. Powell, J. T. Trevors, K. P. Pauls, J. N. Klironomos, and C. J. Swanton. 2005. Quantitation of transgenic plant DNA in leachate water: real-time polymerase chain reaction analysis. J. Agric. Food Chem. 53:5858–5865. Gulden, R. H., D. J. Levy-Booth, R. Campbell, J. R. Powell, M. M. Hart, J. T. Trevors, K. P. Pauls, J. N. Klironomos, and C. J. Swanton. 2007. An empirical approach to target DNA quantification in environmental samples using realtime polymerase chain reactions. Soil Biol. Biochem. 39:1956–1967. Hall, L. M., A. K. Topinka, J. Huffman, and A. Good. 2000. Pollen flow between herbicide-resistant Brassica napus is the cause of multiple-resistant B. napus volunteers. Weed Sci. 48:688–694. Hawes, M. C. 1990. Living plant cells released from the root cap: a regulator of microbial populations in the rhizosphere? Plant Soil 129:19–27. Heinemann, J. A. and T. Traavik. 2004. Problems in monitoring horizontal gene transfer in field trials of transgenic plants. Nat. Biotechnol. 22:1105–1109. Kay, E., T. M. Vogel, F. Bertolla, R. Nalin, and P. Simonet. 2002. In situ transfer of antibiotic resistance genes from transgenic (transplastomic) tobacco plants to bacteria. Appl. Environ. Microbiol. 68:3345–3351. Lerat, S., L. S. England, M. L. Vincent, K. P. Pauls, C. J. Swanton, J. N. Klironomos, and J. T. Trevors. 2005. Real-time polymerase chain reaction (PCR) quantification of the transgenes for Roundup Ready corn and Roundup Ready soybean in soil samples. J. Agric. Food Chem. 53:1337–1342. Lerat, S., R. H. Gulden, M. M. Hart, J. R. Powell, L. S. England, K. P. Pauls, C. J. Swanton, J. Klironomos, and J. T. Trevors. 2007. Quantification and persistence of recombinant DNA of Roundup Ready crops in an agricultural soil: a field study in a corn/soybean rotation. J. Agric. Food Chem. 55: 10,226–10,231. Levy-Booth, D. J., R. G. Campbell, R. H. Gulden, M. M. Hart, J. R. Powell, J. N. Klironomos, K. P. Pauls, C. J. Swanton, J. T. Trevors, and K. E. Dunfield. 2007. Cycling of extracellular DNA in the soil environment. Soil Biol. Biochem. 39:2977–2991.
Gulden et al.: Plant DNA in the soil environment
N
773
Nielsen, K. M. and J. P. Townsend. 2004. Monitoring and modeling horizontal gene transfer. Nat. Biotechnol. 22:1110–1114. Nielsen, K. M., J. D. van Elsas, and K. Smalla. 2000. Transformation of Acinetobacter sp. strain BD413(pFG4 DnptII ) with transgenic plant DNA in soil microcosms and effects of kanamycin on selection of transformants. Appl. Environ. Microbiol. 66:1237–1242. Pietramellara, G., M. Franchi, E. Gallori, and P. Nannipieri. 2001. Effect of molecular characteristics of DNA on its adsorption and binding on homoionic montmorillonite and kaolinite. Biol. Fertil. Soils 33:402–409. Polverari, A., R. Buonaurio, S. Guiderdone, M. Pezatti, and M. Marte. 2000. Ultrastructural observations and DNA degradation analysis of pepper leaves undergoing a hypersensitive reaction to Xanthomonas campestris p.v. vesicatoria. Eur. J. Plant Pathol. 106:423–431. Poly, F., C. Chenu, P. Simonet, J. Rouiller, and L. F. Monroizer. 2000. Differences between linear chromosomal and supercoiled plasmid DNA in their mechanism and extent of adsorption to clay minerals. Langmuir 16:1233–1238. Pote´, J., M. T. Ceccherini, V. T. Van, W. Rosselli, W. Wildi, P. Simonet, and T. M. Vogel. 2003. Fate and transport of antibiotic resistance genes in saturated soil columns. Eur. J. Soil Biol. 39:65–71. Pote´, J., P. Rosse´, W. Rosselli, V. T. Van, and W. Wildi. 2005. Kinetics of mass and DNA decomposition in tomato leaves. Chemosphere 61:677–684. Pote´, J., W. Rosselli, A. Wigger, and W. Wildi. 2007. Release and leaching of plant DNA in unsaturated soil column. Ecotoxicol. Environ. Saf. 68:293–298.
774
N
Weed Science 56, September–October 2008
Reagon, M. and A. A. Snow. 2006. Cultivated Helianthus annuus (Asteraceae) volunteers as a genetic ‘‘bridge’’ to weedy sunflower populations in North America. Am. J. Bot. 93:127–133. Reanney, D. C., W. P. Roberts, and W. J. Kelly. 1982. Genetic interactions among microbial communities. Pages 287–322 in A.T.S. Bull and J. H. Slater, eds. Microbial Interactions and Communities. London: Academic Press. Romanowski, G., M. G. Lorenz, and W. Wackernagel. 1991. Adsorption of plasmid DNA to mineral surfaces and protection against DNase I. Appl. Environ. Microbiol. 57:1057–1061. Swanton, C. J., P. Sikkema, A. Hamill, F. Tardif, and R. H. Gulden. 2007. Long-term effects of Roundup-ReadyTM compared to conventional herbicide systems in Ontario. http://www.plant.uoguelph.ca/research/weedsci/pdf/ Monsanto_Rotation_Final_Reportv2.pdf. Accessed July 7, 2008. Uribelarrea, M., J. Carcova, M. E. Otegui, and M. E. Westgate. 2002. Pollen production, pollination dynamics, and kernel set in maize. Crop Sci. 42: 1910–1918. Westgate, M. E., J. Lizaso, and W. Batchelor. 2003. Quantitative relationships between pollen shed density and grain yield in maize. Crop Sci. 43:934–942. Widmer, F., R. J. Seidler, K. K. Donegan, and G. L. Reed. 1997. Quantification of transgenic plant marker gene persistence in the field. Mol. Ecol. 6:1–7. Wilson, I. G. 1997. Inhibition and facilitation of nucleic acid amplification. Appl. Environ. Microbiol. 63:3741–3751.
Received February 14, 2008, and approved May 30, 2008.