PREPRINT: Accepted for publication in TSF (2016)
Fabrication and characterization of ternary Cu8SiS6 and Cu8SiSe6 thin film layers for optoelectronic applications G. Brammertz1,2*, B. Vermang3,4, H. ElAnzeery5, S. Sahayaraj1,2,4, S. Ranjbar1,2,6, M. Meuris1,2, J. Poortmans2,3,4.
1
imec division IMOMEC - partner in Solliance, Wetenschapspark 1, 3590 Diepenbeek, Belgium. Institute for Material Research (IMO) Hasselt University – partner in Solliance, Wetenschapspark 1, 3590 Diepenbeek, Belgium. 3 imec – partner in Solliance, Kapeldreef 75, 3001 Leuven, Belgium. 4 Department of Electrical Engineering, KU Leuven, Kasteelpark Arenberg 10, 3001 Heverlee, Belgium. 5 Laboratory for photovoltaics, University of Luxembourg, rue du Brill 41, 4422 Belvaux, Luxembourg 6 I3N - Departamento de Física, Universidade de Aveiro, Campus Universitário de Santiago, 3810193 Aveiro, Portugal. 2
We have fabricated and characterized Cu8SiS6 and Cu8SiSe6 thin film layers for optoelectronic applications. The layers were fabricated using a two step process by first evaporating a bilayer of Cu/Si on a Mo/glass substrate, followed by an anneal at temperatures in excess of 480°C in a H2S or H2Se containing atmosphere. Different process conditions with different Cu starting layer thickness, different H2S partial pressure and different anneal temperatures and times were evaluated. The best fabricated layers were thin polycrystalline layers with a relatively low amount of secondary phases. Very narrow and intense photoluminescence signals could be measured on the samples with a peak position of 1.84 and 1.33 eV for the Cu8SiS6 and Cu8SiSe6 materials respectively. The absorption coefficient of the Cu8SiS6 layer was determined from absorption and reflection measurements and was larger than 104 cm-1 at energies above 1.8 eV. Solar cells could not be fabricated so far, because the material appears to be very highly doped, leading to large ohmic leakage behavior in the fabricated solar cell structures.
*
Corresponding author: Email:
[email protected]; Tel.: +32 16 28 8120
1
The photovoltaic industry has seen impressive growth in the past decades, with all three main technologies in the mass production market, Si, Cu(In,Ga)(S,Se)2 (CIGS) and CdTe, achieving record efficiencies in excess of 20 %1. Today, solar cells with a nominal capacity of more than 200 GWp have been installed worldwide2. As the largest individual energy loss factors in solar cells are the carrier thermalization losses3, further efficiency gains could be achieved with tandem cell geometries, combining a lower band gap absorber with a higher band gap absorber material. Using Si or CIGS cells as the bottom cell, absorber materials with a band gap larger than 1.6 eV are required for considerable efficiency gains in tandem geometries4. In the present contribution we have fabricated and characterized thin film Cu8SiS6 and Cu8SiSe6 layers, in order to find out if they can be suitable as high band gap thin film solar cell absorber layers. Up to date, little was known on these two chalcogenide materials, as only structural characterization has been performed so far with some very basic electrical characterization on grain-like samples5-8. We have fabricated the Cu8SiS6 and Cu8SiSe6 layers using a two-step process, which is schematically shown in Fig. 1.
Figure 1: Schematic representation of the fabrication process of the thin film Cu8Si(S,Se)6 layers. First we have deposited a multilayer stack of Cu/Si using E-beam evaporation in a Pfeiffer PLS 580 evaporation chamber on 400 nm Mo on soda lime glass substrates. The Cu layer was deposited first, followed by the Si layer. This order was chosen after initial tests revealed that the layers show very bad peeling, if the Cu layer is deposited on top of the Si layer9. Then the Cu/Si multilayer stack was annealed with a fixed time and temperature in an Annealsys AS-150 rapid thermal anneal chamber in either an atmosphere of 100 % H2S or 10 % H2Se in N2 in order to form the Cu8SiS6 or Cu8SiSe6 thin film layers. A large set of samples was fabricated in this study and different process conditions were varied in order to find optimum process conditions. The varied process conditions for the Cu8SiS6 fabrication were the thickness of the Cu layer, the H2S partial pressure, the anneal temperature and the anneal time. For the Cu8SiSe6 fabrication only the thickness of the Cu layer was varied. A summary of the exact process conditions for all samples as well as the sample names corresponding to the different process conditions are shown in tables I and II for the Cu8SiS6 and Cu8SiSe6 layers respectively.
2
Table I: Summary of Cu8SiS6 sample names as a function of starting layer thickness and sulfurization conditions
Layer thickness (nm/nm) Cu(500)/Si(170) Cu(480)/Si(170) Cu(450)/Si(170) Cu(420)/Si(170)
Anneal time (minutes) H2S partial pressure (mbar) Temperature (°C)
Anneal 1 25
Anneal 2 15
Anneal 3 Anneal 4 15 15
Anneal 5 15
Anneal 6 15
Anneal 7 15
200
200
400
400
400
100
200
560
560
540
560
580
580
580
A1 B1 C1 D1
A2+A2(G) B2 C2 D2
A3 B3 C3 D3
A4 B4 C4 D4
A5 B5 C5 D5
A6 B6 C6 D6
A7 B7 C7 D7
Table II: Summary of Cu8SiSe6 sample names as a function of starting layer thickness and selenization conditions
Layer thickness (nm/nm) Cu(500)/Si(170) Cu(480)/Si(170) Cu(450)/Si(170) Cu(420)/Si(170)
Anneal time (minutes) H2Se/N2 flow (sccm) Temperature (°C)
Anneal 8 15 200 520 A8 B8 C8 D8
The sample names chosen consist of a combination of a letter with a number, where the letter changes from A to D, A representing the sample with the thickest Cu and D the samples with the thinnest Cu thickness, and the number varying from 1 to 8, each number representing a different anneal condition. As a first step we have analyzed the crystal structure of the samples measuring X-ray diffraction (XRD) spectra on a Philips X’Pert Pro diffractometer in a Bragg-Brentano geometry. Fig. 2 shows the measured XRD spectrum of a typical Cu8SiS6 sample (D1) along with the spectrum from the powder diffraction file (PDF) for Cu8SiS6 (PDF # 00-039-1198).
3
Figure 2: XRD spectrum of sample D1 along with the PDF file data for Cu8SiS6. The intensities in the spectrum of the PDF were corrected by a factor sin2θ, in order to account for the changing interaction volume as a function of incidence angle in the thin film measurement as compared to a powder diffraction measurement. A very good agreement with the experimental data can be seen. All peaks present in the experimental spectrum correspond to a peak in the PDF with the exception of the large Mo (110) reflection at 40.5°. The material fabricated is therefore definitely Cu8SiS6 and the amount of secondary phases appears to be relatively low, as no additional peaks can be clearly identified in the spectrum. Comparing the XRD spectra of samples A6, B6, C6 and D6 with different Cu composition (Fig. 3) but same sulfurization, no major differences in the spectra can be observed, with the exception of a clear spectral difference for the C samples, which are the ones with a 450 nm thick Cu layer.
4
Figure 3: XRD spectra as a function of starting metal layer thickness along with the PDF file data for Cu8SiS6 For that deposition, because of a failure of the quartz microcrystal in the deposition system after the Cu deposition, there was a short vacuum break of about 15 minutes between the Cu and the Si deposition, which was not the case for the other depositions. This small change apparently was enough to change the final crystallinity of the thin film layers considerably, as in all C samples the intensity of the Cu8SiS6 peaks is strongly reduced, and large peaks at angles of 28, 32.5 and 46° appear. These additional peaks could not be clearly attributed to any particular secondary phase, but they show that the crystallization for these samples was clearly different as compared to the other samples that did not have the air exposure between the Cu and Si deposition. In addition, even though not all XRD spectra of all samples are shown here, we identified from the other measurements that no major differences between XRD spectra could be seen between samples with same Cu thickness but different sulfurization recipes. As a next step we have made cross section scanning electron microscopy (SEM) images of the different samples in order to study the crystallinity of the samples and the grain sizes. Fig. 4 shows four cross section SEM images of samples A1, B1, C1 and D1. The polycrystalline nature of the layers can be clearly identified. With the exception of the C1 sample, which shows a very rough nature, all layers are relatively flat with a mean thickness of about 1 µm. Only layer C1 shows a very large roughness and also seems to show a double layer structure with a flat, 300 nm thick bottom layer right on top of the Mo and a very rough top layer. Probably, because of the thin oxide layer between the Cu and the Si layers, the intermixing of the Cu and the Si was not quite complete, leading to large inhomogeneity.
5
Figure 4: Cross-section SEM pictures as a function of composition of the Cu8SiS6 samples. Furthermore, in order to get an indication about the absorption coefficient α, we have also deposited a sample of thickness d of about 1 µm on a glass substrate without the Mo layer. This sample was a replica of sample A2 and will be called A2(G) in the following. The reflection R and transmission T of this sample was then measured as a function of the wavelength of the light and from these values the absorption coefficient was derived using the equation10: ଵ
்
ߙ = − ௗ ln ቀሺଵିோሻమ ቁ.
(1)
The results are shown in Fig. 5, which shows the calculated absorption coefficient of the layer A2(G) as a function of the energy of the light. An absorption edge is visible around 1.8 eV, even though the absorption below this threshold energy is also quite large, possibly due to a non-negligible amount of secondary phases in the sample. The absorption coefficient is larger than 104 cm-1 in the whole energy range, of similar magnitude as compared to other thin film absorber materials and therefore Cu8SiS6 might be suitable as a thin film solar cell absorber, at least from an absorption point of view.
6
Figure 5: Absorption coefficient calculated from the reflection and transmission of sample A2(G).
We have then analyzed the photoluminescence (PL) spectra of the samples using a Hamamatsu C12132 time resolved PL tool. Fig. 6 shows the PL spectrum of sample D6 derived using the pulsed laser of the PL tool with a wavelength of 532 nm, 15 kHz repetition rate and 1 ns pulse length with an average illumination intensity of 1 mW on a 3 mm diameter circular illumination area. Similar to all other Cu8SiS6 samples, a narrow, very intense PL peak at an energy of 1.84 eV is visible.
Figure 6: Photoluminescence spectrum of sample D6
7
The material therefore seems to be a direct gap semiconductor with a band gap of about 1.8 eV, which is an almost optimum value for the application as a top absorber in a tandem solar cell with a Si bottom cell4. Fig. 7 shows a summary of the PL spectra on a logarithmic scale as a function of the different processing parameters that were varied. Fig. 7(a) shows the spectra as a function of the Cu thickness. Here a clear trend can be observed of increasing PL intensity with decreasing Cu thickness, with the exception of the C samples which show lower PL intensity, in agreement with the lower intensity already observed by the XRD measurements for the same reason as explained before. Fig. 7(b) shows the spectra as a function of the H2S partial pressure in the oven. No variation can be seen between the different partial pressure values, so this parameter does not seem to make too much of a difference. Fig 7(c) shows the different spectra as a function of the anneal temperature. From the figure it appears that temperatures in excess of 540ºC are required for best crystallization. No clear difference can be seen between the sulfurizations at 560ºC and 580ºC. Finally, in Fig. 4(d) we can see the PL spectra as a function of the anneal time. A longer anneal time of 25 minutes leads to higher PL intensity, indicating that longer anneal times might lead to better crystallinity.
Figure 7: Dependency of Cu8SiS6 photoluminescence spectra on (a) starting layer thickness (b) H2S partial pressure (c), temperature and (d) sulfurization time.
8
In addition to the steady state PL, we have also analyzed the decay of the PL peak, as this decay time can be linked to some extend to the minority carrier lifetime11, which is an important quantity for photovoltaic devices as this is the time available to extract the minority carriers from the absorber layer. The time resolved PL curve was also measured on the Hamamatsu C12132 tool using the same illumination intensity as for the steady state measurements. Fig. 8 shows the PL peak intensity at an energy of 1.84 eV as a function of time for samples A1, B1, C1 and D1. For samples A1, B1 and C1 the PL decay coincides with the pulse width of the laser, corresponding to a PL decay time lower than 200 ps. On the other hand, for the sample with the thinnest Cu layer, D1, a PL decay time longer than the laser pulse width can be identified. After deconvolution of the laser peak from the signal a PL decay time of 0.8 ns can be derived. Such a lifetime might be enough to be able to extract a large part of the minority carriers, under the condition that the mobility of the carriers is sufficient. In order to extract the mobility and the carrier type of the majority carriers, we have made Hall measurements on sample A2(G) on glass, which did not result in any measurable Hall voltage, indicating that the doping density is very high.
Figure 8: Photoluminescence decay as a function of composition.
We have furthermore fabricated solar cell samples out of all absorber layers using a standard processing as used for CIGS based solar cells, namely a Mo back contact in combination with a 50 nm thick chemical bath deposited n-type top CdS layer and a 250 nm thick Al-doped ZnO layer. None of the samples showed a diode-like behavior, but rather just an ohmic behavior with a resistance of about 10 Ohm and no photocurrent could be measured whatsoever. This likely indicates that the samples did not form a proper p-n junction with the n-type doped CdS buffer layer, likely because of the high doping. The hypothesis of a high doping is also confirmed by the measurement of the sheet resistance of the sample on glass A2(G), which showed a sheet resistance of 100 Ω, corresponding to a resistivity of about 0.01 Ω cm, which is a typical value for highly doped material. Further measurements which are beyond the scope of this work will be necessary to clarify if the material is either highly n- or p-type doped, such as for example X-ray photoelectron spectroscopy (XPS) measurements, which could give a measure of the position of the Fermi level with respect to the valence band edge energy at the surface of the sample. 9
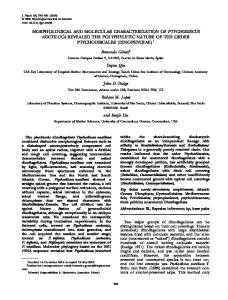
We have also fabricated Cu8SiSe6 layers by doing a selenization of the Cu/Si stack in a 10 % H2Se in N2 environment. The XRD spectra of the four different layers that were fabricated can be seen in Fig. 9 as well as the PDF data of Cu8SiSe6 (PDF # 00-039-1200). It can be seen that for all layers the Cu8SiSe6 is present, as all peaks from the PDF are replicated in the sample. Besides the large Mo peak at an angle of 40.5° and two broad peaks corresponding to MoSe2 at angles of 31.5° and 56°, one additional peak at 27° can be seen in the spectra, which could not be clearly identified. This time no noticeable difference is visible between the C samples and the other samples, despite the same problem with air exposure of the Cu layer prior to the Si deposition. Despite the lower anneal temperature, it seems that the oxide layer is much less of a diffusion barrier for Se.
Figure 9: XRD spectra as a function of starting metal layer thickness along with the PDF file data for Cu8SiSe6
In order to analyze the optoelectronic properties of the Cu8SiSe6, PL measurements were also acquired. The results for the four different samples are shown in Fig. 10. A very bright and narrow PL peak can be identified at an energy of about 1.33 eV, showing that the material is semiconducting with a band gap of about 1.3 eV. This material can therefore not be used as a high band gap absorber in a tandem solar cell structure, but possibly could be used as a regular thin film solar cell absorber, as the band gap energy is in the correct range for maximum Shockley-Queisser limit efficiency12. No large differences could be seen in the PL response between the layers with the different Cu starting layer thickness. Similarly to the Cu8SiS6 samples, we tempted to fabricate pn-junctions using a CdS and ZnO layer, but the results were similar. All samples showed large leakage currents with a roughly ohmic behavior. It seems that also these layers are highly doped.
10
10
PL intensity (a.u.)
10
10
10
10
10
4
A8-Cu(500)/Si(170) B8-Cu(480)/Si(170) C8-Cu(450)/Si(170) D8-Cu(420)/Si(170)
3
2
1
0
-1
1.2
1.4
1.6
1.8
2
2.2
Energy (eV)
Figure 10: Dependency of Cu8SiSe6 photoluminescence spectra on starting layer thickness In conclusion, we have fabricated Cu8SiS6 and Cu8SiSe6 layers using a two step process consisting of the deposition of a Cu/Si metal stack, followed by an anneal in a H2S or H2Se containing atmosphere. The fabricated layers were polycrystalline Cu8SiS6 and Cu8SiSe6 layers with a thickness of about 1 µm and a relatively low amount of secondary phases, at least within the accuracy of XRD. Photoluminescence spectroscopy measurements show very narrow and bright PL peaks at an energy of 1.84 and 1.33 eV for the Cu8SiS6 and Cu8SiSe6 layers respectively. The absorption coefficient of the Cu8SiS6 layer was determined to be larger than 104 cm-1 at energies above 1.8 eV, therefore from an absorption point of view the material might be suitable as a thin film absorber layer. Nevertheless, Hall measurements and sheet resistance measurements on a layer deposited directly on glass indicated that the doping in the material is very high and the trial to make solar cells using a standard CdS buffer layer failed, due to excessively high leakage currents.
Acknowledgments Samira Khelifi and Johan Lauwaert are acknowledged for the Hall measurements of sample A2(G). This research is partially funded by the Flemish government, Department Economy, Science and Innovation. This project has received funding from the European Union’s Horizon 2020 research and innovation program under grant agreement No 640868. B. Vermang acknowledges the financial support of the Flemish Research Foundation FWO (mandate 12O4215N).
11
References
1
M. A. Green, K. Emery, Y. Hishikawa, W. Warta and E. D. Dunlop, Prog. Photovolt: Res. Appl. 24, 3 (2015). 2 https://technology.ihs.com/572178/global-solar-pv-pipeline-surpasses-200-gw-ihs-says (2016). 3 A. Polman and H. A. Atwater, Nature Materials 11, 174 (2012). 4 T. P. White, N. N. Lal, and K. R. Catchpole, IEEE Journal of Photovoltaics 4 (1), 208 (2014). 5 M. Levalois and G. Allais, Acta Crystallographica Section B – Structural Science 37, 1816 (1981). 6 M. Dogguy, Materials Chemistry and Physics 9 (4), 405 (1983). 7 I. D. Olekseyuk, L. V. Piskach, O. Y. Zhbankov,O. V. Parasyuk, Y. M. Kogut, Journal of Alloys and Compounds 399, 149 (2005). 8 M. Ishii, M. Onoda, K. Shibata, Solid State Ionics 121, 11 (1999). 9 H. ElAnzeery, M. Buffière, K. Ben Messaoud, S. Oueslati, G. Brammertz, O. El Daif, D. Cheyns, R. Guindi, M. Meuris, J. Poortmans, Physica Status Solidi Rapid Research Letters 9 (6), 338 (2015). 10 D. K. Schroder, Semiconductor material and device characterization, John Wiley & Sons, New York (1990). 11 A. Kanevce, D. H. Levi and D. Kuciauskas, Prog. Photovolt: Res. Appl. 22, 1138 (2014). 12 W. Shockley and H. J. Queisser, J. Appl. Phys. 32, 510 (1961).
12