Chapter 9
Exploring Cultural Differences in Pictogram Interpretations Heeryon Cho1 and Toru Ishida2 1 Department of Interaction Science, Sungkyunkwan University, Seoul 110-745, Korea, e-mail:
[email protected],
[email protected] 2 Department of Social Informatics, Kyoto University, Yoshida-Honmachi, Kyoto 606-8501, Japan, e-mail:
[email protected]
Abstract Pictogram communication is successful when participants at both ends of the communication channel share a common pictogram interpretation. Not all pictograms carry a universal interpretation, however; the issue of ambiguous pictogram interpretation must be addressed to assist pictogram communication. To unveil the ambiguity possible in pictogram interpretation, we conduct a human subject experiment to identify culture-specific criteria employed by humans by detecting cultural differences in pictogram interpretations. Based on the findings, we propose a categorical semantic relevance measure which calculates how relevant a pictogram is to a given interpretation in terms of a given pictogram category. The proposed measure is applied to categorized pictogram interpretations to enhance pictogram retrieval performance. The WordNet, the ChaSen, and the EDR Electronic Dictionary registered to the Language Grid are utilized to merge synonymous pictogram interpretations and to categorize pictogram interpretations into super-concept categories. We show how the Language Grid can assist the cross-cultural research process.
9.1 Introduction In recent years, advances in information communication technology have enabled people to easily create, publish, and share various images such as photographs, movies, and illustrations on the World Wide Web. Meanwhile, tag-based image management applications such as Flickr and YouTube have come into wide use, allowing users to add tags, a prevalent form of metadata, which are later incorporated into the image search process, to enhance image retrieval (Marlow et al. 2006). Among the various images shared by people, we focus on pictograms or pictorial symbols that carry semantic interpretations. An example of well-known T. Ishida (ed.), The Language Grid: Service-Oriented Collective Intelligence for Language Resource Interoperability, Cognitive Technologies, DOI 10.1007/978-3-642-21178-2_9, © Springer-Verlag Berlin Heidelberg 2011
133
134
H. Cho and T. Ishida
pictograms are road signs, but in this paper, we look at a special kind of pictogram used in computer-mediated intercultural communication, in particular, those used in a children’s email system (Takasaki 2007). Pictograms have clear pictorial similarities with some object (Marcus 2003), and a person who can recognize the object depicted in the pictogram can interpret the meaning associated with the object. Pictorial symbols, however, are not universally interpretable. For instance, the cow is a source of nourishment to westerners who drink milk and eat its meat, but it is an object of veneration to many people in India; hence, a picture of a cow could be interpreted quite differently by Protestants and Hindus (Kolers 1969). The pictograms we handle also exhibit such ambiguity in interpretation; they are designed by Japanese college art students who are non-experts in pictogram design, and no strict design process was applied to ensure a universal interpretation. Therefore, using these pictograms in communication may lead to misunderstanding between the communicating parties. Given such ambiguous pictograms, our goal is (1) to analyze the ambiguities in pictogram interpretation and (2) to propose a way to assist pictogram selection so that communicating parties can achieve better pictogram communication. Our research is motivated by the overarching goal of enabling children from different cultures to communicate with each by using just pictograms; this is not the case when natural language is involved since at least one child (who is monolingual as is often the case) would have to communicate using a second language. We use various language resources such as thesauri, morphological analyzers, and concept dictionaries registered to the Language Grid to process cross-cultural pictogram interpretations. To achieve our first goal, we conduct a human subject experiment to identify cultural differences in pictogram interpretations. We employ thirty pictograms containing U.S. and Japanese pictogram interpretations as stimuli, and use questionnaires and interviews to ask U.S. and Japanese subjects to identify cultural differences in pictogram interpretations. Synonymous English pictogram interpretations are merged using the WordNet (Fellbaum 1998), an English thesaurus, and variants in Japanese notations are integrated using the ChaSen (Matsumoto et al. 1997), a Japanese morphological analyzer; both language resources are registered with the Language Grid. As a result of the human subject experiment, five criteria for detecting cultural difference in cross-cultural pictogram interpretations are identified. To achieve our second goal, we propose a categorical semantic relevance measure, which calculates how relevant a pictogram is to a given interpretation, using categorized pictogram interpretations. Our approach first categorizes the pictogram interpretations into five pictogram categories and then calculates the semantic relevance of a word query (or an interpretation) and a set of pictogram interpretations given to a pictogram to rank relevant pictograms. Five first-level classifications in the EDR Electronic Dictionary (Yokoi 1995) registered to the Language Grid are taken as the five pictogram categories. We show that the categorized approach performs better than the uncategorized approach in pictogram retrieval tasks.
Exploring Cultural Differences in Pictogram Interpretations
135
To summarize, we (1) identify five human cultural difference criteria in crosscultural pictogram interpretations and (2) propose a categorical semantic relevance measure which can be incorporated into pictogram retrieval to assist pictogram selection. In the following section, the experimental setup and the results of the human cultural difference detection experiment are described. Section 9.3 outlines the semantic relevance measure, the pictogram categorization process, and the performance evaluation of the proposed measure. Section 9.4 further discusses the evaluation result, and Section 9.5 lists related works. Finally, Section 9.6 concludes this paper.
9.2 Human Cultural Difference Detection Criteria Detecting cultural differences requires an understanding of culture. More than a hundred definitions of culture exist (Kroeber and Kluckhohn 1952), but Geertz (1973) defines culture as “a historically transmitted pattern of meanings embodied in symbols.” If culture can be viewed as ‘a pattern of meanings,’ it may also be viewed as ‘a pattern of interpretation’ or ‘a pattern of semantics’; therefore, we view the detecting of cultural differences as detecting ‘semantic’ differences. Existing computational methods for calculating semantic differences (or dissimilarities) in two documents make use of, for example, the vector space model (Manning and Schütze 1999) and hierarchical semantic nets (Rada et al. 1989). Applying such semantic dissimilarity calculations to the detection of cultural differences in pictogram interpretations could be easily envisaged, but whether existing computational methods are sufficient to detect cultural differences needs to be carefully studied. For this reason, we conduct a human subject experiment to understand how humans detect cultural differences in pictogram interpretations.
9.2.1 Experimental Setup for Human Subject Experiment A pictogram web survey was conducted in the U.S. and Japan to collect crosscultural pictogram interpretations with possible cultural differences. The two countries were selected for their cultural distinctness (Hall 1976, Hofstede and Hofstede 2005). A total of 120 pictograms were surveyed for U.S.-Japan pictogram interpretations, and 30 out of 120 cross-cultural pictogram interpretations were selected as stimuli for the human cultural difference detection experiment. Cho et al. (2009) gives a detailed description of the stimuli selection process. Table 9.1 shows an example of the U.S.-Japan pictogram interpretations collected from the web survey. As shown in the table, a pictogram can have various interpretations such as talking and laughing, which describe some kind of action, or friends and happy group, which describe some kind of people. We see that 20% of the U.S. respondents interpret the pictogram as “talking, conversation”
H. Cho and T. Ishida
136
whereas 42% of the Japanese respondents interpret it as “to lie, liar, lie.” A positive/negative perceptional difference in the U.S.-Japanese respondents is evident in the pictogram interpretations. Table 9.1 Example of U.S.-Japan pictogram interpretations
U.S. Interpretation
Japanese Interpretation
talking, conversation
20%
to lie, liar, lie
42%
friends
19%
double-dealing
20%
party
17%
deceive
12%
joking
11%
scheme
8%
gossip
9%
dual personality
6%
laughing
9%
boast, big talk
6%
happy group
8%
backbiting
6%
happy
7%
-
-
Six human subjects participated in a two-part cultural difference detection experiment which consisted of (1) answering a questionnaire and (2) responding to a post-questionnaire interview. Three subjects were U.S. nationality English teachers living in Japan with fair understanding of Japanese; the remaining three subjects were Japanese graduate students with graduate-school level English knowledge. All six subjects were paid for their participation. During the questionnaire-answering part of the experiment, the subjects were instructed to first mark the two countries’ interpretations for similar interpretations, and then select one of the four Venn diagrams which depicted the relationship between the two countries’ pictogram interpretations. The relationships were (1) a disjoint relation, (2) an intersecting relation, (3) a subset relation where U.S. interpretations subsume Japanese interpretations, and (4) a subset relation where Japanese interpretations subsume U.S. interpretations. Based on the two countries’ pictogram interpretations and their percentages, similar interpretations, and the relationship between the two countries’ interpretations, each human subject assessed the level of cultural difference in 30 U.S.Japan pictogram interpretations. A seven-point Likert scale (“Strong cultural difference exists = 7” to “Absolutely no cultural difference = 1”) was used to determine the degree of cultural difference in pictogram interpretations. After the questionnaire was answered, each subject was interviewed for one hour for their reasons behind the cultural difference assessment; they were asked to elucidate why they thought certain pictograms had cultural differences while others didn’t. Table 9.2 lists the top three interpretations for each of the 30 U.S.-Japan pictogram interpretations used in the human subject experiment. The bold-lettered pictograms (12 out of 30 pictograms: P01, P02, P10, P11, P12, P13, P14, P15, P16, P21, P28, and P30) were judged by the human subjects as having cultural differences in pictogram interpretations.
Exploring Cultural Differences in Pictogram Interpretations
137
Table 9.2 Top 3 U.S.-Japan pictogram interpretations and percentages (continues) U.S. % Japan P01 (AVG: 6.83, RANK: 2) exercise 46 okay stretch 14 circle jump rope 11 correct answer P02 (AVG: 6.17, RANK: 5) mad 44 no-no angry 39 penalty no 6 no P03 (AVG: 4.00, RANK: 18) woman 37 woman man 21 mom mom 17 adult female P04 (AVG: 4.00, RANK: 19) man 46 man dad 17 adult man woman 12 dad P05 (AVG: 4.00, RANK: 20) up 30 there there 30 that point 13 over there P06 (AVG: 3.50, RANK: 24) down 34 here here 28 this near 12 near P07 (AVG: 4.17, RANK: 17) late 31 future time 24 time passes 10 minutes 10 after 10 minutes P08 (AVG: 4.67, RANK: 14) on time 31 now time 22 time now 10 time now P09 (AVG: 4.67, RANK 15) early 34 past 10 minutes ago 13 10 minutes ago before 11 time turned back P10 (AVG: 5.50, RANK: 10) scared 29 cold worried 17 scared cold 16 shiver P11 (AVG: 6.00, RANK: 7) sly 26 sneer sneaky 25 hehehe (laugh) smile 13 doubt P12 (AVG: 6.33, RANK: 3) mischievous 20 cool happy 16 handsome smart 14 boast
% 44 21 14 59 19 5 78 9 8 74 12 10 36 31 14 41 30 8 36 17 16 46 19 9 42 21 20 64 27 7 22 20 20 59 22 12
U.S. % Japan P13 (AVG: 5.83, RANK: 8) happy 43 cute pretty 21 beautiful woman nice 10 dazzle P14 (AVG: 6.00, RANK: 6) happy 24 cute cute 21 beautiful woman in love 13 dazzle P15 (AVG: 5.67, RANK: 9) whistling 43 nonchalant no 13 humph blow 8 pout P16 (AVG: 5.17, RANK 11) thinking 24 I, me face 16 cheek me 14 face P17 (AVG: 3.67, RANK: 23) cake 29 cake shop pie 22 cake bakery 18 P18 (AVG: 3.83, RANK: 21) food 43 supermarket grocery store 31 grocery store food groups 8 food P19 (AVG: 3.50, RANK: 25) sour 53 sour full 14 delicious happy 12 full stomach P20 (AVG: 3.67, RANK: 22) confused 73 think thinking 8 question question 7 why? P21 (AVG: 7.00, RANK: 1) talking 20 lie friends 19 double-dealing party 17 deceive P22 (AVG: 4.67, RANK: 13) talking 33 speak praying 21 announcement thinking 16 thank you P23 (AVG: 4.50, RANK: 16) winner 49 athletic event win 23 first place event 10 victory P24 (AVG: 2.33, RANK: 30) chewing 42 delicious happy 14 eat yummy 13 fun
% 76 11 5 47 24 7 38 19 14 61 13 9 93 7
87 7 4 48 36 6 48 17 13 42 20 12 23 17 15 45 28 13 67 10 9
H. Cho and T. Ishida
138 Table 9.2 Top 3 U.S.-Japan pictogram interpretations and percentages U.S. % Japan P25 (AVG: 3.17, RANK: 28) happy 31 delicious chewing 18 eat yummy 17 so-so P26 (AVG: 2.83, RANK: 29) TV 18 information media 15 media radio 15 radio P27 (AVG: 3.50, RANK: 26) hobbies 19 hobby fishing 16 play activities 15 fishing
% 24 21 16 35 22 15 87 5 3
U.S. % Japan P28 (AVG: 6.17, RANK: 4) Eiffel Tower 48 Tokyo Tower Paris 24 tower tower 17 Eiffel Tower P29 (AVG: 3.33, RANK: 27) carnival 31 amusement park amusement park 20 amusement games 15 entertainment P30 (AVG: 5.00, RANK: 12) world 45 world Paris 24 earth travel 17 electric wave
% 47 35 8 69 19 6 26 24 10
9.2.2 Result of the Questionnaire Table 9.3 shows the top 12 average cultural difference assessment values given by the six human subjects: columns US1, US2, and US3 indicate the cultural difference assessment values given by the U.S. subjects; columns JP1, JP2, and JP3 indicate the assessment values given by the Japanese subjects. The numerical value “7” indicates “Strong cultural difference exists” and “1” indicates “Absolutely no cultural difference.” The values are sorted in descending order of the average assessment value so that the pictograms having a greater cultural difference lie at the top. Table 9.3 Cultural difference assessments of the top 12 culturally different interpretations PICTOGRAM P21 P01 P12 P28 P02 P14 P11 P13 P15 P10 P16 P30
US1 7 7 6 6 6 6 6 6 5 5 5 5
US2 7 7 7 6 6 6 7 7 7 7 6 5
US3 7 7 7 6 7 6 3 7 7 7 5 5
JP1 7 7 6 6 6 6 6 5 5 6 6 5
JP2 7 7 5 6 7 5 7 3 4 2 3 4
JP3 7 6 7 7 5 7 7 7 6 6 6 6
AVG 7.00 6.83 6.33 6.17 6.17 6.00 6.00 5.83 5.67 5.50 5.17 5.00
SD 0.00 0.37 0.75 0.37 0.69 0.58 1.41 1.46 1.11 1.71 1.07 0.58
Note: US1-US3 indicate the U.S. subjects; JP1-JP3 indicate the Japanese subjects; 7 = Strong cultural difference exists, 6 = Cultural difference exists, 5 = Cultural difference exists somewhat, 4 = Undecided, 3 = Rather no cultural difference, 2 = No cultural difference, and 1 = Absolutely no cultural difference.
Exploring Cultural Differences in Pictogram Interpretations
139
We interpreted average cultural difference assessment values of 5.0 or greater (AVG ≥ 5.0) to mean some kind of cultural difference exists; this is because the numerical value “5” corresponds to “Cultural difference exists somewhat” in the seven-point Likert scale. A total of 6 pictograms (P21, P01, P12, P28, P02, and P14) were unanimously assessed by the six subjects to have some kind of cultural difference. P21 had the highest average cultural difference value of 7.0.
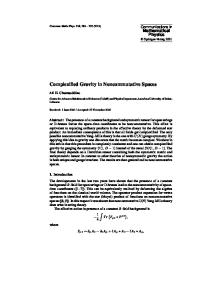
Fig. 9.1 Thirty pictograms used as stimuli in the questionnaire
The images of the 30 pictograms used as stimuli in the questionnaire are shown in Fig. 9.1. The pictograms surrounded by bold solid lines were judged by the human subjects to have cultural differences in U.S.-Japan pictogram interpretations.
9.2.3 Result of the Post-Questionnaire Interview Face-to-face interviews were conducted with the six subjects to elucidate the reasons behind their cultural difference assessments. The human subjects considered the following aspects of the U.S.-Japan pictogram interpretations when assessing cultural differences:
140
H. Cho and T. Ishida
Similar/dissimilar interpretations in the two countries Percentage or ranking of the interpretations Conformity/variance of semantics within one country’s interpretations Presence of proper nouns (e.g., country names) Positive/negative connotation in the interpretations
With regard to the top 12 pictograms with cultural differences (Table 9.3), the subjects assessed them to have cultural differences for the following reasons: Few similar interpretations exist between the two countries. (All pictograms except P28) Quite a few similar interpretations exist, but the percentages of those interpretations are different between the two countries. (P01, P02, P10, P11, P12, P13, P14, P15, and P16) Conformity of semantics is observed in one country’s interpretations while variance is observed in the other’s interpretations. (P10, P12, and P14) Proper nouns such as the name of a country or a city exist in the interpretations. (P28 and P30) Negative connotation in the interpretations is observed in one country while positive connotation is observed in the other. (P11, P12, P15, and P21)
9.3 Assisting Pictogram Selection Using Semantic Relevance The criteria the human subjects employed in assessing the cultural differences in pictogram interpretations include not only the semantic similarity/dissimilarity of the two countries’ interpretations, but also the percentage of the similar interpretations. This suggests that we need to consider both the semantic similarity and the percentage of the pictogram interpretations when devising a way to assist pictogram selection. Note that the diversity of the interpretation is observed both across the two countries and within one country. For example, the U.S. interpretations in Table 9.1 include actions (talking, joking, laughing), state of mind (happy), person(s) (friends, happy group), and event (party). To tackle the semantic ambiguity in pictogram interpretation, we simplify our problem by focusing on the pictogram interpretation of one country (U.S.) from here on.
9.3.1 Semantic Relevance Measure We assume that pictograms each have a list of interpretation words and ratios as per Table 9.1. Each unique interpretation word has a ratio or a probability, and it indicates how much support people give to that interpretation. For example, in the case of Table 9.1, it can be said that more people support talking (20%) as the in-
Exploring Cultural Differences in Pictogram Interpretations
141
terpretation of the given pictogram than laughing (9%). The higher the probability is of a specific interpretation word in a pictogram, the more that pictogram is accepted by people as having that interpretation. We define a semantic relevance measure of a pictogram to be a measure of relevancy between a word query and a set of interpretation words in a pictogram. Let w1, w2, ... , wn be the interpretation words of pictogram e. Let the probability of each interpretation word in a pictogram be P(w1|e), ... , P(wn|e). For example, the probability of the interpretation word talking for the Table 9.1 pictogram can be calculated as P(talking|PictogramTable9.1) = 0.2. Thus the simplest expression that assesses the relevancy of a pictogram e in relation to a word query wi can be defined as follows: P(wi|e)
(9.1)
This probability, however, does not take into account the similarity of interpretation words. For instance, when “talking” is given as the query, pictograms having similar interpretation words like speaking or communicating, but not talking, fail to be measured as relevant since only the probability is considered. To resolve this issue, we need to define some kind of similarity, or similarity(wi, wj), between interpretation words. Using the similarity, we can define the semantic relevance measure or SR(wi, e) as follows:
SR( wi , e)
P( w
j
e) similarity ( wi , w j )
(9.2)
j
There are several similarity measures. We draw upon the definition of similarity given by Lin (1998) which states that the similarity between A and B is measured by the ratio between the information needed to state the commonality of A and B and the information needed to fully describe what A and B are. Here, we calculate the similarity of wi and wj by counting how many pictograms contain certain interpretation words. When there is a pictogram set Ei having an interpretation word wi, the similarity between interpretation words wi and wj can be defined as follows:
similarity ( wi , w j ) | E i E j | | E i E j |
(9.3)
|Ei ∩ Ej| is the number of pictograms having both wi and wj as interpretation words. |Ei ∪ Ej| is the number of pictograms having either wi or wj as an interpretation word. Based on Equation (9.2) and Equation (9.3), the semantic relevance or the measure of relevancy to return pictogram e when word wi is given as a query can be calculated as follows: SR( wi , e)
P( w j
j
e) | E i E j | | E i E j |
(9.4)
142
H. Cho and T. Ishida
The calculated semantic relevance values fall between one and zero, which denotes that either a pictogram is completely relevant to the interpretation (or a word query) or completely irrelevant. Using the semantic relevance values, pictograms can be ranked from very relevant (value close to 1.0) to not at all relevant (value close to 0). As the value nears zero, pictograms become less relevant; hence, a cutoff point is needed to discard the less relevant pictograms. Setting an ideal cut-off point that satisfies all word query and pictogram interpretations is difficult, since all words contained in the pictogram, regardless of how much or little each interpretation word is related to the query, influence the semantic relevance calculation. One way to restrict the diversity of pictogram interpretations is to select a set of interpretation words more related to the query, and use those selected words in the semantic relevance calculation to reduce the effect of less-related interpretation words. With this idea, we propose a semantic relevance calculation on categorized interpretations; we perform a priori categorization of the interpretation words.
9.3.2 Categorizing the Pictogram Interpretations To categorize the diverse pictogram interpretations containing both similar and dissimilar words, we classified them into related perspectives by utilizing the Headconcept Dictionary and Concept Classification Dictionary in the Concept Dictionary of the EDR Electronic Dictionary (Yokoi 1995) which is registered with the Language Grid. The SUMO ontology (Niles and Pease 2001) was another candidate for categorizing pictogram interpretations, but we chose EDR for three reasons: (1) we needed to handle both Japanese and English pictogram interpretations, and EDR provided both the English and Japanese headconcepts; (2) the first level classes located directly below the SUMO ontology’s Entity Class were Abstract Class and Physical Class, but these classes were more abstract than the first level classifications defined in EDR; (3) EDR was specifically developed for natural language processing, so it was more appropriate to our research purpose which involved pictogram communication. To categorize the pictogram interpretations, we defined five pictogram categories by appropriating the five first level classifications in the Concept Dictionary of the EDR. The five first level classifications were: (1) human or subject whose behavior (actions) resembles that of a human (2) {matter} an affair (3) event/occurrence (4) location/locale/place (5) time We designated the five pictogram categories as (1) AGENT, (2) MATTER, (3) EVENT, (4) LOCATION, and (5) TIME; each mapped to the aforementioned first level classifications, respectively. Using the five pictogram categories, each pictogram interpretation word was categorized into appropriate pictogram categories
Exploring Cultural Differences in Pictogram Interpretations
143
through the following steps: first, concept identifier(s) of the interpretation word was obtained by matching the interpretation word string to the English headconcept string in the Headconcept Dictionary; then, the first level classification(s) of the concept identifier was obtained by climbing up the super-sub relations defined in the Concept Classification Dictionary. Cho et al. (2008) gives more details on the a priori categorization of pictogram interpretation words. Applying the semantic relevance calculation to categorized interpretations will return five categorical semantic relevance values for each pictogram. We take the highest categorical value and compare it with the cut-off point to determine whether the pictogram is relevant or not. Once the relevant pictograms are selected, the selected pictograms are then sorted according to the semantic relevance value of the query’s major category. For example, if the query is “park,” then the relevant pictograms are first selected using the highest categorical semantic relevance value of each pictogram, and once the relevant pictograms are selected, the pictograms are ranked according to the categorical semantic relevance value of the query’s major category, which in this case is the LOCATION category. The resulting list of pictograms is a ranked list of pictograms starting with the most relevant pictogram at the top.
9.3.3 Pictogram Retrieval Performance Evaluation The performance of three pictogram retrieval approaches, (1) a string match approach, (2) a not-categorized semantic relevance approach, and (3) a categorized semantic relevance approach were evaluated. The baseline approach for comparison was a simple string match of the query word to the pictogram interpretation words with probabilities greater than the cut-off point. This is the same as selecting pictograms with P(wj|e) > cut-off point where wj equals the query. Five human judges constructed a relevant pictogram set which consisted of 188 pictogram interpretation words and a ranked list of relevant pictograms for each word. The judges were all undergraduate students and they were paid for their tasks. The relevant pictogram set was constructed through the following steps: first, a questionnaire containing 188 pictogram interpretation words with candidate pictograms, each listing all interpretation words, was given to the five human judges, and for each interpretation word, the human judges were asked to (1) judge whether each candidate pictogram could be interpreted as the given word (i.e., judged either as relevant or not relevant), and (2) if judged as relevant, write down the ranking among the relevant pictograms; then the judges’ assessment data were averaged and variances were calculated to select and rank relevant pictograms for each interpretation word. If three or more judges decided that the pictogram was relevant, the pictogram was selected as relevant. Otherwise, the pictogram was discarded. Average rankings among the selected pictograms were calculated based on the rankings given by the human judges; if average rankings were the same among two or more pictograms, variances were calculated to give
H. Cho and T. Ishida
144
higher ranking to the pictogram with lower variance. As a result, a ranked relevant pictogram set for 188 words was created and used in the evaluation. Table 9.4 Mean precision and recall of the three pictogram retrieval approaches CutOff
Precision
Recall
SR-CAT
SRNOCAT
STRMATCH
SR-CAT
SRNOCAT
STRMATCH
0.10
0.25810
0.34883
0.98056
1.00000
0.99867
0.22615
0.15
0.36467
0.46397
0.99275
0.99823
0.97442
0.17766
0.20 0.25
0.46512
0.57565
1.00000
0.98980
0.94174
0.14752
0.57928
0.67917
1.00000
0.95713
0.86184
0.08901
0.30
0.66786
0.73870
1.00000
0.93784
0.72376
0.07704
0.35
0.70442
0.79100
1.00000
0.86527
0.59734
0.06640
0.40
0.74880
0.84497
1.00000
0.82768
0.47810
0.05044
0.45
0.76979
0.87760
1.00000
0.72214
0.35887
0.03183
0.50
0.81036
0.89655
1.00000
0.60657
0.20222
0.02739
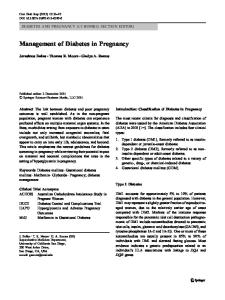
Fig. 9.2 F1-measure comparison of the three pictogram retrieval approaches
The mean precision, mean recall, and F1-measure (van Rijsbergen 1979) of 188 retrieval tasks using the three pictogram retrieval approaches were calculated using nine different cut-off points from 0.1 to 0.5 with 0.05 intervals. Table 9.4 shows the mean precision and recall values of the three approaches at different cut-off points. Fig. 9.2 shows the F1-measure values: the SR-CAT indicates the categorized semantic relevance approach; the SR-NOCAT indicates the notcategorized semantic relevance approach; the STR-MATCH indicates the baseline
Exploring Cultural Differences in Pictogram Interpretations
145
string match approach. Note that the mean precision values were calculated using the valid tasks that returned at least one result. For example, in the case of 0.5 for cut-off point, only 9 retrieval tasks returned at least one pictogram for the STRMATCH approach; hence, the mean precision of the STR-MATCH approach was calculated using only those 9 tasks. We see that the retrieval performance is improved by applying semantic relevance and word categorization (SR-NOCAT, SR-CAT).
9.4 Discussion We see in Fig. 9.2 that a broader cut-off range, roughly 0.25 to 0.5, is obtained by the categorized approach for F1-measure values greater than 0.7 (SR-CAT); in contrast, the not-categorized approach has a steeper curve with a narrower cut-off range roughly between 0.2 and 0.33 (SR-NOCAT). The categorized approach returns a wider range of stable F1-measure values because the interpretation words are grouped into related perspectives prior to the calculation of the semantic relevance value. This enables targeted semantic relevance calculation on the words that are more related to each other. Consequently, the recall is improved without damaging precision. Table 9.4 confirms this; the recall range of SR-CAT is tighter with the values between approximately 0.6 and 1.0 whereas SR-NOCAT is broader with the recall values between approximately 0.2 and 1.0. Meanwhile, the precision values fall between approximately 0.25 and 0.8 for SR-CAT and 0.35 and 0.9 for SR-NOCAT. Our method can be applied to various image management applications such as clipart search systems or online photo-sharing systems as long as the images are labelled with descriptive tags, and those tags have some form of numeric value that expresses how much support the tag receives from the users. With regard to the gathering of the pictogram interpretations, the wide spread usage of tag-based applications enables us to gather human interpretations in the form of tags. Moreover, if user profile and IP address information can be utilized, we can realistically obtain cross-cultural interpretation data (or metadata).
9.5 Related Work Existing pictogram communication systems such as Minspeak (Baker 1982) and IconText (Beardon 1995) use a fixed set of icons and system-defined sentence generation procedures to create pictogram messages. By contrast, the pictogram email system (Takasaki 2007) we looked at in this paper uses an open set of pictograms where new pictograms are continually added to an existing set of pictograms; the system provides a two-dimensional canvas interface where a user can freely place one or more pictograms onto the canvas to create pictogram mes-
146
H. Cho and T. Ishida
sages. Hence, no system-defined pictogram sentence generation procedure is imposed on the user. While the pictogram sentence creation strategy of the existing systems (Baker 1982, Beardon 1995) utilizes a fixed set of pictograms and predefined sentence generation procedures to generate clearly defined pictogram sentences, our system (Takasaki 2007) uses an unfixed set of pictograms as candidates for conveying intended meaning, so the selection of the most relevant pictogram follows the sentence creation strategy. Therefore, we focused on the pictogram selection stage, and proposed a way of using the categorized semantic relevance measure to assist the process of pictogram selection. Related research on tags (which could be viewed as a kind of interpretation given by the user) unifies browsing by tags and visual features for intuitive exploration of image databases (Aurnhammer et al. 2006) or helps users browse largescale annotations in a semantic, hierarchical, and efficient way (Li et al. 2007). Aurnhammer et al. (2006) augments navigation within an image database by combining image tags with visual features of the images while Li et al. (2007) utilizes tags and URLs to browse similar documents or browse documents in a top-down manner; in both cases, the aim is to improve users’ browsing experience through tags. By contrast, we use only the tags (or the interpretation word) and the ratio (or the probability) of the tags to assist users with the selection of more relevant pictograms.
9.6 Conclusion With the goal of assisting intercultural pictogram communication, we looked at the special kind of pictograms used in a children’s email system. To tackle the ambiguity inherent in pictogram interpretations, we conducted a human subject experiment to understand how humans detect cultural differences in pictogram interpretations. We utilized the WordNet (an English thesaurus) and the ChaSen (a Japanese morphological analyzer), which are registered with the Language Grid, to process the English and Japanese pictogram interpretations. Through a two-part study consisting of answering a questionnaire and responding to a postquestionnaire interview, we identified five criteria for the detection of cultural differences. Of these criteria, the human subjects mainly emphasized the similarity/dissimilarity and the agreement percentage of the pictogram interpretations. Based on the findings of our human experiment, we devised a method that selects and ranks relevant pictograms which are more likely to be interpreted as intended; we proposed the categorical semantic relevance measure, which calculates how relevant a pictogram is to a given interpretation in terms of a pictogram category. The five first-level classifications in the EDR Electronic Dictionary registered with the Language Grid were taken as the five pictogram categories to categorize the multifarious pictogram interpretations. The proposed measure defines the relevance probability and the similarity measurement of the categorized pictogram interpretations. We evaluated our measure through multiple pictogram
Exploring Cultural Differences in Pictogram Interpretations
147
retrieval tasks, and confirmed that the proposed measure improves pictogram retrieval performance. During our cross-cultural research process, we were able to facilitate the processing of the English and Japanese pictogram interpretations by utilizing the thesauri, morphological analyzers, and concept dictionaries registered with the Language Grid. We believe that many cross-cultural studies that require multilingual word-processing can likewise benefit from the various language resources registered to the Language Grid. Acknowledgments We thank the following people for their valuable contributions to this research: Yumiko Mori, Toshiyuki Takasaki, Takekazu Hanada (all at the NPO Pangaea), Dr. Naomi Yamashita (NTT Communication Science Laboratories), Prof. Satoshi Oyama (Hokkaido University), Prof. Tomoko Koda (Osaka Institute of Technology), and Dr. Rieko Inaba (Kyoto University). This research was done while the first author was a member of the Ishida & Matsubara Laboratory at Kyoto University, and was supported by the Japanese Government (Monbukagakusho) Scholarship program funded by the Ministry of Education, Culture, Sports, Science and Technology (MEXT) of Japan.
References Aurnhammer M, Hanappe P, Steels L (2006) Augmenting navigation for collaborative tagging with emergent semantics. 5th International Semantic Web Conference, Lecture Notes in Computer Science 4273, Springer: 58–71 Baker BR (1982) Minspeak, a semantic compaction system that makes self-expression easier for communicatively disabled individuals. Byte 7(9): 186–202 Beardon C (1995) Discourse structures in iconic communication. Artificial Intelligence Review 9(2-3): 189-203 Cho H., Ishida T, Oyama S, Inaba R., Takasaki T (2008) Assisting pictogram selection with categorized semantics. IEICE Transactions on Information and Systems E91-D (11): 2638-2646 Cho H, Ishida T, Yamashita N, Koda T, Takasaki T (2009) Human detection of cultural differences in pictogram interpretations. 2009 Int'l Workshop on Intercultural Collaboration: 165– 174 Fellbaum C (1998) Wordnet: an electronic lexical database. MIT Press, Cambridge Geertz C (1973) The interpretation of cultures. Basic Books, New York, Hall E (1976) Beyond culture. Doubleday & Company, New York Hofstede G, Hofstede GJ (2005) Cultures and organizations: software of the mind. McGraw-Hill, New York Kolers P (1969) Some formal characteristics of pictograms. American Scientist 57(3): 348-363 Kroeber AL, Kluckhohn C (1952) Culture: a critical review of concepts and definitions. Harvard University Peabody Museum of American Archaeology and Ethnology Papers 47: 181 Li R, Bao S, Fei B, Su Z, Yu Y (2007) Towards effective browsing of large scale social annotations. 16th Internationl World Wide Web Conference: 943-952 Lin D (1998) An information-theoretic definition of similarity. 15th International Conference on Machine Learning: 296-304 Manning CD, Schütze H (1999) Foundations of statistical natural language processing. MIT Press, Cambridge Marcus A (2003) Icons, symbols, and signs: visible languages to facilitate communication. Interactions 10(3): 37–43
148
H. Cho and T. Ishida
Marlow C, Naaman M, Boyd D, Davis M (2006) HT06, tagging paper, taxonomy, Flickr, academic article, to read. 17th Conference on Hypertext and Hypermedia: 31-40 Matsumoto Y, Kitauchi A, Yamashita T, Hirano Y, Imaichi O, Imamura T (1997) Japanese morphological analysis system ChaSen manual. NAIST Technical Report, NAIST-IS-TR97007. Niles I, Pease A (2001) Towards a standard upper ontology. 2nd International Conference on Formal Ontology in Information Systems: 2-9 Rada R, Mili H, Bicknell E, Blettner M (1989) Development and application of a metric on semantic nets. IEEE Transactions on System, Man and Cybernetics 19(1): 17–30 Takasaki T (2007) Design and development of a pictogram communication system for children around the world. 2007 International Workshop on Intercultural Collaboration, Lecture Notes in Computer Science 4568, Springer: 193–206 van Rijsbergen C (1979) Information retrieval. Butterworths, London Yokoi T The EDR electronic dictionary. Communication of the ACM 38(11): 42–44