Experimental Evidence on the Relationship between Candidate Funding Sources and Voter Evaluations
Conor M. Dowling Assistant Professor University of Mississippi Department of Political Science 235 Deupree Hall University, MS 38677
[email protected] 662.915.5673
Michael G. Miller Assistant Professor Barnard College, Columbia University Department of Political Science 3009 Broadway New York, NY 10027
[email protected] 212-854-8422 @Millerpolsci
Word Count: 5,188 (text and footnotes)
Experimental Evidence on the Relationship between Candidate Funding Sources and Voter Evaluations
Abstract: Money comes from a variety of sources in American elections. It is unclear however whether voters’ knowledge about a candidate’s funding portfolio influences how that candidate is evaluated. We present the results of two survey experiments in which we randomly assigned a funding portfolio to a hypothetical candidate. We find that on average a candidate described as having received a majority of his contributions from individuals is evaluated more highly than one who received a majority of his contributions from interest groups. We also find that when it comes to self-financing a campaign, using private sector money is more beneficial to candidates than using inherited money, but only when the candidate is a member of the same party as the voter. Our results have implications for campaign strategy, academic debates concerning the effect of money on elections, and policy debates concerning the effects of increased campaign finance disclosure.
Keywords: campaign finance; disclosure; PACs; survey experiment
During the 2012 election cycle, President Barack Obama sent an early fundraising email in which he told prospective donors, “Our campaign doesn’t take money from Washington lobbyists or special-interest PACs. We’re doing this the right way—with a whole lot of people like you taking the lead” (Bedard 2011). Such a statement is fairly typical in American politics, as candidates stress their popular appeal and/or insinuate that their opponents are beholden to “special interests” if they accept large sums from Political Action Committees (PACs). It is unclear however whether touting a funding portfolio marked by more donations from individuals than interest groups is beneficial. In this paper, we therefore engage the following question: Do voters consider the source of campaign funds as a relevant piece of information when evaluating candidates? We present the results of two survey experiments in which we randomly assigned a funding portfolio to a hypothetical candidate. In general, we find that people do consider the sources of funding when evaluating candidates, but that the effect of this information is often moderated by whether the candidate and voter are of the same political party. In particular, two findings stand out. First, a candidate described as having received a majority of his contributions from individuals is evaluated more highly than one who received a majority of his contributions from interest groups. Moreover, this difference appears to be primarily driven by negative feelings about candidates using interest group contributions—as opposed to positive feelings about individual donors, as a candidate who primarily funds his campaign with contributions from individuals does not receive much better evaluations than one about whom respondents are given no information regarding funding sources. Second, we also include treatment conditions in which the candidate is described as primarily self-financing his campaign—and one study in which this self-financing is randomly
1
assigned to be from money earned in the private sector and inherited money. We find that compared to using inherited money, using private sector money is beneficial to candidates, but only when they are of the same party as the voter. This likely reflects a dynamic in which copartisans see private sector earnings as indicative of quality and a potentially successful candidate, whereas out-partisans make no such distinction between the two types of selffinancing, perhaps in part because they already have fairly low evaluations of the candidate as a result of their differing partisanship. These results have three broad implications. First, in terms of campaign strategy, campaigns may be wise to trumpet their individual contributions and make the interest group donations to their opponents known, as President Obama and other candidates often attempt to do. Second, in terms of public policy, several states have instituted (e.g., Alaska) or made recent pushes to institute reforms such as real-time electronic disclosure of donors. Our results suggest that making donor information more readily available to voters may inform their evaluations of candidates at the margins.1 Finally, our findings inform academic debates concerning the effect of money on election outcomes. Cross-sectional studies suggest that interest group funding has a positive correlation with electoral success (see: Alexander 2005; Brown 2013). We find no evidence in our experiments that individuals are more likely to vote for a candidate who primarily relies on interest group funding compared to other funding sources (or no funding information). In fact, individuals in our studies recognize that interest group funding helps candidates win (or at least does not hurt their chances), but this does not translate to increased evaluations of the candidate on other dimensions (e.g., vote intent, whether the candidate would do a good job in office, etc.). Our results therefore reinforce the dominant interpretation of the 1
Alaska has passed such a policy (AS 15.13.110(g)); Massachusetts is currently debating one in its state legislature (MA H.4226 and S.2264).
2
aggregate, cross-sectional association between interest group funding and candidate success as reflecting a selection effect in which interest groups attempt to invest in candidates that are likely to win. Does it Matter Where Campaign Money Comes From? Money is a powerful force in American elections. All campaigns must have it, and challengers in particular realize vote returns when they spend it (e.g., Abramowitz 1991; Gerber 2004; Jacobson 1990; 2006; Krasno and Green 1988). Luckily for candidates, donors seem all too happy to put money into the political system, as evidenced by the consistent growth in campaign spending since the 1970s (Jacobson 2009, ch. 3; Gross and Goidel 2003; Lott 2000).2 Conventional wisdom holds that candidates use their political skills, favorable conditions, or both to raise money from donors (for an extensive discussion, see Maestas and Rugeley 2008). Once raised, this money is spent with the aim of delivering returns in the form of higher vote totals. Within this framework, the percentage of a candidate’s overall funding that is comprised of any single source (for federal candidates: individual contributions, Political Action Committee [PAC] donations, party support, or self-financing) should not be correlated with that candidate’s vote percentage. In other words, if money is a fungible commodity in terms of its ability to persuade voters, then it should deliver the same benefit to the campaign regardless of the source from which it was obtained (for a more thorough discussion, see Brown 2013). Yet, controlling for a variety of other factors, prior observational work finds positive associations between PAC (interest group) donations and candidate vote share (Alexander 2005; Brown 2013). The 2
As just one example of the rise in campaign spending, the average campaign expenditure by a major party challenger to a U.S. House seat in 1974 was approximately $40,000; in 2012 the average was nearly $600,000 (Source: Campaign Finance Institute; http://www.cfinst.org/pdf/vital/VitalStats_t2.pdf).
3
dominant explanation for this finding is that there is a selection effect occurring, where stronger candidates are more likely to receive PAC funding in the first place (see Brown 2013). This explanation—that PAC funding is a proxy for a candidate’s political talents, attractiveness, and policy positions, and money is simply an observed correlate of unobserved (by the researcher) candidate traits—is compelling. The strategic decision-making of PACs has received substantial attention in both federal and state elections, where previous research has consistently found that incumbents, leadership, and powerful members of the rank and file benefit disproportionately from PAC donations (Cassie and Thompson 1998; Herrnson 1992; Herrnson and Curtis 2011; Snyder 1990; Stratmann 1992; Thielemann and Dixon 1994; Thompson, Cassie, and Jewell 1994). In short, this paradigm holds that candidates who do well on Election Day received PAC contributions precisely because they were expected to do well. Consistent with this narrative, Brown (2013) argues that external funding correlates with electoral success because good candidates attract donors and voters alike. An alternative–or perhaps complementary—explanation is that voters use interest group funding as a cue that indicates a high-quality candidate worthy of their support. For instance, voters might respond directly to information about campaigns’ sources of funding, recognizing a PAC-backed candidate as a “stronger” one. More broadly, voters might take cues from other sources of funding as well. If so, there is no shortage of these cues in the political environment. Information about candidate funding sources—or at least, intimations about those sources—is often reported by media3 and reform-minded interest organizations4 who disseminate summary financial information for mass consumption, particularly as part of “horse-race” coverage to 3
See, for example, the headline “Obama Trumps Romney With Small Donors” during the 2012 election cycle (Dwyer 2012). 4 See, for example, various press releases from the nonpartisan Campaign Finance Institute (cfinst.org).
4
describe which candidate has raised more money at each quarterly deadline. Indeed, political campaigns themselves might attempt to use their funding profile to their advantage, as evidenced by the email from President Barack Obama to prospective donors referenced above. Prior work suggests that campaign finance information can be informative to voters. Lupia’s (1994) seminal study, for instance, found that individuals who knew the insurance industry’s position on California’s 1988 ballot initiatives on insurance policy—presumably as a result of the industry’s advertising campaign—were able to use that information as a cue and vote in the same way as someone who had “encyclopedic” knowledge of the ballot initiatives.5 More recently—and more closely related to our work—Sances (2013) randomly assigned survey respondents to receive information about political contributions and found that information about the source of those contributions (business or labor) allowed respondents to more accurately place candidates on an ideological spectrum. Other recent experimental work finds that giving voters information about the sponsors of negative ads, such as the identity of major donors to sponsoring organizations, results in the ads having a smaller persuasive effect on voters than if that information is not available (Dowling and Wichowsky 2013; Ridout, Fowler, and Franz 2013).6 In this paper we address a more general question: Does knowledge about the major sources of funding for candidates—and not the specific ideological source of those funds— matter for how candidates are evaluated? Research Design To assess whether voters respond to information about candidates’ funding sources to 5
A great deal of other work in political science and related fields has shown the extent to which individuals use heuristics to inform their decision-making (see, for example, Lupia and McCubbins, 1998; Popkin, 1991; Sniderman, Brody, and Tetlock, 1991). 6 This work builds on work that finds group-sponsored negative ads (without any disclosure of donors) tend to be more effective than candidate-sponsored negative ads (Brooks and Murov 2012; Dowling and Wichowsky 2014; Weber, Dunaway, and Johnson 2012).
5
evaluate candidates, we conducted two survey experiments that provided a short biography of a fictitious candidate for an open congressional seat.7 The first experiment was included on the 2010 Cooperative Congressional Election Study (CCES), an opt-in Internet survey administered by YouGov/Polimetrix, which uses a combination of sampling and matching techniques in an effort to approximate a random digit dialing (RDD) sample (Vavreck and Rivers 2008; see the Supplementary Material for more information). The second experiment used a convenience sample of US residents recruited using Amazon.com’s Mechanical Turk (MTurk) interface (see Supplementary Material for more information). Table 1 describes the experimental design and provides question wording for each experiment. [Table 1 about here] The key manipulation of interest in each study is the “funding source treatment.” In the CCES experiment (panel A of Table 1), there were four funding source treatments, each assigned with equal probability. Respondents were told that the candidate was “financing his campaign primarily with…” (1) “money he made in the private sector,” (2) “money he inherited,” (3) “contributions from individual citizens and interest groups,” or (4) “contributions from individual citizens.” In the MTurk experiment (panel B of Table 1), the funding source treatment conditions were either that the candidate raised $700,000 from one of three possible sources (his own funds, interest groups, or individual contributions) out of a total of $1.3 million, or that his “campaign is funded with a mixture of individual contributions, contributions from interest groups, and his own money.”8 Providing participants with dollar figures (as opposed to informing them directly about the “primary” source of the candidate’s funding as in the CCES 7
Each study received human subjects approval from the human subjects committee at [institution redacted]. 8 $1.3 million is a large sum of money, but is a fairly typical funding total for an open-seat candidate (Campaign Finance Institute 2012).
6
experiment) requires them to make their own judgments about the extent to which various funding sources were important in the candidate’s funding portfolio. We also randomized the party of the candidate for two reasons. First, partisanship provides a point of comparison for the size of any funding source treatment effects. Second, party agreement (between the respondent and the candidate) may moderate the effect of the funding source treatments. For example, co-partisans may see many contributions from individuals as a positive indicator, but out-partisans may not care about them as they are likely from individuals with whom they do not agree politically. In the CCES experiment, we randomly assigned the party of the candidate to be Republican, Democratic, or not included. Because there were no significant differences across funding source treatment conditions in the CCES experiment when no party was included (see Figure 1 below), in the MTurk experiment we simply randomly assigned the candidate’s party to be Republican or Democratic.9 The design of the MTurk experiment differed from the CCES experiment in two other ways. First, we included an “extra information” condition; participants randomly assigned to this condition read additional biographical material about the candidate (see Supplemental Material). Supplying this information at the end of the vignette more closely mimics the sort of background provided in a news story that a voter might encounter during a real-world election. Second, we included a control condition in which participants saw only the biographical information about the candidate; that is, they received no information about the candidate’s funding sources. In 9
In the CCES experiment we also randomly assigned the candidate to either be contesting a U.S. House or U.S. Senate seat because we were interested in whether respondents would make any distinction between the offices when evaluating the candidate and information about his funding sources. Analysis of variance (ANOVA) finds no statistically significant main effect of the House/Senate manipulation for any of our outcome measures (described below), nor is there any significant interaction effect between the House/Senate manipulation and the funding source manipulation. We therefore collapse the House/Senate conditions for analysis purposes.
7
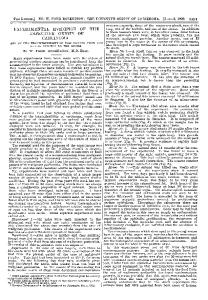
providing no information about campaign funding, the control condition likely reflects the lack of knowledge many voters might have of a typical candidate’s funding portfolio, thereby providing a logical point of reference in the experimental design. Analysis and Results We asked several candidate evaluation questions after each vignette. Question wording is included in Table 1 and coding details are in the Supplementary Material. Summary statistics for the outcome measures and demographic and political characteristics for the CCES sample by funding source treatment condition are presented in Supplementary Material Table S2, and Supplementary Material Table S3 provides the same for the MTurk experiment. CCES Experiment We restrict analysis of the CCES experiment to the 756 respondents who provided responses to all of the questions used in the analysis presented below.10 Table S4 in the Supplementary Material presents differences of means on relevant outcomes by treatment condition, and also by whether the candidate shared a partisan affiliation with the respondent (or whether no party information was provided in the vignette).11 In the text, we present figures for the main findings we wish to highlight. Each figure depicts mean levels of the outcome variable with 95% confidence intervals. Figure 1 depicts responses to our Vote Intent question (0=not very likely; 100=very likely). One aspect of Figure 1 that immediately stands out is the fact that individuals are much more likely—on the order of 30 to 40 points—to vote for a co-partisan candidate (middle pane) than one from the other party (right pane), no matter what funding source treatment condition 10
Table S1 in the Supplementary Material provides participant flow information for both experiments. 11 When analyzing both experiments, we considered partisan “leaners” as partisans. “Pure” independents are excluded from the analysis of both experiments.
8
they saw. Moreover, as is easily seen, the effect of partisanship is much greater than the effect of the funding source conditions. [Figure 1 about here] Of most interest to us was the difference between a candidate primarily relying on interest group funding and one primarily relying on funding from individuals. In each pane of Figure 1, the interest groups condition rates lower than the “individual contributions” condition. However, none of the differences between the interest groups and individual contributions conditions reach conventional levels of statistical significance (left-to-right across the three panes, p=.151, .135, .130, two-tailed12). Examining across funding source conditions within the “same party” and “different party” panels does reveal some significant differences with respect to the self-financing conditions though.13 When told that a co-partisan candidate had primarily spent money he had inherited, respondents were about 14 points less likely to vote for him compared to one whom was described as receiving funds primarily from individuals (p<.01, twotailed; 14 points represents a shift of almost one half of a standard deviation on the outcome measure). These two conditions are not statistically significant when the candidate is of the same party of the respondent however (p=.705). Instead, primarily using private sector money resulted in a candidate being less likely to be voted for when he was of a different party from the respondent, by about 10 points compared to the “individual citizens” condition and 12 points compared to the inherited money condition (p<.05 for both comparisons). These findings therefore suggest that partisan agreement moderates the relationship between funding sources 12
All p-values reported in the text are two-tailed, and were obtained from simple difference of means t-tests. 13 There are no significant differences across the four funding source conditions for any of the outcomes in the “No Party Given” condition (see Supplementary Material Table S4). To save space, we do not depict this condition in subsequent figures.
9
and vote intent, at least with respect to the different self-financing conditions; co-partisan (but not out-party) voters downgrade candidates who spent money they did not earn. Responses to our other post-treatment questions are depicted in Figure 2. Figure 2a displays results for a Candidate Evaluation Index (standardized: M=0, SD=1) constructed from five items (every item listed in Table 1 except for “candidate would focus on serving special interests,” alpha=.93; see Supplementary Material for further details). Higher values of the index reflect more positive evaluations of the candidate. Figure 2b then displays results for the single item concerning special interests, reverse-coded so that higher values indicate that the respondent felt the candidate would not serve special interests. [Figure 2 about here] As in Figure 1, Figure 2a indicates that interest group funding results in lower evaluations than funding from individuals, but these differences do not reach conventional levels of statistical significance (p=.059 for same party; p=.137 for different party). The left pane of Figure 2a indicates that a candidate who is of the same party as the respondent, and who uses money he inherited, was evaluated significantly less favorably by his co-partisan voters compared to both candidates who spent mainly money contributed from individuals and those who spent money earned in the private sector (p<.001 for both), a pattern consistent with the one observed in Figure 1. When the candidate’s party differs from that of the respondent though (right pane of Figure 2a), regardless of where the money comes from, individuals appear to judge a candidate from the “wrong” party just as harshly. Thus, as with the Vote Intent outcome, party agreement between candidate and respondent is an important factor for evaluations of candidates who primarily self-finance their campaign.
10
Turning to Figure 2b, we find that respondents were much more likely to believe that the candidate would not serve special interests when told that he received most of his contributions from “individuals” as opposed to funds primarily from “individuals and interest groups,” but only when the respondent and candidate were of the same party (p=.027; the p-value for when the respondent and candidate are of different parties is .235). Thus, while respondents are more likely to judge candidates of their own party as beholden to special interests when told that interest group contributions were a major component of their funding profile, such knowledge does not appear to significantly affect their judgment of candidates from the opposite party. As we observe below, however, this result is not replicated in our MTurk experiment; there, both coand out-partisan candidates are more likely to be viewed as beholden to special interests if in the “interest groups” condition rather than the “individuals” condition. Indeed, the null finding for the difference between these two conditions among out-partisans in the CCES appears to be an outlier, as in the MTurk experiment the interest groups condition is statistically significantly different from the individual condition for both co- and out-partisans whether the vignette included extra biographical information or not (see Figure 3c below).14 14
Additional evidence that the CCES null result for the difference between the “individuals” and “interest group” conditions might be an outlier is found in a brief follow-up experiment we conducted to see whether the sentence that describes the candidate “as a political outsider who can change the way things are run in Washington” was influencing our results. In particular, a concern is that even if candidates often say they are an “outsider,” doing so might make them particularly vulnerable to poor evaluations if they also have a substantial amount of financial support from interest groups. We therefore conducted an experiment using MTurk participants in July 2014 (two years after the original MTurk experiment). Approximately 1,000 participants took the survey, with an analysis sample of 811 (after we restrict to partisans and those who answered all outcome measures, as we do for our other experiments). We used the vignette that included the extra biographical information in the MTurk experiment and included only the “individuals” and “interest group” funding conditions as they were of most interest and we wanted to increase power with a smaller sample. We randomly assigned the party of the candidate to be Democratic or Republican so we could make the same party agreement comparisons. We then also randomly assigned the sentence describing the candidate as a
11
MTurk Experiment As described above, the MTurk experiment differed from the CCES experiment in that it includes a control condition in which respondents were provided with no information about the candidate’s funding sources. In addition, the MTurk experiment treatment conditions provide respondents with a dollar figure ($700,000 out of $1.3 million of overall fundraising) that came from one of three funding categories (individuals, interest groups, his own money), or that the candidate was funded with a mixture of these three. The MTurk experiment also includes an “extra information” condition in which respondents saw more biographical information about the candidate. This experiment therefore more closely mimics a typical description of a candidate that a voter might encounter in the media and provides a logical baseline for comparison (no information about funding sources). We restrict analysis of the MTurk experiment to the 1,463 respondents who provided responses to all of the questions used in the analysis presented below. Figure 3 depicts the results of the MTurk experiment’s five (funding source: control, individual contributors, interest groups, self-financing, or mixture) x two (party: same party of respondent or different party) x two (extra information or no extra information) design. The outcome measures are the same as in the CCES
“political outsider” to be included or not. Thus, it was a 2 (funding) x 2 (party agreement) x 2 (political outsider) experiment. The full results of this experiment are not included for space reasons, but will be made available upon request. In that experiment, consistent with the original MTurk experiment, the “individuals” condition is statistically significantly different from the “interest groups” condition (p<.01) on the “serve special interests” outcome measure for both respondents of the same party as the candidate and respondents of the other party, even when the political outsider sentence is not included. More generally, although there is a general pattern of differences between the two funding conditions being smaller when the “political outsider” sentence is not included, we found no statistically significant differences between “political outsider” conditions for any of our three outcome measures for any pair of funding-party agreement conditions (i.e., interest group-same party, individuals-same party, interest groupdifferent party, individuals-different party). In other words, holding party agreement and their primary funding source constant, candidates in the follow-up experiment were viewed about the same whether they were described as a “political outsider” or not.
12
experiment with one exception: Vote Intent is measured on a -3 to 3 scale (not 0 to 100). For example, Figure 3a depicts means and 95% confidence intervals for the Vote Intent outcome; the two top panes represent means for when the respondent is of the same party as the candidate, while the two bottom panes show responses for opposite party respondents. Within each pair of panes, the chart on the left is for those respondents who received no extra information and the chart on the right is for those respondents who did receive the extra biographical information. Figures 3b and 3c then depict the same information for the Candidate Evaluation Index (M=0, SD=1; alpha=.85) and Candidate would NOT serve special interests item, respectively. [Figure 3 about here] As the top-left pane of Figure 3a shows, respondents were significantly more likely to vote for same-party candidates who raised a majority of their funds from individuals, relative to the control group, the interest group condition, the self-financing condition, and the mixture condition (p<.05 for all) when no extra information was given. Candidates in the mixture condition also did well when no extra information was given, at least compared to those in the interest group condition (p<.05). However, all significant differences for same-party candidates disappear, and the substantive differences are muted, when respondents were shown extra information, displayed in the top-right pane.15 A slightly different pattern emerges for opposite-party candidates (displayed in the two bottom panes of Figure 3a). With no extra information provided (bottom-left), candidates in the interest group condition were significantly less likely to be voted for than those in the control group, the individual contributor group, and the self-financed group (p<.05 for all). Oppositeparty candidates who received a majority of their contributions from individuals were also more 15
The smallest p-value is for the difference between the interest group condition and the control condition (p=.053).
13
likely to be voted for than those in the mixture condition (p<.05). Unlike same-party candidates, however, many of these differences endured when extra information was provided for oppositeparty candidates. Specifically, interest-backed opposite party candidates in the extra information condition (bottom-right) were significantly less likely to be voted for than the control group, the individual contributor group, and the self-financing group (p=<.05 for all). Self-financers also did slightly better on the Vote Intent outcome than candidates in the individual contributor group and the mixture group (p<.05 for both). Turning to the Candidate Evaluation Index (Figure 3b), the same-party results (top panes) suggest that few differences emerge in evaluation of same-party candidates. Candidates in the “individual citizens” condition were evaluated significantly more favorably than those in the “interest group” condition when no extra information was given (p<.05), but not when that extra information was provided. More differences are apparent in the Candidate Evaluation Index with regard to opposite-party candidates (bottom panes). When respondents were provided with no extra information (bottom-left), opposite-party candidates in the “mixture” condition fared particularly poorly, doing worse on the index than candidates in the “individual contributions” condition and self-funders (p<.05 for both). “Mixture” candidates were evaluated poorly when extra information was provided as well (bottom-right), doing worse on the index than candidates in the control group and self-funders (p<.05 for both). Self-funders also did better than candidates in the “individual citizens” condition and the “interest groups” condition (p<.05 for both). Interest-backed opposite-party candidates were also evaluated less favorably than the control group (p<.01). Finally, segmenting the findings on the Candidate would NOT serve special interests outcome (Figure 3c) by whether the respondents viewed extra information suggests that
14
candidates in the “interest group” or mixture condition were generally viewed as much more likely to serve special interests, regardless of whether their partisan affiliation matched the respondent’s. As the top panes of Figure 3c indicate, same-party candidates in the “interest group” condition with no extra information (top-left) and with extra information (top-right) were judged as more likely to serve special interests than those in the control group (p<.001 for both), the “individual contributors” group (p<.001 for both), the self-financing group (p<.01 for both), and the “mixture” group (p<.05 for both). In addition, when no extra information was provided (top-left), same-party candidates in the “mixture” condition were deemed more likely to serve special interests than those in the “individual citizens” and self-funding conditions (p<.01 for both); however, neither of these differences remain statistically significant when respondents were shown extra biographical information (top-right pane). Interest-backed candidates of the opposite party (bottom panes) were also judged as more likely to serve special interests generally, regardless of whether they viewed extra information. Specifically, respondents believed that opposite-party candidates in the “interest groups” condition with no extra information (bottom-left) and with extra information (bottom -right) were more likely than the control group, the “individual contributor” group, and self-funders to serve special interests (p<.01 for all). As with same-party candidates, opposite-party candidates in the “mixture” condition were judged as more likely to serve special interests only when no extra information was provided. Specifically, opposite-party “mixture” candidates did worse than those in the control group, the “individual contributors” group, and self-financers when no extra information was provided to respondents (p<.05 for all). In short, regardless of the candidate’s partisan affiliation, the “mixture” treatment provided a cue to respondents about their willingness
15
to serve special interests, but unlike the “interest group” treatment, the effects of the “mixture” treatment dissipated with the provision of extra information. Taken together, a few points are worth stressing from the MTurk experiment. First, with regard to respondents’ intent to vote for the candidate, same-party voters preferred candidates with strong financial support from individual contributors, but only when no extra information was provided. Interest-backed opposite-party candidates fare particularly poorly with oppositeparty voters, a difference that endures regardless of whether the extra information was provided. Second, on the overall Candidate Evaluation Index, while candidates’ funding sources did little to affect their evaluation among co-partisan voters, opposite-party candidates supported by interest groups and a “mixture” of sources fared poorly, with differences apparent in both information conditions. Third, regardless of partisan affiliation or extra information provision, candidates who received a majority of their money from interest groups in the MTurk experiment were deemed more likely to serve special interests. While candidates in the “mixture” condition are also downgraded in this area, the fact that these differences dissipate when extra information is provided—while those for candidates in the “interest groups” condition endure—suggests that majority interest-group funding sends a clearer signal to voters about the candidates’ willingness to serve special interests. Fourth, self-financers fared well compared to (or were at least on par with) the other conditions, particularly when the candidate was of the opposite party of the respondent. One reason self-financers might have performed better in the MTurk experiment than the CCES experiment is by giving a specific dollar amount ($700,000) in the MTurk experiment respondents had a frame of reference they did not have in the CCES experiment, and that frame may have made the self-financing sound more reasonable and less like attempts to “buy” an election. We have no direct evidence for this supposition, but future work could
16
consider variation in the amount of self-financing to see if there is a threshold at which voters begin to become skeptical of such funding. More broadly, both the MTurk and CCES experiments suggest that party agreement between candidate and respondent affects the manner in which voters process information about a candidate’s funding portfolio. Discussion Mandated disclosure of funding sources has long been a cornerstone of American campaign finance law, and has gained renewed attention in the wake of Supreme Court decisions in recent campaign finance cases that have resulted in an environment in which independent groups can spend unlimited sums during American elections, sometimes without disclosing their donors (see: Kang 2010; Dowling and Miller 2014). To combat this new environment, nonpartisan reform groups such as the Sunlight Foundation have begun to petition Congress for reforms such as real-time electronic disclosure of contributions and/or mandated donor disclosure for “social welfare” or 501(c)3 organizations; as mentioned above, similar movements have also gained traction in a number of states.16 The assumption underlying such reforms, consistent with the Court’s position since Buckley v. Valeo 424 U.S. 1 (1976), is that knowledge of candidates’ financiers might be an important element in forming preferences about them. The results of our experiments suggest that voters may incorporate information about candidates’ funding sources in their judgments when such information is provided, and that the candidate’s partisan affiliation—relative to that of the voter—often moderates the manner in which this information is utilized. Our findings suggest that voters are likely to deem a candidate as beholden to “special interests” with the knowledge that the latter accepted a considerable sum 16
See petition at Sunlight Foundation Website (accessed July 23, 201)4: http://engage.sunlightfoundation.com/o/51051/p/dia/action3/common/public/?action_KEY=1087 8&killorg=True#CardlessCampaign
17
from interest groups, irrespective of their partisan agreement (see Figure 3c). However, party trumps information about funding sources with regard to both overall evaluation of the candidate and individuals’ intent to vote for him, especially when we provided extra biographical information in the MTurk experiment (see Figures 3a and 3b). When the candidate is a member of the voter’s preferred party, our findings are not as robust to the inclusion of the extra biographical information. When the candidate is not a member of the voter’s preferred party, however, out-party voters are less likely to vote for the candidate who takes a large amount of interest group contributions, even with the provision of the extra biographical information. The negative association between interest group funding and our outcome measures (including vote intent) for opposite-party candidates stands in contrast to the positive correlation between external (PAC) funding and vote share observed in previous observational work (Alexander 2005; Brown 2013). However, we believe that the negative effects of interest group support that we observe are likely outweighed by much stronger, positive ones resulting from candidate traits that are difficult to observe—namely, that interest groups contribute to candidates with a good chance of winning.17 In other words, we believe that the resolution to the dissonance between our experimental findings and those of observational studies in the area of interest financing is that both are probably correct. There is some risk of a backlash from taking PAC money, but the very fact that a candidate attracts large PAC contributions can be viewed as a proxy for inherent strength that generally makes such a risk worth bearing. 17
Respondents in our MTurk experiment appear to recognize the association between interest group funding and electoral success. On the item that asked whether the candidate “has a good chance of winning,” there was no statistically significant difference between the control group, individuals condition, or interest groups condition for any of our four blocks (2 party x 2 information). In other words, respondents seem to understand that an interest-backed candidate stood just as good a chance of winning as one primarily backed by individuals, but respondents were still less likely to vote for the interest-backed candidate (in Figure 3a).
18
It is important to note that as is the case with all research designs, our survey experiments have their limitations. Our study examines immediate responses to information about candidate funding sources and, in so doing, informs debates about the effect of money on politics. Although these initial reactions are important in advancing our understanding of voters’ preference formation, we cannot say how they are affected in the temporal context of a long political campaign. Nonetheless, we believe that our findings are valid with regard to assessing voter reaction to candidate funding sources. In particular, by providing raw dollar amounts and additional biographical information, the MTurk experiment delivers treatment in a setting designed to closely simulate the conditions in which a voter would encounter information about a candidate’s financial backers. Granted, the effects we observe in this lab setting could get “washed out” over the course of an actual campaign. However, they could also be larger, if candidates trumpet their funding sources—or those of their opponents—to a greater degree than our more subtle one-sentence treatments do. Future work could consider the consequences of repeat exposure to campaign finance information, and also include other sources of funding, such as public financing, or vary the amount of funds from the various sources to see if that matters for how individuals evaluate candidates. Nevertheless, the experiments reported above are informative with regard to how voters react to information about funding sources. Other recent research has shown that information about the specific source of interest group funds (e.g., labor or business) has consequences for how voters evaluate candidates (Sances 2013; also see Dowling and Wichowsky 2013, 2014; Ridout, Fowler, and Franz 2013). Coupled with those findings, our experiments suggest that if “real time disclosure” of campaign finance information is implemented, the resultant information about candidate funding sources has the potential to influence voters’ evaluations of candidates.
19
References Abramowitz, Alan I. 1991. “Incumbency, Campaign Spending, and the Decline of Competition in U.S. House Elections.” Journal of Politics 53(1): 34-56. Alexander, Brad. 2005. “Good Money and Bad Money: Do Funding Sources Affect Electoral Outcomes?” Political Research Quarterly 58(2): 353-358. Bedard, Paul. 2011 (June 2). “Obama Sends First 2012 Small Dollar Fundraising Appeal.” U.S. News. Accessed July 23, 2014 at: http://www.usnews.com/news/blogs/washingtonwhispers/2011/06/02/obama-sends-first-2012-small-dollar-fundraising-appeal Bowler, Shaun, and Jeffrey Karp. 2004. “Politicians, Scandals, and Trust in Government.” Political Behavior 26(3): 271-287. Brooks, Deborah Jordan, and Michael Murov. 2012. “Assessing Accountability in a Post-Citizens United Era: The Effects of Attack Ad Sponsorship by Unknown Independent Groups.” American Politics Research 40(3): 383-418. Brown, Adam R. 2013. “Does Money Buy Votes? The Case of Self-Financed Gubernatorial Candidates, 1998-2008.” Political Behavior 35(1): 21-41. Campaign Finance Institute. 2012. “Expenditures of House Incumbents and Challengers, by Election Outcome, 1974-2010.” Available at http://www.cfinst.org/data/pdf/VitalStats_t3.pdf. Cassie, William E., and Joel A. Thompson. 1998. “Patterns of PAC Contributions to State Legislative Candidates.” In Campaign Finance in State Legislative Elections, Joel A. Thompson and Gray F. Moncrief, eds. Washington, DC: Congressional Quarterly: 158-184. Dowling, Conor M., and Michael G. Miller. 2014. Super PAC! Money, Elections, and Voters After Citizens United. Routledge. Dowling, Conor M., and Amber Wichowsky. 2013. “Does It Matter Who’s Behind the Curtain? Anonymity in Political Advertising and the Effects of Campaign Finance Disclosure.” American Politics Research 41(6): 965-996. Dowling, Conor M., and Amber Wichowsky. 2014. “Attacks without Consequence? Candidates, Parties, Groups, and the Changing Face of Negative Advertising.” American Journal of Political Science DOI: 10.1111/ajps.12094. Dwyer, Devin. 2012. “Obama Trumps Romney With Small Donors.” ABCNews. Available at http://abcnews.go.com/blogs/politics/2012/02/obama-trumps-romney-with-small-donors/ (last accessed: July 20, 2014). Gerber, Alan. 2004. “Does Campaign Spending Work? Field Experiments Provide Evidence and Suggest New Theory.” American Behavioral Scientist 47(1): 541–574. Gross, Donald A., and Robert K. Goidel. 2003. The States of Campaign Finance Reform. Columbus: The Ohio State University Press. Herrnson, Paul S. 1992. “Campaign Professionalism and Fundraising in Congressional Elections.” Journal of Politics 54(3): 859-870. Herrnson, Paul S., and Stephanie Perry Curtis. 2011. “Financing the 2008 Congressional Elections.” In Financing the 2008 Election, David B. Magleby and Anthony Corrado, eds. Washington, D.C.: Brookings Institution Press. Jacobson, Gary C. 1990. “The Effects of Campaign Spending in House Elections: New Evidence for Old Arguments.” American Journal of Political Science 34(2): 334-362. Jacobson, Gary C. 2006. “Campaign Spending Effects in U.S. Senate Elections: Evidence from the National Annenberg Election Survey.” Electoral Studies 25(3): 195-226. Jacobson, Gary C. 2009. The Politics of Congressional Elections. 7th ed. New York: Addison Wesley. Kang, Michael S. 2010. “After Citizens United.” Indiana Law Review 44(1): 243-254. Krasno, Jonathan S., and Donald Philip Green.1988. “Preempting Quality Challengers in House Elections.” Journal of Politics 54(4): 920–36. Lott, John R. Jr. 2000. “A Simple Explanation For Why Campaign Expenditures Are Increasing: The Government Is Getting Bigger.” Journal of Law and Economics 43(2): 359-393.
20
Lupia, Arthur. 1994. “Shortcuts versus Encyclopedias: Information and Voting Behavior in California Insurance Reform Elections.” American Political Science Review 88(1):63-76. Lupia, Arthur, and McCubbins, Mathew D. 1998. The Democratic Dilemma: Can Citizens Learn What They Need to Know? New York, NY: Cambridge University Press. Maestas, Cherie D., and Cynthia R. Rugeley 2008. “Assessing the “Experience Bonus” Through Examining Strategic Entry, Candidate Quality, and Campaign Receipts in US House Elections.” American Journal of Political Science 52(2): 520-535. Popkin, Samuel L. 1991. The Reasoning Voter: Communication and Persuasion in Presidential Campaigns. Chicago, IL: Chicago University Press. Ridout, Travis N., Erika Franklin Fowler, and Michael Franz. 2013. “Are Interest Group Ads More Effective?” Presented at the Annual Meeting of the American Political Science Association. Sances, Michael W. 2013. “Is Money in Politics Harming Trust in Government? Evidence from Two Survey Experiments.” Election Law Journal 12(1): 53-73. Sniderman, Paul M., Richard A. Brody, and Philip E. Tetlock. 1991. Reasoning and Choice: Explorations in Political Psychology. New York, NY: Cambridge University Press. Snyder, James M. 1990. “Campaign Contributions as Investments: The U.S. House of Representatives, 1980-1986.” Journal of Political Economy 98(6): 1195-1227. Stratmann, Thomas. 1992. “Are Contributors Rational? Untangling Strategies of Political Action Committees.” Journal of Political Economy 100(3): 647-664. Thielemann, Gregory S., and Donald R. Dixon. 1994. “Explaining Contributions: Rational Contributors and the Elections for the 71st Texas House.” Legislative Studies Quarterly 19(4): 495-506. Thompson, Joel A., William Cassie, and Malcolm E. Jewell. 1994. “A Sacred Cow or Just a Lot of Bull? Party and PAC Money in State Legislative Elections.” Political Research Quarterly 47(1): 223237. Vavreck, Lynn, and Douglas Rivers. 2008. “The 2006 Cooperative Congressional Election Study.” Journal of Elections, Public Opinion and Parties 18(4): 355-366. Weber, Christopher, Johanna Dunaway, and Tyler Johnson. 2012. “It’s All in the Name: Source Cue Ambiguity and the Persuasive Appeal of Campaign Ads.” Political Behavior 34(3): 561-584.
21
Table 1. Experimental Designs and Question Wording Panel A. 2010 Cooperative Congressional Election Study (CCES) Vignette: Below is a short biography of a candidate for elective office whose name will remain anonymous.
{NAME DELETED} is a [Party treatment : Democratic / Republican / NONE] candidate for an open seat (that is, there is no incumbent running for reelection) to the [Office treatment : U.S. House of Representatives / U.S. Senate]. {NAME DELETED} is positioning himself as a political outsider who can change the way things are run in Washington. {NAME DELETED} is financing his campaign primarily with [Funding Source treatment: money he made in the private sector / money he inherited / contributions from individual citizens and interest groups / contributions from individual citizens]. {NAME DELETED} is married and has two children. Outcomes: Based on what you know about this candidate, how likely do you think you would be to vote for him in the upcoming (November 2010) election? (Response options: RULER WIDGET: Not very likely – Very likely.) And to what extent do you agree with each of the following statements? (Response options: Disagree strongly, Disagree moderately, Disagree a little, Neither agree nor disagree, Agree a little, Agree moderately, Agree strongly.) Statements : This candidate has the experience and skills necessary to represent me in Congress. This candidate stands a good chance of winning. This candidate understands issues that affect people like me. This candidate would represent me effectively. This candidate would focus on serving special interests. This candidate would do a good job as a representative. Note: Randomly assigned treatments shown in brackets. The order ofthe six outcome measures listed at the bottom of the table was randomized.
Panel B. 2012 Mechanical Turk Study (MTurk) Vignette: Below is a short biography of a candidate for Congress. We would like you to evaluate this candidate based on the short biography. Please read carefully, and then answer the questions about the candidate that appear on this page and the next page. {NAME DELETED} is a [Party treatment : Democratic / Republican] candidate for an open seat (that is, there is no incumbent running for reelection) to the U.S. Congress. {NAME DELETED} is positioning himself as a political outsider who can change the way things are run in Washington. {NAME DELETED} has raised about $1.3 million for his campaign. [Funding Source treatment: NONE / $700,000 of {NAME DELETED}’s campaign funding comes from his own money. / $700,000 of {NAME DELETED}’s campaign funding comes from contributions from interest groups. / $700,000 of {NAME DELETED}’s campaign funding comes from contributions from individual citizens. / {NAME DELETED}’s campaign is funded with a mixture of individual contributions, contributions from interest groups, and his own money.] [Extra Information treatment: NONE / {NAME DELETED} is a college graduate and small business owner. He has focused his campaign on economic issues such as growing the economy and reducing unemployment. He is married and has two children.] Outcomes: Based on what you know about this candidate, how likely do you think you would be to vote for him? (Response options: Very unlikely, Unlikely, Somewhat unlikely, Somewhat likely, Likely, Very likely.) And to what extent do you agree with each of the following statements? (Response options: Disagree strongly, Disagree moderately, Disagree a little, Neither agree nor disagree, Agree a little, Agree moderately, Agree strongly.) Statements : Note: Randomly assigned treatments shown in brackets. The order of the six outcome measures listed at the bottom of the table was randomized.
Figure 1. Effect of Funding Sources on Vote Intent CCES Experiment
0
0
0 Inds.
IGs.
Inherit. Private
Treatment Condition
Different Party Vote Intent (not very likely-very likely) 10 20 30 40 50 60 70 80 90 100
Same Party Vote Intent (not very likely-very likely) 10 20 30 40 50 60 70 80 90 100
Vote Intent (not very likely-very likely) 10 20 30 40 50 60 70 80 90 100
No Party Given
Inds.
IGs.
Inherit. Private
Treatment Condition
Inds.
IGs.
Inherit. Private
Treatment Condition
Note: Means with 95% confidence intervals. Treatment Conditions: Inds. = individual citizens; IGs. = individual citizens and interest groups; Inherit. = money he inherited; Private = money he made in the private sector. Source: 2010 CCES. See Table 1 for complete question wording.
Figure 2a. Effect of Funding Sources on Candidate Evaluations CCES Experiment Different Party
-1
-1
Index (Mean=0; SD=1) -.5 0 .5
Index (Mean=0; SD=1) -.5 .5 0
1
1
Same Party
Inds.
IGs.
Inherit.
Treatment Condition
Private
Inds.
IGs.
Inherit.
Private
Treatment Condition
Note: Means with 95% confidence intervals. Treatment Conditions: Inds. = individual citizens; IGs. = individual citizens and interest groups; Inherit. = money he inherited; Private = money he made in the private sector. Source: 2010 CCES. See Table 1 for complete question wording.
Figure 2b. Candidate Would NOT Serve Special Interests? Same Party
Inds.
IGs.
Inherit.
Treatment Condition
Private
NOT serve special interests (-3=Disagree str; 3=Agree str) 2 -1 0 1 -2
NOT serve special interests (-3=Disagree str; 3=Agree str) 2 -1 -2 0 1
CCES Experiment Different Party
Inds.
IGs.
Inherit.
Private
Treatment Condition
Note: Means with 95% confidence intervals. Treatment Conditions: Inds. = individual citizens; IGs. = individual citizens and interest groups; Inherit. = money he inherited; Private = money he made in the private sector. Source: 2010 CCES. See Table 1 for complete question wording.
Figure 3a. Effect of Funding Sources on Vote Intent MTurk Experiment Same Party, Extra Info
-2
-2
unlikely-likely -1 0 2 1
unlikely-likely -1 0 2 1
Same Party, No Extra Info
None
Inds.
IGs.
Self
Mix
None
IGs.
Self
Mix
Different Party, Extra Info unlikely-likely -2 -1 0 1 2
unlikely-likely -2 -1 0 1 2
Different Party, No Extra Info
Inds.
None
Inds. IGs. Self Treatment Condition
Mix
None
Inds. IGs. Self Treatment Condition
Note: Means with 95% confidence intervals. Treatment Conditions: None = control group; Inds. = individual citizens; IGs. = interest groups; Self = own money; Mix = mixture of three sources. Source: 2012 MTurk. See Table 1 for complete question wording.
Mix
Figure 3b. Effect of Funding Sources on Candidate Evaluations MTurk Experiment Same Party, Extra Info
Index (Mean=0; SD=1) -1 -.5 0 .5 1
Index (Mean=0; SD=1) -1 -.5 0 .5 1
Same Party, No Extra Info
Inds.
IGs.
Self
Mix
Different Party, No Extra Info
None
Inds. IGs. Self Treatment Condition
Mix
None
Index (Mean=0; SD=1) -1 -.5 0 .5 1
Index (Mean=0; SD=1) -1 -.5 0 .5 1
None
Inds.
IGs.
Self
Different Party, Extra Info
None
Inds. IGs. Self Treatment Condition
Note: Means with 95% confidence intervals. Treatment Conditions: None = control group; Inds. = individual citizens; IGs. = interest groups; Self = own money; Mix = mixture of three sources. Source: 2012 MTurk. See Table 1 for complete question wording.
Mix
Mix
Figure 3c. Candidate Would NOT Serve Special Interests? MTurk Experiment Same Party, Extra Info
-2
-2
disagree-agree -1 0 2 1
disagree-agree -1 0 2 1
Same Party, No Extra Info
None
Inds.
IGs.
Self
Mix
None
IGs.
Self
Mix
Different Party, Extra Info disagree-agree -2 -1 0 1 2
disagree-agree -2 -1 0 1 2
Different Party, No Extra Info
Inds.
None
Inds. IGs. Self Treatment Condition
Mix
None
Inds. IGs. Self Treatment Condition
Note: Means with 95% confidence intervals. Treatment Conditions: None = control group; Inds. = individual citizens; IGs. = interest groups; Self = own money; Mix = mixture of three sources. Source: 2012 MTurk. See Table 1 for complete question wording.
Mix
Supplementary Material for “Experimental Evidence on the Relationship between Candidate Funding Sources and Voter Evaluations”
This document contains supporting information for the paper, “Experimental Evidence on the Relationship between Candidate Funding Sources and Voter Evaluations.” The document consists of four sections:
Section 1 provides additional details on the samples and experimental designs. Section 2 provides all question wording and coding rules. Section 3 lists additional references cited in this document, but not the main text. Section 4 contains a series of supplementary tables.
1
1. Additional Details on the Samples and Experimental Designs To assess whether voters respond to information about candidates’ funding sources to evaluate candidates we conducted two survey experiments. Each study received human subjects approval from the human subjects committee at [institutions redacted]. The first experiment was included on the 2010 Cooperative Congressional Election Study (CCES). The second experiment used a convenience sample of US residents recruited using Amazon.com’s Mechanical Turk (MTurk) interface. Table 1 in the text describes the experimental design and provides question wording for each experiment. Here, we provide a more thorough discussion of each experiment. CCES Experiment The CCES was administered by YouGov/Polimetrix over the Internet, where respondents “opt-in” in order to participate. Polimetrix uses a combination of sampling and matching techniques to account for the fact that (opt-in) respondents may differ from the general population. This process is designed to approximate a random digit dialing (RDD) sample. The survey sample is constructed by first drawing a target population sample. This sample is based on the 2005-2006 American Community Study, November 2008 Current Population Survey, and the 2007 Pew Religious Life Survey. Thus, this target sample is representative of the general population on a broad range of characteristics including a variety of geographic (state, region, and metropolitan statistical area), demographic (age, race, income, education, and gender), and other measures (born-again status, employment, interest in news, party identification, ideology, and turnout). Polimetrix invited a sample of their opt-in panel of 1.4 million survey respondents to participate in the study. Invitations were stratified based on age, race, gender, education and by simple random sampling within strata. Those who completed the survey (approximately 1.5 times the target sample) were then matched to the target sample based on gender, age, race,
2
region, metropolitan statistical area, education, news interest, marital status, party identification, ideology, religious affiliation, frequency of religious services attendance, income, and voter registration status. Finally, weights were calculated to adjust the final sample to reflect the national public on these demographic and other characteristics. We do not use these weights because our randomization occurs within the selected sample. For more detailed information on this type of survey and sampling technique see Vavreck and Rivers (2008). More broadly, see AAPOR Executive Council Task Force (2010) for a report on the strengths and limitations of online panels. The CCES was fielded from 10/1/2010 to 11/1/2010. The experiment consisted of a brief vignette that provided a short biography of a fictitious candidate for the United States House of Representatives or Senate (randomly assigned with equal probability) whose party affiliation was randomly assigned with equal probability to be either Democratic or Republican, or left blank (i.e., no party).1 The primary manipulation of interest, however, was the candidate’s source of funding. There were four funding source treatments, each assigned with equal probability. Respondents were told that the candidate was “financing his campaign primarily with…” (1) “money he made in the private sector,” (2) “money he inherited,” (3) “contributions from individual citizens and interest groups,” or (4) “contributions from individual citizens.”
1
The CCES is a collaborative effort among researchers at a number of universities to create a large, national survey. Pooling their resources, researchers contribute to “common content,” or a set of questions that all respondents answer, followed by the “private content,” another set of questions specific to each individual team. Our survey experiment appeared on one of the private contents, and was completed by roughly 800 participants (see Table S1 for a complete participant flow diagram). 3
This design permits us to test whether and to what extent citizens respond to funding sources when evaluating candidates for office. We followed this vignette by asking several candidate evaluation questions. First, on the same page as the vignette, respondents were asked, “Based on what you know about this candidate, how likely do you think you would be to vote for him in the upcoming (November 2010) election?” Responses to this item (Vote Intent) were recorded on a scale ranging from 0 to 100, where 0 was labeled “not very likely” and 100 was labeled “very likely.” Respondents were then presented with a grid on the next page with the header text, “And to what extent do you agree with each of the following statements?”2 The statements (i.e., rows of the grid, the order of which was randomized) were designed to obtain more specific evaluations of the candidate. For example, we asked respondents whether they thought the candidate “has the experience and skills necessary to represent me in Congress” and “would focus on serving special interests.” The response options for these questions ranged from “disagree strongly” to “agree strongly” on a seven-point scale. Responses to these questions were scored so that positive evaluations of the candidate were given positive values and negative evaluations negative values, with “neither agree nor disagree” scored as 0, the midpoint of each -3 to +3 scale. A principal components factor analysis of these six items retained two factors, with all items except for “would focus on serving special interests” loading highest on a single factor. Therefore, we created a standardized index (mean=0; standard deviation=1) of the other five items, which refer to as the Candidate Evaluation Index (alpha = 0.93). We analyze the question about serving special interests (reverse-coded: Candidate would NOT serve special interests) separately. Table S2 in this document presents summary statistics for the outcome measures and 2
The full vignette also appeared at the top of this page. 4
demographic and political characteristics for the full CCES sample and for each funding source treatment condition.3 MTurk Experiment Amazon.com’s MTurk population is a convenience sample that appears more representative than student samples, but is not completely representative of the U.S. population. An MTurk sample is typically younger, less likely to own a home, more likely to self-identify as liberal and with the Democratic Party, and more likely to report no religious affiliation (Berkinsky, Huber, and Lenz 2012; also see Buhrmester, Kwang, and Gosling 2011 for a discussion of using MTurk to recruit participants for experiments). In their article, Berinsky, Huber, and Lenz (2012) illustrate MTurk’s usefulness for conducting experiments in several ways, chief among them by replicating important published experimental work that used both student and national samples (e.g., the General Social Surveys). The MTurk experiment was fielded from 1/23/2012 to 4/19/2012. Respondents were paid $0.35 to participate. Approximately 1,600 participants completed the survey (see Table S1 for a complete participant flow diagram). Like the CCES experiment, the MTurk experiment provided participants with a fictional vignette about a candidate for an open congressional seat. As before, we randomly assign the candidate’s partisan affiliation (Democratic or Republican) and various funding conditions. However, we make three changes to the design framework employed in the first two experiments. First, we provided participants with a specific amount of money raised ($700,000) from a 3
We tested for balance across funding source treatment conditions using a multinomial logit model with a nominal experimental treatment condition variable as the outcome. Covariates: gender, age, age-squared, race, education, income, political interest, marital status, religious attendance, ideology, and party identification. The p-value for the chi-squared test statistic was .511. We performed the same test for the party identification manipulation and the p-value was .301; for the House/Senate manipulation the p-value was .227. 5
randomly assigned source out of a total of $1.3 million for his campaign. Although this is a large sum of money, it is a fairly typical funding total for an open-seat candidate (Campaign Finance Institute 2012). The funding source treatment conditions were either that the candidate raised $700,000 from one of three possible sources (1) his own funds, (2) interest groups, or (3) individual contributions, or that his (4) “campaign is funded with a mixture of individual contributions, contributions from interest groups, and his own money.” Providing participants with dollar figures (as opposed to informing them directly about the “primary” source of the candidate’s funding as in the previous two experiments) requires them to make their own judgments about the extent to which various funding sources were important in the candidate’s funding portfolio, and is therefore a less overt expression of the candidate’s status as a “self-funded” or “interest-backed” politician. Second, we include an “extra information” condition in which participants randomly assigned to this condition read additional biographical material about the candidate, including his background as a business owner, status as a college graduate, and focus on growing the economy. Supplying this information at the end of the vignette more closely mimics the sort of background provided in a news story that a voter might encounter during a real-world election. Third, the design of MTurk includes a control condition that is not present in the other two experiments. (Thus, in all, there were five funding source conditions—one control condition plus the four treatment conditions). Participants assigned to the control condition saw only the
6
biographical information about the candidate; they received no information about the candidate’s funding sources. In providing no information about campaign funding, the control condition is likely to reflect the lack of knowledge that many voters might have of a typical candidate’s campaign finance sources, thereby providing a logical point of reference in the experimental design. The outcome measures used in the MTurk experiment were the same as those in the CCES experiment with one exception: Vote Intent was asked on a -3 to +3 scale, as opposed to the 0 to 100 ruler. Table S3 in this document presents summary statistics for the outcome measures and demographic and political characteristics for the full MTurk sample and for each of the five funding source treatment conditions.4
4
We tested for balance across the five funding source treatment conditions using a multinomial logit model with a nominal experimental treatment condition variable as the outcome. Covariates: gender, age, age-squared, race, education, and party identification. The p-value for the chi-squared test statistic was .441. We performed the same test for the party identification manipulation and the p-value was .669. For the extra information manipulation the p-value was .913. 7
2. Question Wording and Coding Rules CCES Experiment Vignette, Page 1 Below is a short biography of a candidate for elective office whose name will remain anonymous. {NAME DELETED} is a [Democratic / Republican / NONE] candidate for an open seat (that is, there is no incumbent running for reelection) to the [U.S. House of Representatives / U.S. Senate]. {NAME DELETED} is positioning himself as a political outsider who can change the way things are run in Washington. {NAME DELETED} is financing his campaign primarily with [money he made in the private sector / money he inherited / contributions from individual citizens and interest groups / contributions from individual citizens]. {NAME DELETED} is married and has two children. Based on what you know about this candidate, how likely do you think you would be to vote for him in the upcoming (November 2010) election? RULER WIDGET: Not very likely (0) – Very likely (100) [Vote Intent] Vignette, Page 2 (vignette still appears at top of page) Columns: (-3) Disagree strongly (-2) Disagree moderately (-1) Disagree a little (0) Neither agree nor disagree (1) Agree a little (2) Agree moderately (3) Agree strongly Rows (order randomized): This candidate has the experience and skills necessary to represent me in Congress. This candidate stands a good chance of winning. This candidate understands issues that affect people like me. This candidate would represent me effectively. This candidate would focus on serving special interests. (reverse-coded) This candidate would do a good job as a representative. ***A principal components factor analysis of these six items retained two factors, with all items except for “would focus on serving special interests” loading highest on a single factor. Therefore, we created a standardized index (mean=0; standard deviation=1) of the other five items—Candidate Evaluation Index (alpha = 0.93). We analyze the question about serving special interests (Candidate would NOT serve special interests) separately.
8
MTurk Experiment Vignette, Page 1 Below is a short biography of a candidate for Congress. We would like you to evaluate this candidate based on the short biography. Please read carefully, and then answer the questions about the candidate that appear on this page and the next page. {NAME DELETED} is a [Democratic / Republican] candidate for an open seat (that is, there is no incumbent running for reelection) to the U.S. Congress. {NAME DELETED} is positioning himself as a political outsider who can change the way things are run in Washington. {NAME DELETED} has raised about $1.3 million for his campaign. [NONE / $700,000 of {NAME DELETED}’s campaign funding comes from his own money. / $700,000 of {NAME DELETED}’s campaign funding comes from contributions from interest groups. / $700,000 of {NAME DELETED}’s campaign funding comes from contributions from individual citizens. / {NAME DELETED}’s campaign is funded with a mixture of individual contributions, contributions from interest groups, and his own money.] [NONE / {NAME DELETED} is a college graduate and small business owner. He has focused his campaign on economic issues such as growing the economy and reducing unemployment. He is married and has two children.] Based on what you know about this candidate, how likely do you think you would be to vote for him? Response Options [Vote Intent]: (-3) Very unlikely (-2) Unlikely (-1) Somewhat unlikely (0) Not sure (1) Somewhat likely (2) Likely (3) Very likely Vignette, Page 2 And to what extent do you agree with each of the following statements? Columns: (-3) Disagree strongly (-2) Disagree moderately (-1) Disagree a little (0) Neither agree nor disagree (1) Agree a little (2) Agree moderately (3) Agree strongly Rows (order randomized): This candidate has the experience and skills necessary to represent me in Congress. This candidate stands a good chance of winning. This candidate understands issues that affect people like me. This candidate would represent me effectively. 9
This candidate would focus on serving special interests. (reverse-coded) This candidate would do a good job as a representative. ***A principal components factor analysis of these six items retained two factors, with all items except for “would focus on serving special interests” loading highest on a single factor. Therefore, we created a standardized index (mean=0; standard deviation=1) of the other five items—Candidate Evaluation Index (alpha = 0.85). We analyze the question about serving special interests (Candidate would NOT serve special interests) separately.
10
3. Additional References AAPOR Executive Council Task Force. 2010. “Research Synthesis: AAPOR Report on Online Panels.” Public Opinion Quarterly 74(4): 711-781. Berinsky, Adam J., Gregory A. Huber, and Gabriel S. Lenz. 2012. “Using Mechanical Turk as a Subject Recruitment Tool for Experimental Research.” Political Analysis 20(3): 351-368. Buhrmester, Michael D., Tracy Kwang, and Samuel D. Gosling. 2011. “Amazon’s Mechanical Turk: A New Source of Inexpensive, yet High-Quality, Data?” Perspectives on Psychological Science 6(1): 3-5.
11
4. Supplementary Tables Table S1 – Participant Flow for Experiments Table S2 – Summary Statistics for Full Sample and by Funding Source Treatment Conditions (CCES Experiment) Table S3 – Summary Statistics for Full Sample and by Funding Source Treatment Conditions (MTurk Experiment) Table S4 – Means and Standard Errors by Funding Source Treatment Conditions and by Party Agreement between Respondent and Candidate (CCES Experiment) Table S5 – Means and Standard Errors by Funding Source Treatment Conditions and by Party Agreement between Respondent and Candidate (MTurk Experiment) Table S6 – Means and Standard Errors by Funding Source Treatment Conditions and by Party Agreement between Respondent and Candidate, Separately for Extra Information Conditions (MTurk Experiment)
12
Table S1. Participant Flow for Experiments CCES Experiment (10/1 – 11/1/10) Randomized (n=824) Allocated to Intervention (n=824) · Contributions from individuals (n=191) · Contributions from individuals and interest groups (n=215) · Inherited money (n=207) · Money made in the private sector (n=211) Analyzed (n=756; participants who answered all post-treatment outcome measures) · Contributions from individual citizens (n=182) · Contributions from individuals and interest groups (n=194) · Inherited money (n=183) · Money made in the private sector (n=197) MTurk Experiment (1/23 – 4/19/12) Randomized (n=1,658) Allocated to Intervention (n=1,658) · No mention of candidate funding (i.e., control) (n=361) · Contributions from individuals (n=316) · Contributions from interest groups (n=327) · Self-financing (n=332) · Mixture (n=322) Analyzed (n=1,463; participants who answered all post-treatment outcome measures) · No mention of candidate funding (i.e., control) (n=298) · Contributions from individuals (n=291) · Contributions from interest groups (n=297) · Self-financing (n=295) · Mixture (n=282) Note : See Tables S2 and S3 for summary statistics for the full sample and by treatment conditions.
Table S2. Summary Statistics for Full Sample and by Funding Source Treatment Conditions (CCES Experiment) Variable Vote intent (0=Not very likely; 100=Very likely) Candidate has experience and skills (-3=Disagree strongly; 3=Agree strongly) Candidate has good chance of winning (-3=Disagree strongly; 3=Agree strongly) Candidate understands issues (-3=Disagree strongly; 3=Agree strongly) Candidate would represent me effectively (-3=Disagree strongly; 3=Agree strongly) Candidate would do a good job (-3=Disagree strongly; 3=Agree strongly) Candidate Evaluation Index (M=0, SD=1; negative-positive) Candidate would NOT serve special interests (-3=Disagree strongly; 3=Agree strongly) Female (1=yes) Age (Years) Age-squared/100 Race: Black (1=yes) Race: Hispanic (1=yes) Race: Other Race (1=yes) Education (1=No HS; 6=Post-grad) Income (1=<10k; 14=>150k; 15=RF/Skipped) Income Missing Respondent's Party ID (-3=Str. Rep.; 0=Ind./Not sure; 3=Str. Dem.) Ideology (-3=very cons.; 0=moderate/not sure; +3=very lib.) Interest in News & Public Affairs (1=Hardly at all; 4=Most of the time) Married/Domestic Partnership (1=yes) Religious Attendance (1-6) Observations Note: Cell entries are means with standard deviations in brackets. Source: 2010 CCES Experiment.
Full Sample 49.564 [29.6467] -0.216 [1.6518] 0.351 [1.5467] -0.111 [1.7418] -0.242 [1.7088] -0.030 [1.6253] 0.000 [1] -0.061 [1.6817] 0.541 [.4986] 53.787 [14.4922] 31.028 [14.9874] 0.094 [.2919] 0.065 [.2464] 0.056 [.2292] 3.847 [1.3973] 9.452 [3.7988] 0.127 [.3332] 0.110 [2.1629] -0.406 [1.8329] 3.545 [.7869] 0.653 [.4762] 3.238 [1.6825] 756
Individual Citizens 53.121 [30.6631] -0.099 [1.7018] 0.302 [1.6086] 0.143 [1.6954] -0.066 [1.7671] 0.115 [1.6696] 0.086 [1.0263] 0.093 [1.7706] 0.473 [.5006] 53.769 [14.4979] 31.002 [14.769] 0.115 [.3204] 0.055 [.2285] 0.060 [.239] 3.973 [1.3843] 9.484 [3.8461] 0.137 [.3452] 0.154 [2.2517] -0.467 [1.8764] 3.566 [.7385] 0.643 [.4805] 3.209 [1.7242] 182
Individuals and Interest Groups 45.454 [28.3514] -0.381 [1.663] 0.155 [1.6779] -0.160 [1.6913] -0.449 [1.6758] -0.180 [1.633] -0.106 [1.0295] -0.263 [1.6471] 0.603 [.4905] 53.799 [14.0257] 30.900 [14.7532] 0.083 [.2758] 0.062 [.2415] 0.072 [.2594] 3.887 [1.3572] 9.629 [3.6] 0.134 [.3416] 0.052 [2.142] -0.449 [1.7245] 3.567 [.7537] 0.701 [.459] 3.314 [1.6348] 194
Inherited Money 48.913 [27.7113] -0.410 [1.5694] 0.470 [1.3168] -0.388 [1.7312] -0.339 [1.5777] -0.153 [1.4967] -0.075 [.8929] -0.104 [1.619] 0.563 [.4974] 53.071 [15.4689] 30.545 [15.8466] 0.126 [.3324] 0.087 [.2832] 0.066 [.2482] 3.738 [1.4092] 9.131 [3.9675] 0.120 [.3261] 0.186 [2.1377] -0.361 [1.8784] 3.421 [.9097] 0.639 [.4815] 3.235 [1.7366] 183
Private Sector Money 50.929 [31.3384] 0.020 [1.6412] 0.477 [1.5405] -0.041 [1.815] -0.112 [1.7865] 0.096 [1.68] 0.095 [1.0311] 0.036 [1.6793] 0.523 [.5008] 54.457 [14.0743] 31.626 [14.6875] 0.056 [.2302] 0.056 [.2302] 0.025 [.1577] 3.792 [1.4365] 9.548 [3.7963] 0.117 [.3219] 0.056 [2.1362] -0.350 [1.8638] 3.619 [.73] 0.629 [.4842] 3.193 [1.6485] 197
Table S3. Summary Statistics for Full Sample and by Funding Source Treatment Conditions (MTurk Experiment) Variable Vote intent (-3=very unlikely; +3=very likely) Candidate has experience and skills (-3=Disagree strongly; 3=Agree strongly) Candidate has good chance of winning (-3=Disagree strongly; 3=Agree strongly) Candidate understands issues (-3=Disagree strongly; 3=Agree strongly) Candidate would represent me effectively (-3=Disagree strongly; 3=Agree strongly Candidate would do a good job (-3=Disagree strongly; 3=Agree strongly) Candidate Evaluation Index (M=0, SD=1; negative-positive) Candidate would NOT serve special interests (-3=Disagree strongly; 3=Agree stron Female (1=yes) Age (Years) Age-squared/100 Race: Black (1=yes) Race: Hispanic (1=yes) Race: Other Race (1=yes) Education (1=No HS; 6=Post-grad) Respondent's Party ID (-3=Str. Rep.; 0=Ind./Not sure; 3=Str. Dem.) Observations Note: Cell entries are means with standard deviations in brackets. Source: 2012 MTurk Experiment.
Full Sample 0.137 [1.4445] -0.049 [1.2806] 0.582 [1.2732] 0.081 [1.4649] -0.158 [1.4143] 0.172 [1.255] 0.000 [1] -0.392 [1.351] 0.492 [.5001] 30.587 [11.8231] 10.752 [8.9582] 0.077 [.266] 0.050 [.2178] 0.121 [.3262] 3.908 [1.2962] 0.580 [1.8641] 1463
No Mention of Candidate Funding 0.181 [1.4381] -0.034 [1.284] 0.547 [1.2334] 0.178 [1.4766] -0.117 [1.3767] 0.305 [1.1652] 0.047 [.9812] -0.168 [1.3022] 0.564 [.4968] 31.000 [12.2823] 11.114 [9.2783] 0.081 [.2726] 0.047 [.212] 0.111 [.3143] 3.963 [1.2879] 0.554 [1.9347] 298
Individual Citizens 0.323 [1.4594] -0.076 [1.303] 0.636 [1.3511] 0.223 [1.4931] -0.041 [1.4545] 0.327 [1.3078] 0.082 [1.06] -0.065 [1.3992] 0.464 [.4996] 29.997 [11.5231] 10.321 [8.8234] 0.089 [.2857] 0.041 [.1992] 0.134 [.3413] 3.907 [1.3032] 0.567 [1.8189] 291
Interest Groups -0.269 [1.4824] -0.175 [1.2666] 0.623 [1.2409] -0.057 [1.509] -0.350 [1.4882] -0.094 [1.291] -0.129 [.9964] -0.997 [1.2879] 0.488 [.5007] 31.236 [12.1702] 11.233 [9.3978] 0.094 [.2927] 0.034 [.1807] 0.125 [.3308] 3.778 [1.2831] 0.583 [1.8474] 297
Self-financing 0.342 [1.3432] 0.129 [1.2924] 0.620 [1.2447] 0.136 [1.361] -0.017 [1.3463] 0.302 [1.2565] 0.103 [.9638] -0.186 [1.2355] 0.481 [.5005] 30.373 [11.7908] 10.611 [8.7224] 0.061 [.2398] 0.058 [.2334] 0.146 [.3535] 3.915 [1.3362] 0.637 [1.8518] 295
Mixture 0.110 [1.4187] -0.089 [1.2439] 0.479 [1.2965] -0.078 [1.464] -0.266 [1.3799] 0.018 [1.1945] -0.106 [.9791] -0.543 [1.3124] 0.461 [.4994] 30.298 [11.323] 10.457 [8.5367] 0.057 [.2318] 0.071 [.2572] 0.089 [.2847] 3.979 [1.2681] 0.560 [1.8765] 282
Table S4. Means and Standard Errors by Funding Source Treatment Conditions and by Party Agreement between Respondent and Candidate (CCES Experiment) Vote intent (0=Not very likely; 100=Very likely)
Candidate Evaluation Index (M=0, SD=1; negative-positive)
Candidate would NOT serve special interests (3=Disagree strongly; 3=Agree strongly)
Mean Std. Err. Mean Std. Err. Mean Std. Err. Overall Individual Citizens (N=182) 53.121 2.273 0.086 0.076 0.093 0.131 Individuals and Interest Groups (N=194) 45.454 2.036 -0.106 0.074 -0.263 0.118 Inherited Money (N=183) 48.913 2.048 -0.075 0.066 -0.104 0.120 Private Sector Money (N=197) 50.929 2.233 0.095 0.073 0.036 0.120 Mean Std. Err. Mean Std. Err. Mean Std. Err. Candidate's Party Not Revealed Individual Citizens (N=56) 56.554 3.604 0.193 0.119 0.357 0.211 Individuals and Interest Groups (N=53) 49.717 3.007 0.116 0.107 -0.113 0.167 Inherited Money (N=61) 50.672 3.424 0.116 0.111 0.098 0.192 Private Sector Money (N=77) 57.831 2.886 0.242 0.111 0.312 0.165 Mean Std. Err. Mean Std. Err. Mean Std. Err. Candidate's Party Same as Respondent's Party Individual Citizens (N=53) 73.830 2.904 0.780 0.103 0.623 0.241 Individuals and Interest Groups (N=55) 67.673 2.873 0.483 0.115 -0.073 0.196 Inherited Money (N=54) 59.981 3.552 0.238 0.095 0.148 0.200 Private Sector Money (N=46) 69.630 3.963 0.742 0.119 0.283 0.234 Mean Std. Err. Mean Std. Err. Mean Std. Err. Candidate's Party Differs from Respondent's Party -0.506 0.121 -0.774 0.205 Individual Citizens (N=62) 33.210 3.590 Individuals and Interest Groups (N=62) 25.871 3.212 -0.776 0.134 -0.371 0.268 Inherited Money (N=53) 35.208 3.855 -0.651 0.126 -0.585 0.256 Private Sector Money (N=52) 23.212 3.333 -0.761 0.114 -0.731 0.275 Note: Cell entires are means with standard errors in italics. See Supplementary Material and main document for complete question wording.
Candidate has experience and skills (3=Disagree strongly; 3=Agree strongly) Mean -0.099 -0.381 -0.410 0.020 Mean 0.018 -0.038 -0.066 0.130 Mean 0.962 0.455 0.037 0.870 Mean -0.984 -1.387 -1.302 -1.096
Std. Err. 0.126 0.119 0.116 0.117 Std. Err. 0.206 0.187 0.178 0.187 Std. Err. 0.177 0.199 0.191 0.201 Std. Err. 0.206 0.207 0.225 0.210
Candidate has good chance of winning (3=Disagree strongly; 3=Agree strongly) Mean 0.302 0.155 0.470 0.477 Mean 0.429 0.453 0.525 0.636 Mean 0.943 0.873 0.778 1.261 Mean -0.129 -0.661 -0.019 -0.365
Std. Err. 0.119 0.120 0.097 0.110 Std. Err. 0.213 0.197 0.153 0.171 Std. Err. 0.195 0.198 0.160 0.180 Std. Err. 0.197 0.236 0.204 0.213
Candidate understands issues (-3=Disagree strongly; 3=Agree strongly) Mean 0.143 -0.160 -0.388 -0.041 Mean 0.304 0.132 -0.033 0.221 Mean 1.208 0.709 0.056 0.913 Mean -0.774 -1.145 -1.340 -1.423
Std. Err. 0.126 0.121 0.128 0.129 Std. Err. 0.189 0.173 0.214 0.202 Std. Err. 0.173 0.192 0.199 0.201 Std. Err. 0.216 0.230 0.248 0.225
Candidate would represent me effectively (3=Disagree strongly; 3=Agree strongly) Mean -0.066 -0.448 -0.339 -0.112 Mean 0.036 -0.075 -0.016 0.143 Mean 1.151 0.527 0.296 1.043 Mean -1.097 -1.548 -1.377 -1.654
Std. Err. 0.131 0.120 0.117 0.127 Std. Err. 0.204 0.172 0.188 0.183 Std. Err. 0.183 0.187 0.160 0.211 Std. Err. 0.208 0.210 0.221 0.198
Candidate would do a good job (-3=Disagree strongly; 3=Agree strongly) Mean 0.115 -0.180 -0.153 0.096 Mean 0.393 0.132 0.180 0.390 Mean 1.226 0.727 0.315 1.087 Mean -0.968 -1.177 -1.019 -1.308
Std. Err. 0.124 0.117 0.111 0.120 Std. Err. 0.183 0.175 0.179 0.167 Std. Err. 0.159 0.177 0.154 0.206 Std. Err. 0.203 0.221 0.223 0.199
Table S5. Means and Standard Errors by Funding Source Treatment Conditions and by Party Agreement between Respondent and Candidate (MTurk Experiment) Vote intent (-3=very unlikely; 3=very likely)
Candidate Evaluation Index (M=0, SD=1; negative-positive)
Candidate would NOT serve special interests (3=Disagree strongly; 3=Agree strongly)
Mean Std. Err. Mean Std. Err. Mean Std. Err. Overall No Mention of Candidate Funding (N=298) 0.181 0.083 0.047 0.057 -0.168 0.075 Primary Source Individuals (N=291) 0.323 0.086 0.082 0.062 -0.065 0.082 Primary Source Interest Groups (N=297) -0.269 0.086 -0.129 0.058 -0.997 0.075 Primary Source Self-financing (N=295) 0.342 0.078 0.103 0.056 -0.186 0.072 Mixture (N=282) 0.110 0.084 -0.106 0.058 -0.543 0.078 Mean Std. Err. Mean Std. Err. Mean Std. Err. Candidate's Party Same as Respondent's Party No Mention of Candidate Funding (N=132) 0.780 0.086 0.375 0.068 -0.106 0.100 Primary Source Individuals (N=128) 0.938 0.100 0.417 0.082 0.109 0.120 Primary Source Interest Groups (N=119) 0.437 0.104 0.249 0.076 -1.042 0.110 Primary Source Self-financing (N=125) 0.728 0.104 0.241 0.071 -0.096 0.099 Mixture (N=137) 0.788 0.088 0.219 0.073 -0.453 0.110 Mean Std. Err. Mean Std. Err. Mean Std. Err. Candidate's Party Differs from Respondent's Party No Mention of Candidate Funding (N=130) -0.385 0.138 -0.248 0.092 -0.246 0.130 Primary Source Individuals (N=117) -0.308 0.142 -0.303 0.104 -0.188 0.140 -0.993 0.119 Primary Source Interest Groups (N=135) -1.007 0.126 -0.521 0.089 Primary Source Self-financing (N=130) -0.115 0.130 -0.055 0.095 -0.323 0.120 Mixture (N=107) -0.748 0.147 -0.571 0.100 -0.654 0.137 Note: Cell entires are means with standard errors in italics. See Supplementary Material and main document for complete question wording.
Candidate has experience and skills (3=Disagree strongly; 3=Agree strongly) Mean -0.034 -0.076 -0.175 0.129 -0.089 Mean 0.227 0.250 0.193 0.304 0.263 Mean -0.285 -0.427 -0.578 -0.077 -0.551
Std. Err. 0.074 0.076 0.073 0.075 0.074 Std. Err. 0.094 0.110 0.098 0.100 0.088 Std. Err. 0.126 0.122 0.112 0.122 0.133
Candidate has good chance of winning (3=Disagree strongly; 3=Agree strongly) Mean 0.547 0.636 0.623 0.620 0.479 Mean 0.803 0.852 0.899 0.648 0.664 Mean 0.308 0.316 0.415 0.615 0.271
Std. Err. 0.071 0.079 0.072 0.072 0.077 Std. Err. 0.107 0.112 0.106 0.097 0.112 Std. Err. 0.105 0.135 0.111 0.119 0.127
Candidate understands issues (-3=Disagree strongly; 3=Agree strongly) Mean 0.178 0.223 -0.057 0.136 -0.078 Mean 0.598 0.672 0.403 0.232 0.292 Mean -0.185 -0.333 -0.607 -0.023 -0.692
Std. Err. 0.086 0.088 0.088 0.079 0.087 Std. Err. 0.099 0.122 0.123 0.107 0.110 Std. Err. 0.143 0.142 0.131 0.130 0.150
Candidate would represent me effectively (3=Disagree strongly; 3=Agree strongly) Mean -0.117 -0.041 -0.350 -0.017 -0.266 Mean 0.394 0.367 0.185 0.208 0.226 Mean -0.538 -0.479 -0.889 -0.238 -0.953
Std. Err. 0.080 0.085 0.086 0.078 0.082 Std. Err. 0.096 0.114 0.118 0.100 0.101 Std. Err. 0.127 0.139 0.135 0.134 0.139
Candidate would do a good job (-3=Disagree strongly; 3=Agree strongly) Mean 0.305 0.326 -0.094 0.302 0.018 Mean 0.614 0.711 0.277 0.504 0.350 Mean 0.008 -0.060 -0.489 0.054 -0.495
Std. Err. 0.067 0.077 0.075 0.073 0.071 Std. Err. 0.086 0.097 0.097 0.095 0.084 Std. Err. 0.110 0.127 0.124 0.122 0.130
Table S6. Means and Standard Errors by Funding Source Treatment Conditions and by Party Agreement between Respondent and Candidate, Separately for Extra Information Conditions (MTurk Experiment) Vote intent (-3=very unlikely; 3=very likely)
Candidate Evaluation Index (M=0, SD=1; negative-positive)
Candidate would NOT serve special interests (3=Disagree strongly; 3=Agree strongly)
Candidate has experience and skills (3=Disagree strongly; 3=Agree strongly)
Candidate has good chance of winning (3=Disagree strongly; 3=Agree strongly)
Candidate understands issues (-3=Disagree strongly; 3=Agree strongly)
Candidate would represent me effectively (3=Disagree strongly; 3=Agree strongly)
Candidate would do a good job (-3=Disagree strongly; 3=Agree strongly)
No Extra Information Given Candidate's Party Same as Respondent's Party No Mention of Candidate Funding (N=63) Primary Source Individuals (N=65) Primary Source Interest Groups (N=60) Primary Source Self-financing (N=72) Mixture (N=73) Candidate's Party Differs from Respondent's Party No Mention of Candidate Funding (N=68) Primary Source Individuals (N=61) Primary Source Interest Groups (N=63) Primary Source Self-financing (N=65) Mixture (N=56)
Mean 0.556 1.000 0.217 0.542 0.616 Mean -0.691 -0.377 -1.238 -0.585 -1.071
Std. Err. 0.128 0.152 0.165 0.127 0.120 Std. Err. 0.203 0.203 0.182 0.190 0.202
Mean 0.196 0.314 0.015 0.084 0.095 Mean -0.527 -0.309 -0.632 -0.318 -0.737
Std. Err. 0.086 0.102 0.110 0.077 0.101 Std. Err. 0.129 0.141 0.140 0.125 0.135
Mean Std. Err. Mean -0.286 0.123 0.175 0.062 0.164 -0.062 -1.283 0.161 0.100 -0.042 0.132 0.208 -0.616 0.143 0.137 Mean Std. Err. Mean -0.250 0.187 -0.632 -0.164 0.197 -0.361 -1.048 0.197 -0.603 -0.277 0.165 -0.385 -0.804 0.183 -0.786 Extra Information Given
Mean Std. Err. Mean Std. Err. Mean Std. Err. Candidate's Party Same as Respondent's Party No Mention of Candidate Funding (N=69) 0.986 0.112 0.539 0.101 0.058 0.153 Primary Source Individuals (N=63) 0.873 0.131 0.524 0.128 0.159 0.177 Primary Source Interest Groups (N=59) 0.661 0.122 0.487 0.095 -0.797 0.143 Primary Source Self-financing (N=53) 0.981 0.169 0.455 0.126 -0.170 0.152 Mixture (N=64) 0.984 0.127 0.360 0.103 -0.266 0.169 Mean Std. Err. Mean Std. Err. Mean Std. Err. Candidate's Party Differs from Respondent's Party No Mention of Candidate Funding (N=62) -0.048 0.177 0.058 0.119 -0.242 0.181 Primary Source Individuals (N=56) -0.232 0.201 -0.297 0.156 -0.214 0.202 Primary Source Interest Groups (N=72) -0.806 0.173 -0.423 0.112 -0.944 0.144 Primary Source Self-financing (N=65) 0.354 0.157 0.207 0.138 -0.369 0.175 Mixture (N=51) -0.392 0.204 -0.389 0.145 -0.490 0.205 Note: Cell entires are means with standard errors in italics. See Supplementary Material and main document for complete question wording.
Mean 0.275 0.571 0.288 0.434 0.406 Mean 0.097 -0.500 -0.556 0.231 -0.294
Std. Err. 0.127 0.145 0.155 0.112 0.124 Std. Err. 0.183 0.153 0.179 0.168 0.167
Mean 0.730 0.954 0.867 0.389 0.507 Mean 0.191 0.426 0.444 0.492 0.161
Std. Err. 0.152 0.149 0.151 0.116 0.156 Std. Err. 0.163 0.180 0.176 0.164 0.171
Mean 0.206 0.385 -0.017 0.056 0.082 Mean -0.515 -0.377 -0.841 -0.369 -0.929
Std. Err. 0.124 0.174 0.179 0.133 0.140 Std. Err. 0.202 0.186 0.187 0.151 0.205
Mean 0.190 0.369 -0.283 0.069 0.151 Mean -0.926 -0.623 -1.127 -0.523 -1.125
Std. Err. 0.122 0.146 0.167 0.119 0.143 Std. Err. 0.168 0.192 0.198 0.177 0.184
Mean 0.365 0.646 0.017 0.347 0.260 Mean -0.294 -0.098 -0.635 -0.277 -0.625
Std. Err. 0.118 0.127 0.138 0.119 0.112 Std. Err. 0.153 0.170 0.188 0.163 0.172
Std. Err. 0.137 0.156 0.119 0.182 0.123 Std. Err. 0.160 0.192 0.141 0.170 0.206
Mean 0.870 0.746 0.932 1.000 0.844 Mean 0.435 0.196 0.389 0.738 0.392
Std. Err. 0.150 0.168 0.149 0.152 0.158 Std. Err. 0.127 0.203 0.142 0.173 0.190
Mean 0.957 0.968 0.831 0.472 0.531 Mean 0.177 -0.286 -0.403 0.323 -0.431
Std. Err. 0.139 0.163 0.151 0.174 0.170 Std. Err. 0.193 0.219 0.182 0.205 0.217
Mean 0.580 0.365 0.661 0.396 0.313 Mean -0.113 -0.321 -0.681 0.046 -0.765
Std. Err. 0.144 0.176 0.144 0.169 0.142 Std. Err. 0.178 0.202 0.181 0.197 0.209
Mean 0.841 0.778 0.542 0.717 0.453 Mean 0.339 -0.018 -0.361 0.385 -0.353
Std. Err. 0.118 0.149 0.129 0.153 0.126 Std. Err. 0.149 0.192 0.165 0.174 0.196