Evolution of Student Knowledge in a Traditional Introductory Classroom Eleanor C Sayre and Andrew F Heckler Department of Physics, Ohio State University, Columbus, Ohio 43201 Abstract. In the physics education research community, a common format for evaluation is pre- and post-tests. In this study, we collect student test data many times throughout a course, allowing for the measurement of the changes of student knowledge with a time resolution on the order of a few days. The data cover the first two quarters (mechanics, E&M) of a calculus-based introductory sequence populated primarily by first- and second-year engineering majors. To avoid the possibility of test-retest effects, separate and quasi-random subpopulations of students are evaluated every week of the quarter on a variety of tasks. Unsurprisingly for a traditional introductory course, there is little change on many conceptual questions. However, the data suggest that some student ideas peak and decay rapidly during a quarter, a pattern consistent with memory research yet unmeasurable by pre-/post-testing. Keywords: cognitive modeling, introductory students, electrostatics, testing PACS: 01.30.lb, 01.40.Fk, 01.40.Ha
INTRODUCTION In Physics Education Research, a common method to assess instruction is pre/post testing. In large introductory classes, these assessments often take the form of multiple-choice single-response concept inventories or surveys. Instruments are administered at the beginning of the term and again at the end of the term. Some popular tests[1, 2, 3, 4, 5] have been administered to many students at multiple institutions[6]. Recent studies[7] suggest that student performance is extremely sensitive to when tests are administered. A pretest date difference of a few days at the start of a term can have dramatic effects on pretest score. In psychology, three well-known effects contribute to how students score on a given instrument: learning, forgetting, and interference. Learning curves, such as those predicted by the Rescorla-Wagner model[8], show that for repeated training, scores will increase quickly at first, then level off. Forgetting curves, such as those studied by Ebbinghaus[9], predict that scores will exponentially decay after training stops, eventually reaching a new minimum value. Interference, another well-studied phenomenon, suggests that learning about new content will decrease scores on related prior content as the new ideas “interfere” with the old ones[10]. While important and fundamental, these three effects have never been studied in combination in physics education research. In this study, we have three basic questions. When (if ever) do students learn material? How (if at all) are changes related to course events like lecture, homework, or exams? How can we use results from cognitive science to model these changes? This fundamental research
can provide better resolution into student learning than pre/post testing. Here, we present only the data from one task which demonstrates the effects of learning, decay and interefence in one question; preliminary data from other tasks also indicate the presence of these effects.
RESEARCH SETTING The data presented in this paper were taken in Spring 2008, during the second quarter (of three) of a traditional calculus-based introductory physics sequence taken primarily by first-year non-honors engineering students at The Ohio State University. The course covers electricity and magnetism in a typical syllabus. Spring 2008 was an “off-sequence” class, and was taken by about 300 students in two lecture sections. The class used WebAssign for homework. As an additional part of their homework grade, each student was required to visit our research lab for a single, one hour session during the quarter. During the session, each student took a variety of paper- and computer-based assessments on topics drawn from the syllabus. Students were solicited for flexible homework by course lab sections. About 95% of students in the class participated, and there is no correlation between final grade in class and date of flexible homework session. Because each student only visited our lab once, our data are primarily between-student, not longitudinal tracking of individuals over time. Not all students take every task. The between-student nature of our data avoids the risk that individual students may change their answers on an assessment because of task familiarity.
0 0
0 0
B is b
1 1
B is a*
0 0
A is e
A is d
0 0
25
A is c*
9
Field lines
A is b
1 9
Field in conductor
A is a
percent correct
number in week
1 25
Last in week
QC a a
number
c b
Charge in uniform field
0 0
0 1
40%
B is a*
B is b
B is a*
B is b
responses
B is b
Field lines
A is e
B is a*
B is b
A is e
B is a*
B is b
1 5 1 6 2 7 2 7 0 3 3 2 0 56% 0 11% 5 67% 4 11% 9% 1 43% 3 22% 7 39% 8 0 3 3 4 4 7 8 3 4 4 6 8 0 5 9 6 3 6 5 16 1 2 8 1 2 4 4 6 1 8 7 6 3 4 6 12 1 2 6 3 0 1 1 4 A is e
A is c*
A is b
A is a
Number in group
Group
percent by half week
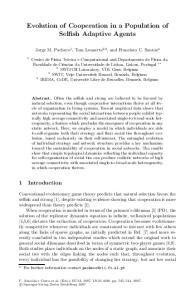
that dip, two incorrect answers increase: option B (constant velocity) and option E (remains at rest). Throughout, option D, that the charge has linearly changing acceleration, remains quite low. Because of the forest of data points on these curves and the monochromatic na5 9 0% 0% 33% ture of these proceedings, we do not show bars on 8 14 error 0% 29% 7% 9.5 9 11% 33% 22% this graph (see Figure 4 for bars). 13.5 10 0% 0% 100% To explore these features we 15 of the response 15 13%curve, 7% 53% 19.5 model for response 8 13% 0% first discuss a mathematical to 50% in23 20 0% 5% 40% struction, and then relate the 11% correct 24.5the response19to 5% 37% 28 20 0% 25% 50% choice to simulation. 29.5 25 12% 8% 44%
A is e
23 20 0 1 8 24.5 19 1 2 7 28 20 0 5 10 3 will 2 re11 towards option E, which29.5 states that the 25 charge 33 13 1 3 6 main at rest. However, on34.5 QD 13 there is15a sharp in8 0 peak 1 38 18 0 the correct answer, after which it decays rapidly and134stays58 39.5 28 0 16 0 5 with8 constant except for a dip 43 near QD 37. Concurrent 44.5 9 0 2 6
67% 50% 22% 40% 53% 50% 15% 0 42% 1 30% 64% 8% 40% 33% 43% 19% 44%
A is d
3
11% 14% 33% 50% 47% 38% 40% 0 32% 0 45% 20% 62% 27% 39% 21% 38% 11%
6
A is d
A is b
A is a
A is c*
0
A is e
A is c*
0
8 14 0 10,4about1 FIGURE 2. Responses by day to CSEM question 9.5 9 1 3 2 movement of a charge in a 13.5 uniform electric field. The correct 10 0 0 33% 10 1 9 0% 0% answer, that a charge at placed at rest 2will15 constant 23have 4% 15 2 a 30% 1 13% 8 19.5 8 1 0 4 acceleration, is shown in bold.
56% 50% 33% 0% 20% 38% 35% 0 21% 0 25% 24% 15% 27% 44% 14% 13% 11%
1
A is d
A is c*
A is b
9
50
11% 14% 0% 0% 7% 0% 20% 0 21% 0 0% 12% 8% 13% 6% 11% 6% 0%
5
A is d
A is b
A is a
40
A is d
Charge in uniform field
A is b
A is a
5
A is a
20 30 quarter day
9 0% 0% 33% 14 0% 29% aA is a 7% 9 11% 33% bA is b 22% 10 0% c* 0% 100% A is c* 15 13% d7% 53% A is d 8 13% 0% 50% eA is e 20 0% 5% 40% 0 11% 0 37% 1 19 5% 25 0 0 50% 1 20 0% 25% 25 12% 8% 44% 13 8% 23% 46% 15 0% 7% 53% 18 0% 22% 28% 28 0% 46% 29% 16 0% 31% 50% 9 0% 22% 67% 248
Number innumber group in week
10
Last in week
0
Last in week
0%
Group
percent count by half week by week
20%
Quarter week
40%
QC
c b
number
501 c 4507 c
QB
QA
SID
Version
80%
5v1.0 5v1.060%
5 Charge 8 in E-Field 9.5 13.5 15 19.5 23 a 1 1 24.5 a 25 9 9 28 29.5 33 34.5 38 39.5 43 44.5
Number in group number in week
Group
100%
1
B is b
3
FIGURE 1. Correct responses by day to all questions on the Electrostatics Task. Note that the “charge in E-field” question has a sharp spike on QD13, and the others do not.
B is a*
50
0
A is e
0
A is d
40
9
A is c*
20 30 quarter day
A is b
10
A is a
0
Group
0%
Number in group
20%
5 percent by half week
The first question on the electrostatics task asks students about the subsequent movement of a charge placed at rest in a uniform electric field. The correct answer – the charge will have a constant acceleration – can be found by relating the electric field to the electric force ~e = q~E), and then applying Newton’s Second Law (F ~e = m~a). Instruction on electric fields started on (Σ~F = F QD 5, the first day for which we have data. Figure 2 shows the responses to this question. The correct answer is shown in bold. Because all answer choices are shown, responses sum to 100%. Initially, students choose all answers about equally, with a slight preference
501 c 4507 c
QB
count by half week
Charge in Uniform Field
SID
5v1.0 5v1.060%
RESPONSE CURVES As might be expected for thematically related questions, the proportion of correct responses on the three electrostatics questions were somewhat similar (Figure 1), with a overall average score of 39% and about 10% of students getting all three correct (chance < 1%). In accordance with historical data on these questions, the average gain is about 0.2. However, the curves show interesting structure not measured by pre/post testing. The structure is most dramatic on the first question about charge in an uniform electric field, and we will focus the following discussion on responses to this question and their relation to course events.
80%
QA
Version
We are interested in changes in student knowledge over the quarter. Because of the length restrictions in these proceedings, we report on only one task (of many in this study): the “Electrostatics” task, which was composed of three questions from the Conceptual Survey of Electricity and Magnetism[11] (CSEM) and generally took students 5-10 minutes to complete. From historical pre-post data for this population, we selected CSEM questions which had large absolute gains and which were thematically related. The task had (in order) CSEM questions 10 (g = 0.19), 15 (g = 0.22), and 13 (g = 0.20), which are about the electric force on a charge in a uniform field, electric field lines and negative charges, and the electric field inside a conductor (respectively). Over the quarter, 248 students took this task, starting on quarter day 5 (QD 5) (the end of the first week) and ending on QD 45 (the end of the ninth week). We did not collect any data in the tenth week (last week of class) of the quarter.
Electrostatics correct answers
100%
Quarter week
Task design
11% 14% 0% 0% 7% 0% 20% 21% 0% 12%
56% 50% 33% 0% 20% 38% 35% 21% 25% 24%
11% 14% 33% 50% 47% 38% 40% 32% 45% 20%
67% 50% 22% 40% 53% 50% 15% 42% 30% 64%
decay constant peak final1 height stimulus time delay
delay
4
15 5 1 0 0 0 start d theory 0.3 0.15 0 windows 0 0 windo 11.50 37 17 experiment 30 0 2 1 0 0 0 0.8 Responses time stimulus previous reference response response response response response 0.6 0 0 0.15 0 0 0 0 0 0.15 0.25 0 0.15 0 0 0 0 0 0.15 0.5 0 0.15 0 0 0 0 0 0.15 0.4 0.75 0 0.15 0 0 0 0 0 0.15 1 0 0.15 0 0 0 0 0 0.15 1.25 0 0.15 0 0 0 0 0 0.15 0.2 1.5 0 0.15 0 0 0 0 0 0.15 1.75 0 0.15 0 0 0 0 0 0.15 0 2 0 0.15 0 0 0 0 0 0.15 0 10 20quarter day30 40 50 2.25 0 0.15 0 0 0 0 0 0.15 2.5 0 0.15 0 0 0 0 0 0.15 2.75Correct 0 0.15 0 uniform 0 field 0 question 0 com0 0.15 FIGURE 4. response to 3 0 0.15 0 0 0 0 bars. 0 0.15 pared with simulation. Data are shown with vertical error 3.25 0 0.15 0 0 0 0 0 0.15 The simulated response is shown as a solid line. Horizontal 3.5 0 0.15 0 0 0 0 0 0.15 windows mark the windows over which the simulation was 3.75 0 0.15 0 0 0 0 0 0.15 averaged and 4correspond to data 0collection 0 0.15 0 times. 0 0 0 0.15 4.25 0 0.15 0 0 0 0 0 0.15 4.5 0 0.15 0 0 0 0 0 0.15 4.75 0 0.15 0 0 0 0 0 0.15 ing as a delta5 function and the0 initial0 response as 0a linear 0 0.15 0 0 0.15 5.25three0 reasons. 0.15 0 0 0.15 function for First, a 0linear 0model0is sim0 0.15 one. 0Second, 0 with 0 the data 0 0 0.15 pler than a5.5logarithmic we 5.75 0 0.15 0 0 0 0 0 0.15 collect, we are unlikely to distinguish well between lin6 0 0.15 0 0 0 0 0 0.15 ear and logarithmic Third, it0is possible to0 model 6.25 0 models. 0.15 0 0 0 0.15 6.5 0–0.15 0 0 0 0.15 repeated teaching like that0modeled by0the Rescorla6.75 0 0.15 0 0 0 0 0 0.15 Wagner model – as a series of0delta functions with corre7 0 0.15 0 0 0 0 0.15 spondingly small 0individual responses. 7.25 0.15 0 0 0 0 0 0.15 7.5 0 0.15 0 0 0 0 0 0.15 7.75 0 0.15 0 0 0 0 0 0.15 8 0 0.15 0 0 0 0 0 0.15 8.25 0 0.15 0 0 0 0 0 0.15 8.5 0 0.15 0 0 0 0 0 0.15 8.75 0 0.15 0 0 0 0 0 0.15 In connecting with experimental it 9 0simulation 0.15 0 0 0 0data, 0 0.15 9.25to consider 0 0.15 when 0 and0 how often 0 0 0 0.15 is important data are 9.5 match 0 0.15 0 with0 experimental 0 0 0.15 collected. To simulated0 curves 9.75 0 0.15 0 0 0 0 0 0.15 data, we build all 10 collection 0 0.15 “windows” 0 0 which 0 average 0 0 0.15 simulated scores 0within of0 the nature of 10.25 0.15 them. 0 Because 0 0 0 0.15 responses
decay constant
1
Charge in uniform E-Field 0.85 -0.25
initial height time of intervention
final height
initial offset
1
FIGURE 3. A simulated response to teaching. The curve has five parameters: intervention onset time, initial height, delay between intervention and peak, exponential decay constant, and final height.
Simulation With quantitative data, it is desirable to develop a functional model. We introduce the following toy model which is based on the fundamental cognitive mechanisms of learning, memory decay and intereference. We model a possible response to a single intervention (Figure 3) with five parameters. An intervention is modeled as a delta function (not shown), immediately after which the response climbs to an initial height, reaching a maximum after some delay. After reaching a peak, it decays in accordance with memory research with a characteristic decay constant [9]. The long-term behavior of the curve is characterized by a final constant height. Any of these parameters may be set to zero (except the decay constant). A zero initial height would indicate no direct response to teaching; a zero final height would indicate no lasting effect of the intervention. A short decay constant indicates that responses relax quickly to final state. A short decay constant with a large final height may be experimentally difficult to distinguish from a similar curve with long decay time. The demonstration curve peaks at t = 17; a common response to teaching is learning. It is also possible to model interference, which tends to decrease score, by using a negative peak. In most classroom situations, a given topic may have more than one teaching moment. Multiple teaching moments will produce multiple responses, and the responses add. In the curve shown, there is a non-zero initial response score, which could account for chance or for prior knowledge. We recognize that not all teaching moments fit neatly into delta functions. In the common Rescorla-Wagner model, for example, the response to extended teaching forms a natural log function. We choose to model teach-
Connecting Simulation with Experiment
our data, the smallest reasonable window duration is one day. Because we do not collect data every day, not all simulated data points are included in the averages. Figure 4 shows the correct answer to the “charge in uniform field” question together with simulation. Two events in the experimental curve have been fit to the model. Table 1 shows the values of their parameters. TABLE 1. Parameters for the correct response to the charge in a uniform field question. Feature Peak Dip teaching time (QD) delay (days) peak decay constant (days) final height initial offset
11.5 2 0.85 1 0.3 0.15
37 1 -0.25 4 0.15
DISCUSSION
CONCLUSION
The timing of the peak, about a week after this topic was covered in lecture, suggests that lecture is not a direct cause of the peak. We assume that the peak is due to a course event, which means that either lab or homework could be a cause. The peak happens on a Wednesday; labs were Wednesday, Thursday, and Friday, so it seems unlikely that lab is the cause. An investigation of homework sets reveals that a homework problem directly relevant to this question was due on QD 13 at 8 am, the day of the spike. Homework was collected through WebAssign, and submission patterns suggest that most students work on problems within a few minutes of submission. On this problem, 80% of students who submitted the problem did so within 30 hours of the due time; 60% within 12 hours (60 students sampled; 46 submitted). Because the average grade on this question was 71% (for both sampled students and all students in the class), we can assume that most submitters answered the question correctly. It seems likely that this homework problem caused the sharp peak in correct responses. An alternative explanation is that only “good” students visited our lab that day. There are two reasons to refute this hypothesis. First, there is no significant correlation between final grade and day visiting our lab. Second, and more strongly, if those students were exceptional, we would expect a corresponding increase in their responses on other questions on the same instrument, but we do not observe this increase (though responses generally track at all other points in the quarter). Thus, it is unlikely that the increase is caused by sampling errors. The dip at QD 37 is less pronounced than the spike, and it is broader. On QD 33, magnetic fields and the right hand rule were introduced. The first homework for moving charges in magnetic fields was due on QD 38, and contained two right hand rule questions. Interference between learning about magnetic forces and fields and prior knowledge about electric forces and fields could cause a dip near QD 38. In accordance with the interference hypothesis, the response on the electrostatics task consistent with the behavior of charges in uniform magnetic fields increases during this time. A charge at rest in a magnetic field will remain at rest (option E in Figure 2). The delay time, here modeled as two days, could be considered too short. Would not a longer delay time also be reasonable? Our data cover QDs 8, 9, 10, and 13, 14, 15. It would be possible to increase the delay to three or four days, but there are no course events to support that course of action.
Pre- and post-testing can not measure the possible structure of a response curve, which may contain both a sharp peak and a dip, consistent with learning and interference (respectively). Responses can change rapidly, and in the example pesented here the sharp peak corresponds to homework, not lecture. We introduce a mathematical model for modeling changing responses to a question with time. The model has five parameters per teaching moment, and can account for learning, forgetting, and interference. We use the model to fit preliminary data from an introductory calculus-based electricity and magnetism course with a task drawn from high gain questions on the CSEM.
ACKNOWLEDGMENTS We thank Jeffrey Asch, Rebecca Rosenblatt, Thomas Scaife, and the others in the Physics Education Research Group and the Cognitive Development Laboratory at the Ohio State University for their insight on this project. This research is partially supported by a grant from the Institute of Education Sciences, U.S. Department of Education (#R305H050125).
REFERENCES R. J. Beichner, American Journal of Physics 62, 750–762 (1994). 2. D. Hestenes, M. Wells, and G. Swackhamer, The Physics Teacher 30, 141–166 (1992). 3. D. Hestenes, and M. Wells, The Physics Teacher 30, 159–165 (1992). 4. E. F. Redish, J. M. Saul, and R. N. Steinberg, American Journal of Physics 66, 212–224 (1998). 5. R. K. Thornton, and D. R. Sokoloff, American Journal of Physics 66, 338–352 (1998). 6. R. R. Hake, American Journal of Physics 66, 64–74 (1998). 7. L. Ding, N. W. Reay, A. Lee, and L. Bao, Phys. Rev. ST Phys. Educ. Res. 4, 010112 (2008). 8. R. A. Rescorla, and A. R. Wagner, “A theory of Pavlovian conditioning: Variations in the effectiveness of reinforcement and nonreinforcement,” in Classical Conditioning II, edited by A. H. Black, and W. F. Prokasy, Appleton-Century-Crofts, 1972, pp. 64–99. 9. C. E. B. Hermann Ebbinghaus, Henry Alford Ruger, Memory, Teachers College , Columbia University, 1913. 10. M. E. Bouton, Psychological Bulletin 114, 80–99 (1993). 11. D. P. Maloney, T. L. O’Kuma, C. J. Hieggelke, and A. V. Heuvelen, American Journal of Physics 69, S12–S23 (2001). 1.