Evaluating the Effectiveness of Search Task Trails Zhen Liao∗
Yang Song
Li-wei He
Yalou Huang
Nankai University Tianjin, China
[email protected]
Microsoft Research Redmond, WA
[email protected]
Microsoft Redmond, WA
[email protected]
Nankai University Tianjin, China
[email protected]
ABSTRACT In this paper, we introduce “task trail” as a new concept to understand user search behaviors. We define task to be an atomic user information need. Web search logs have been studied mainly at session or query level where users may submit several queries within one task and handle several tasks within one session. Although previous studies have addressed the problem of task identification, little is known about the advantage of using task over session and query for search applications. In this paper, we conduct extensive analyses and comparisons to evaluate the effectiveness of task trails in three search applications: determining user satisfaction, predicting user search interests, and query suggestion. Experiments are conducted on large scale datasets from a commercial search engine. Experimental results show that: (1) Sessions and queries are not as precise as tasks in determining user satisfaction. (2) Task trails provide higher web page utilities to users than other sources. (3) Tasks represent atomic user information needs, and therefore can preserve topic similarity between query pairs. (4) Task-based query suggestion can provide complementary results to other models. The findings in this paper verify the need to extract task trails from web search logs and suggest potential applications in search and recommendation systems.
Categories and Subject Descriptors H.3.3 [Information Storage and Retrieval]: Information Search and Retrieval
General Terms Algorithms, Experimentation, Measurement
Keywords Search log mining, task trail, task evaluation, log analysis
1.
INTRODUCTION
Web search has become a popular tool for finding information in our daily lives. Web search logs record the searching activities from users. Previous studies have shown that ∗ This work was partically finished while the first author was an intern at Microsoft Research, Redmond.
Copyright is held by the International World Wide Web Conference Committee (IW3C2). Distribution of these papers is limited to classroom use, and personal use by others. WWW 2012, April 16–20, 2012, Lyon, France. ACM 978-1-4503-1229-5/12/04.
Time 09:03:26 09:03:39 09:06:34 09:07:48 09:08:02 09:10:23 09:10:31 09:13:13 09:13:19 09:15:39 09:15:47 09:17:51 09:18:54 09:19:28
Event Query Click Query Query Click Query Click Query Click Query Click Query Query Query
Value facebook www.facebook.com amazon faecbook.com facebook.com/login.php amazon kindle kindle.amazon.com gmail log in mail.google.com/mail amazon kindle books amazon.com/Kindle-eBo... i’m picking up stones i’m picking up stones lyrics pickin’ up stones lyrics
Task 1 1 2 1 1 2 2 3 3 2 2 4 4 4
Table 1: An example of session in web search logs. search logs can be used in various applications including user satisfaction analysis [10], page utility estimation [33], user search interest prediction [34], query suggestion [4], web page re-ranking [36], web site recommendation [35], etc. However, most of previous work analyzed web search logs at session or query level, but few of them have considered search logs at task (atomic user information need) level. Consider the example shown in Table 1, which is a real user search session from Bing (http://www.bing.com). The user began this session with query “facebook” and finished the session with several attempts to search for lyrics of a song. From the table, we can see that one session may contain multiple or interleaved tasks. The reasons behind that are: (1) web search logs are ordered chronologically; (2) users often open multiple tabs or browsers and conduct concurrent tasks. The studies on search logs need to consider this common user behavior. On one hand, treating the whole session as an atomic unit cannot reflect the details of multitasking. As shown in Table 1, query “gmail log in” seems to have no correlation with its adjacent queries. Besides, failing in searching for lyrics of a song does not mean that the user did not find useful information for query “facebook”. On the other hand, dividing sessions at query level may lose information of reformulation by users. For example, in Table 1, even if the user had no click on query “amazon”, he still managed to find relevant information by reformulating “amazon” into “amazon kindle books” and made a click. Statistically, we find about 30% of sessions contain multiple tasks and about 5% of sessions contain interleaved tasks. Segmenting sessions into tasks is non-trivial because queries are often short and ambiguous. Beyond timeout
based method, several work tried to improve session boundary detection by adding features such as query reformulation patterns [15, 17]. Jones et al. [19] proposed to extract tasks from sessions by using features based on time stamp, query terms, etc. Lucchese et al. [24] proposed to leverage information from Wikipedia and Wikidictionary to further improve the performance of task identification. Although previous studies have addressed the problem of session boundary detection [15, 17] and task identification [19, 24], few of them systematically compared the effectiveness of using task trails, session trails, and query trails for search applications. In this paper, we compare task, session, and query trails for three search applications: determining user satisfaction, predicting user search interests, and query suggestion. We conduct experiments on large scale datasets from Bing (http://www.bing.com). Implicit feedback signals such as clicks, dwell time [10] and success scores in a hidden Markov model [12] are mined to measure user satisfaction and page utility. Meanwhile, ODP [1] category information is adapted to measure topic similarity for predicting user search interests. We further explore query suggestion results generated by using task, session, and click through bipartite graph as sources. Different query suggestion models are built by co-occurrence, log likelihood ratio and random walk approaches. Experimental results show the advantage of using task trails for these applications. Specifically, the main contribution of this paper is that we conduct extensive analyses and comparisons for verifying the effectiveness of task trails on large scale datasets. Our main findings are: (1) Sessions and queries are not as precise as tasks in determining user satisfaction. About 40% of multitask sessions contain both successful and unsuccessful tasks, and about 60% of multi-query tasks contain both clicked and unclicked queries. (2) Task trails provide higher web page utilities to users than other sources. Users gain higher page utilities following task trails. (3) Tasks represent atomic user information needs, and therefore are capable of preserving topic similarity between query pairs. Topic similarities of query pairs from the same task are significantly higher than those from different tasks. (4) Task-based query suggestion can provide complementary results to other models. These findings suggest the potential applications of task trails in search and recommendation systems. The rest of this paper is organized as follows. In Section 2, we discuss related work on mining useful information from session and query trails. In Section 3 we explain the datasets used in this paper and report several statistical results regarding task trails. The methods, metrics, and baselines used in our analyses are described in Section 4. In Section 5 we present experimental results in details. We draw conclusions and show possible future directions in Section 6.
2.
RELATED WORK
The term session was proposed in [5, 31] to segment user activities. Catledge et al. [5] analyzed user browsing logs captured from client-side user events of NCSA’s XMosaic. They found that 25.5 minutes timeout is good for separating consecutive user activities into different sessions. Later studies [17, 35, 4, 23, 36] often used 30 minutes timeout as the cut-off threshold. User behaviors in session trails can be used to determine user satisfaction. Fox et al. [10] studied relationship between implicit feedback signals and explicit user satisfac-
tion ratings. According to “gene analysis” on patterns of user behaviors, they found that dwell time on search result pages is a good indicator for user satisfaction. Hassan et al. [12, 13] formulated user search processes by Markov models and learned successful and unsuccessful user search behavior models. Query co-occurrence information mined from session trails can be used for generating query suggestion. Huang et al. [16] proposed to use co-occurred query pairs from sessions as suggestions. Jones et al. [20] extracted query substitution for sponsored search and applied log likelihood ratio (LLR) to improve relevance of query pairs. Boldi et al. [3] proposed query flow graph to represent web search logs and applied query flow graph in finding logical sessions and query recommendation. Transitions between web pages mined from session trails can be used for estimating page importance. Liu et al. [23] modeled user behaviors within sessions from web browsing logs as a continuous-time Markov process and proposed an algorithm named BrowseRank to improve performance of web page ranking. Sequential information mined from session trails can be used for context-aware applications. Shen et al. [30] proposed context sensitive information retrieval framework based on language model and tested their approach on TREC datasets. Xiang et al. [36] proposed several ranking principles for context-aware ranking in web search, where the principles promote or demote web pages based on relationship of query pairs within sessions. Cao et al. [4] combined both click-through and session logs to mine concept sequences for context-aware query suggestion. After grouping similar queries into concepts via their efficient algorithm, suggestions can be generated at concept level. A query trail [35, 33] is starting from a query and ending with another query. It consists of a query result page, a first clicked page, intermediate pages, and a destination page. Queries and their first clicked pages are often recorded in search engines as click-through logs, which can be used for ranking, query suggestion, and so on. Gao et al. [11] proposed to smooth click graphs to improve relevance estimation of query document pairs. Mei et al. [27] performed random walks on click through bipartite graph and used hitting time based method for query suggestions. Queries and their destination pages can be mined for popular destination recommendation. White et al. [35] conducted a user study by suggesting destination web sites to users and found the destination suggestions outperform other methods in exploratory tasks. The authors further evaluated relevance, topic coverage, topic diversity, novelty, and utility of full query trails over sub-trails and trail origins [33]. They found that following the query trails, users can find more useful information. On the other hand, Olston and Chi proposed ScentTrail [28] to combine searching and browsing activities into a single interface, and they found it can help users in finding information faster than by only searching or browsing alone. Donato [8] proposed to identify those complex tasks as research missions which need users to explore multiple pages. Kotov et al. [21] proposed to model and analyze cross-session search tasks, and they applied classification approach to predict the re-visiting likelihood of different tasks. Considering the multitasking behaviors in sessions, Jones and Klinkler [19] proposed to classify query pairs into same task via features based on time, word, web search results, etc. Their approach achieved more than 90% accuracy in
task boundary detection and same task identification. Lucchese et al. [24] proposed to identify task-based sessions by combining content (query word, edit distance) and semantic (Wikipedia) features. In this paper, we adapt methods described in [19, 24] to extract tasks from sessions where a query distance function is learned by the SVM model and then queries in sessions are clustered into tasks. The study described in this paper differs from previous work in that we focus on comparison of task, session, and query trails in terms of determining user satisfaction, predicting user search interests and generating query suggestions, rather than identifying session boundary [15, 17], extracting tasks from session [19, 24], or estimating web page relevance [30, 23, 36]. As a result, task trails can be considered as an additional information source to session and query trails for both search and recommendation systems.
3.
DATA AND STATISTICS
In this section, we start from describing datasets, and then report several statistics on the datasets regarding task trails.
3.1 Log Datasets We extract two log datasets for the experiments. The first dataset D0 consists of user browsing logs from a widely used browser plug-in toolbar. It contains URL visits by anonymized users who opted in to provide data. The second dataset D1 consists of web search logs from Bing, which contains user activities on the search engine. Both log entries may contain several fields: (1) user anonymized unique identifier (machine ID). (2) A unique browser identifier. (3) User clicked/visited URLs as well as queries related to user clicks. (4) Referrer URLs where current URLs come from. (5) Time stamps of user events. For preserving user privacy, intranet and secure URLs (such as URLs beginning with https:) are not recorded. Both datasets are from May to June 2011 in United States search market where main language is English. To further clean the data, we preprocess datasets as follows: (a) filter those sessions which have no search event (such as checking emails) or too many search events (which are likely generated by robots); (b) filter those entries with non-English language settings, e.g., users searched by other languages; (c) only keep those sessions with search events from “Web” search vertical and filter verticals like “Image”, “Video”, etc. since the majority of user searches are from “Web” vertical, which has been studied extensively in previous work; (d) only keep sessions with search events from Google, Bing and Yahoo! since these are main search engines in U.S. market.
3.2 Session and Task Extraction We apply a widely used timeout threshold to segment session: two consecutive user activities are separated as different sessions if the time interval between them exceeds 30 minutes [5, 4, 34, 36]. After session segmentation, dataset D0 contains 30, 071, 190 sessions and 2, 673, 335 unique users, while dataset D1 contains 488, 648, 153 sessions and 159, 668, 543 unique users. Although the magnitude of D0 is smaller than D1 , it contains more information than D1 , for example, (1) queries and clicks from different search engines; (2) post-query clicks, which are URL visits beyond search result clicks. We use this information in experiments of determining user satisfaction, deriving page utility, and predicting user search interests.
Task is defined as an atomic user information need in this paper. Our task extraction framework can be described as follows. First, we learn to measure similarities between query pairs. Second, queries within sessions are grouped into tasks via a clustering algorithm. This approach is motivated by [19, 24], where Jones and Klinkner [19] proposed to classify queries into tasks using a binary classification approach, while Lucchese et al. [24] proposed to cluster queries into the same task based on empirically designed query distance functions. Our approach takes advantage of machine learning approach in classifying whether two queries are from same task and use clustering approach to merge similar queries into same task. Basically, we measure query similarities by time and word based features, and learn a SVM classifier to determine the weight of features. Detailed features for query similarity and the performance of SVM classifier can be found in Section 5.1. Based on the learnt query similarity function, we can build a undirected graph queries within a session. The vertices of graph are queries and the edges are similarity between queries. By dropping the weak edges where the similarity is smaller than the threshold, we can extract all connected components of the graph as tasks. As discussed and tested in [24], this approach performs better than Query Flow Graph [3], K-means [25], DBScan [26]. However, the time complexity of constructing the graph and extract connected component can be O(k · N 2 ) where N is the number of queries and k is the dimension of features. Algorithm 1: Query Task Clustering (QTC). Input: Queries Q, cut-off threshold b; Output: A set of tasks Θ ; Initialization: Θ = ∅; Query to Task Table L=∅; 1: for len = 1 : |Q| − 1 do 2: for i = 1 : |Q| − 1 do 3: // if two queries are not in the same task 4: if L[Qi ] 6= L[Qi+len ] then 5: // compute similarity takes O(k) 6: s ← sim(L[Qi ], L[Qi+len ]); 7: if s ≥ b then 8: merge Θ(Qi ) and Θ(Qi+len ); 9: modify L; 10: // break if there is only one task 11: if |Θ| = 1 break; 12: return Θ; In this paper, we propose a Query Task Clustering approach (QTC) as shown in Algorithm 1. Based on the observation that consecutive query pairs are more likely belonging to same task than non-consecutive ones, QTC prefers to first compute the similarities for consecutive query pairs by timestamps. For example, given a series of queries {q1 , q2 , q3 , q4 }, QTC will first compute for pairs {q1 → q2 , q2 → q3 , q3 → q4 }, it can reduce the computational cost from O(k · N 2 ) to O(k · N ) if there is only one task in the session. Based on the statistics that about 50% sessions only have one task, QTC is efficient to identify them. For sessions with multiple tasks, QTC is also faster than standard implementation. For example, if the sequences {q1 , q2 , q3 , q4 } can be grouped into {q1 } and {q2 , q3 , q4 }, the standard approach enumerate all 6 query pairs but QTC only needs to compute 5 pairs while pair {q2 → q4 } is skipped. That is because it skips computing the similarity of query pairs
Statistics Avg. # of Queries in Sessions Avg. # of Queries in Tasks Avg. # of Tasks in Sessions % of Single-Task Sessions % of Multi-Task Sessions % of Interleaved Task Sessions % of Single-Query Tasks % of Multi-Query Tasks
D0 5.81 2.06 2.82 53.29 46.71 15.25 48.75 51.24
D1 2.54 1.60 1.58 70.72 29.28 4.78 71.86 28.13
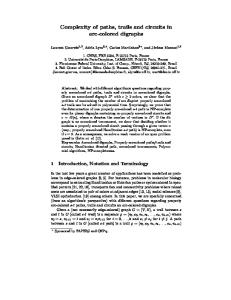
Table 2: Basic statistics of Browse and Search Logs. 100 90
% of session % of multi−task % of inter−leave task
Percentage(%)
80 70 60 50 40 30
Reformulation Patterns % of Identical % of Shorter % of Longer
D0 66.37 12.48 21.45
D1 50.45 16.77 32.76
Table 3: Query Refinement Pattern within Tasks from Browse and Search Logs. sessions is greater than three, more than half sessions contain multiple tasks. Next, we analyze query refinement patterns within multiquery tasks. We categorize consecutive query pairs within tasks into three types according to their query length: identical, shorter, and longer. The results are shown in Table 3. More than half ajacent query pairs are identical, where about 90% of identical pairs are from refreshing search result pages or clicking back button, and about 10% of identical patterns are from pagination. Besides, we can find that longer reformulation patterns are about twice more than shorter reformulation patterns. Based on these statistics, we believe that it is more effective to recommend longer and more specific queries to users than queries that are more general and have fewer words.
20
4. EXPERIMENTAL DESIGN
10 0 0
2
4
6
8
10
>10
Length of Session (#. of Queries)
Figure 1: Search Distribution in Browse (solid-line) and Search(dash-line) Logs. Please note the percentage of sessions is computed in total but the percentages of multi-task and interleaved-task sessions are computed per length of sessions. from the same task. In addition, QTC needs extra O(N ) space for storing a query to task mapping table, which is affordable in current applications.
3.3 Task Statistics After task extraction, dataset D0 contains 67, 464, 863 tasks and dataset D1 contains 770, 759, 594 tasks. We then report several basic statistics on D0 and D1 . Table 2 shows the detailed numbers. From the table, we can see that average numbers of queries in sessions and tasks of D0 are bigger than those of D1 . The reason is that sessions in D0 are usually longer than sessions in D1 since users often browse before and after searching. Meanwhile, percentages of multitask sessions in D0 and D1 are about 50% and 30%, respectively, which indicate that a large part of sessions consists of multitasking activities. Furthermore, about 15% and 5% of tasks are interleaved in D0 and D1 , respectively, which hint that users sometimes perform several tasks at the same time. Besides, about 50% of tasks in D0 and 30% of tasks in D1 contain multiple queries, which means that users often reformulate their queries during their search processes. Furthermore, Figure 1 draws the distribution regarding the relationship between tasks and session length (in terms of number of queries). From the figure, we observe that: (1) As the length of sessions increases, the percentage of sessions decreases, which is in accordance with previous studies [4, 22, 24]. (2) On the other hand, as the number of queries in sessions increases, the percentage of multitask and interleaved tasks also increases. While the number of queries in
As described before, we design several experiments to evaluate the effectiveness of task trails in three search applications. In this section, we describe the methods and tools as well as baselines used in the experiments.
4.1 Methods To measure user satisfaction, we use several user implicit feedback signals such as clicks, dwell time, and so on. To predict user search interests, we organize user information needs by queries they submitted and summarize queries into topics. To compare the performance of query suggestion, we further investigate models based on task trails in comparison to methods based on session and click through bipartite graph. We describe the details in the following sections.
4.1.1 Analyzing User Satisfaction To understand whether a user is satisfied or not after the search process, we adapt several implicit feedback [10, 12] as measurements. • Clicks. Previous work [11] showed clicks on search results often indicte the relevance between queries and clicked pages. • Dwell Time. Previous research [10] showed that dwell time of clicked results is a good indicator of user satisfaction. It is because during the information seeking process users are like to stay longer on useful pages. White et al. [33] conducted their study on estimating page utilities by using 30 seconds as indicator of deriving page utility. We therefore take 30 seconds dwell time on clicks of search results as a user satisfied signal. • HMM Success Score. As shown in [12, 13], user search activities can be modeled as a sequential process. Therefore, we can build two Hidden Markov models to compute the likelihood of user success and failure. The Markov model takes {queries, clicks, dwell time (>30 seconds)} as states {Q, SR, SR Long},
respectively. Based on labeled dataset containing both successful and unsuccessful search processes from users, we train two HMM models. Then given a new user task, we compare the likelihood from successful and unsuccessful models and determine the label of user tasks accordingly. See [13] for more details. Based on above implicit feedback signals, we can compute AllClickRate,30sClickRate at both session and task level. Take AllClickRate as an example, if one query has more than one click, then it is judged as clicked. Sessions contain clicked query are labeled as clicked sessions, and AllClickRate for sessions is the percentage of clicked sessions. The same calculation are conducted for AllClickRate of tasks. By using the task success labels based on Hidden Markov model, we can study the percentage of multitask sessions with both successful and unsuccessful tasks. As reported in [13], the HMM model can achieve 80% and 93% precision for labeling successful and unsuccessful cases with 70% recall, respectively. Besides, we also compute web page utility of a query trail as the percentage of pages where users stayed longer than 30 seconds [10, 33]. Both task and session can be considered as a sequence of query trails. Each query trail begins by a query following several clicks and ends by another query. Therefore, we can compute average utility on: (1) SequenceFull (all query trails of sequences), (2) Sequence-Origin (first query trails of tasks or sessions), and (3) Sequence-Follow (other query trails except first one in tasks or sessions). Average utilities from different sources can be compared to know which source provides highest web page utilities for users in finding useful information.
4.1.2 Predicting User Search Interests User search interests can be captured for improving ranking or personalization of search systems [30, 34, 36]. Previous work has taken advantage of queries and clicks preceding user current query as context to perform context-aware ranking [36]. One of key aspects in context-aware ranking is to promote or demote the rank of URLs based on their relationship with current query’s context. As studies in [30, 36], the relationship can be measured using topic similarity. Since queries submitted by users reflect user information needs, we can use queries to represent user search interests. On the other hand, queries are often short and ambiguous. Therefore we can summarize user search interests at topic level. By taking previous co-session or co-task queries as context information to user’s current query, we can construct different context models. To know which context model can predict user search interests better, we can compare topic similarities of co-session and co-task query pairs. Without loss of generality, we take ODP [1] category as topics for summarizing user search interests. Queries are mapped into ODP categories by taking advantage of their search results. For each query, we first scratch its top ten search results from search engines Google and Bing, and obtain a union set of URLs. Then we crawl content information of each URL. Topics of all URLs are obtained by ODP category looking up and content matching. A content based ODP classifier is built similar to [29]. We combine a mapping of URL to ODP category from the training data and a classifier for each target category with features of unigram, bigram and trigram language model. We choose second level ODP categories with 385 sub topics where topics in “/world”
ODP Topic t kids and teens/pre-school games/puzzles kids and teens/computers reference/education games/resources
P (t|Q) 0.1415 0.1344 0.1116 0.1042 0.1032
Table 4: Top 5 ODP topics for query “cool math”(Q) with corresponding topic probability P (t|Q). and “/regional” are excluded. Afterwards, topics of queries are obtained from topics of their top search results equally. P Finally, we normalize topic distribution to let t P (t|Q) = 1 (Here t is short for topic) for each query Q. As an example, top five topics of query “cool math” with corresponding P (t|Q) are shown in Table 4. After representing each query as a topic distribution, we can compute topic similarity between query pairs Qx and Qy by Histogram Intersection [32]: Sim(Qx , Qy ) =
X
min(P (t|Qx ), P (t|Qy ))
(1)
t
Histogram intersection is used here for its simplicity in both computation and explanation. The higher the value is, the more similar two queries are. We further introduce similarity for top K topics as: Sim@k(Qx , Qy ) =
X
min(P (t|Qx ), P (t|Qy ))
(2)
k t∈Qk x ∩Qy
Here Qkx denotes top K topics which have highest probability of P (t|Qx ). This measure can reflect similarity between query pairs in their most relevant topics. Bennett et al. [2] mentioned that due to space limitation in real applications, we may only store top K topics for each query. Therefore, we take Equation 2 as a metric for topic similarity.
4.1.3 Query Suggestion To compare difference among tasks, sessions and clickthrough logs in generating query suggestions, we build several suggestion models. Since sessions and tasks both contain several queries, we can leverage the co-occurrence information for suggestions. Besides, query-URL clicks can be mined from query trails for constructing the click through bipartite graph. Then queries sharing lots of co-clicked URLs can be used as suggestions. The details of suggestion models are described as follows. • Co-occurrence. Huang et al. [16] showed the effectiveness of using co-occurred queries within sessions as suggestions. One of its shortages is that it may suggest popular but useless queries. We can also build task level co-occurrence model. • Log Likelihood Ratio (LLR). Dunning [9] showed LLR can achieve good statistical results on text analysis. Jones et al. [20] took LLR to measure relevance between query terms. Using LLR to measure correlation between query pairs can ease the problem of providing popular but useless queries. Given two queries q1 and q2 , LLR makes null hypothesis H1 : Pr(q2 |q1 ) = Pr(q2 |¬q1 ) and the alternative hy-
pothesis H2 : Pr(q2 |q1 ) 6= Pr(q2 |¬q1 ). Likelihood ratio for test λ = maxp L(H1 )/ maxp1 ,p2 L(H2 ) is used in LLR = −2 ln λ. Simply speaking, higher LLR indicates closer correlation between query pairs. A score of 3.84 for LLR indicates 95% confidence for rejecting null hypothesis H1 , and two queries are significant related. To further increase the quality, we only mine query pairs having LLR larger than 100 as suggestions. • Random Walk. Previous work [6, 27] showed that random work approaches on click through bipartite graph can generate good query suggestions. Given a click-through bipartite graph, query to URL transi, and tion probability is computed as P (u|q) = #(q,u) #(q) URL to query transition probability is computed as · iqf (u)). Here #(·) is short for P (q|u) = norm( #(q,u) #(u) count and norm(·) is short for normalization. We introduce iqf [7] to decrease weights of popular URLs connected to many queries. The P transition weights between query pairs P (qj |qi ) = u P (qj |u) · P (u|qi ). After constructing matrix P with all P (qj |qi ), random walk model [6] can propagate as: r i+1 (q) = α · P · r i (q) + (1 − α) · r 0 (q)
(3)
i
Here r (q) is a transition vector at i-th iteration for query q. α was usually set to be 0.7 in previous work [14, 7]. Iterations can continue until converge or stop after maximum steps. Finally we can provide suggestions for query q via r n (q). We compare query suggestion results to show difference among tasks, sessions, and click through bipartite graph. To keep it simple, we do not merge all sources into hybrid methods such as [22] to further improve the performance of query suggestion.
5.
EXPERIMENT RESULTS
In this section, we present experimental results and findings in details. Firstly, we introduce our approach for extracting tasks from sessions. Then we present the results of evaluating the effectiveness of task trails.
5.1 Performance of Task Extraction To learn a good similarity function for queries, we construct a labeled dataset for task classification. 10,368 sessions are randomly sampled from log dataset and all query pairs in those sessions are extracted. There are totally 17,924 query pairs. 26 annotators are organized as judge pools and each query pair is shown to at least three of them. Each time, one annotator is given by two queries with query words as well as top ten search results to judge whether they are submitted for same task. As described in Section 3.2, we define task as atomic information need and give out detailed examples in our labeling guidelines. Briefly speaking, the guidelines allow annotators to label query pairs as same task if: (1) they are repeated; (2) one contains a narrowing intent of another; (3) one contains a widening intent of another; (4) one contains alternative intent of another; (5) one is a typo of another. On the other hand, the annotators are not allowed to label query pairs as same task if: (1) they are unrelated; (2) they contain different atomic intentions (e.g., “seattle city”→“space needle”). Labels include 1 (same task), -1 (different task) or 0 (unknown), and label of each query
+1 -1 0
Query A gmail.com florida statutes facebook.com definitions of tarsorraphy sunday night football snowmobiling in Minnesota
Query B login gmail florida evidence code fallout 3 books attwireless nbc sports nfl snowmobile parts
Table 5: Examples of labeled query pairs. Feature Description temporal features timediff 1: time difference in seconds timediff 2: category for 1/5/10/30 mins word features lv 1: Levenshtein distance of two queries lv 2: lv 1 after removing stop-words. prec 1: average rate of common terms. prec 2: prec 1 after removing stop words. prec 3: prec 1 (If term A contains B, A=B) rate s: rate of common characters from left rate e: rate of common characters from right rate l: rate of longest common substring b 1: 1 if one query contains another, else 0
Weight -0.1121 -0.0623 0.0106 -0.1951 -0.2870 1.2058 0.5292 1.6318 0.4014 0.4941 0.6361
Table 6: Features of query pair. pairs is obtained by voting. Finally we obtain 5,668 positive pairs, 9,370 negative pairs, and 1,334 unknown pairs. The unknown pairs are ignored, while positive and negative pairs are used. For better understanding labeled results, we show some examples of labeled query pairs in different categories in Table 5. Although previous work [19, 24] conducted their studies by manually labeling whole session into tasks, we choose to label query pairs since: (1) it can ease effort of human annotators, and (2) the goal of our first step is to obtain a query similarity function between query pairs, so pair-wised labeling can provide adequate information. We construct 11 features to measure similarity between queries. These features can be classified into two categories: 1) temporal; 2) query words. We present details of features in Table 6, where 215 frequent searched but useless words are selected as stop words. The column weight in the table gives out the weight of each feature for similarity function. We obtain the weights by training a linear SVM model [18]. We choose linear-SVM as classifier because of its good performance in many applications and theoretical soundness. The whole labeled dataset is split into 5 folds for cross validation. Each time 3 folds are used for training, 1 fold for validation in tuning parameter (C in SVM) and the rest 1 fold for testing. Studies on these features show that using temporal features can only achieve about 70% accuracy, word features can achieve 91% accuracy, and combining them can achieve 93% accuracy in classifying queries into tasks. The performance of temporal features is in accordance with [19, 24]: no matter how long or short the timeout threshold is, it cannot achieve good precision in identifying tasks. ROC curves of features for task classification are shown in Figure 2. As a result, average precision on testing folds are higher than 93% by using all features. Therefore, given two queries, we can compute their similarity from features described in Table 6 and judge whether they are from same task or not. Advanced features such as Wikipedia, web search results can
1
Implicit Measures All Click (%) 30s Click (%)
0.9
True Positive Rate
0.8 0.7
D1 Session Task 82.73 77.75 76.38 70.04
Table 7: Implicit rates for user satisfaction.
0.6
Implicit Measures All Click (%) 30s Click (%)
all features word features time features
0.5 0.4 0.3
D0 18.65 34.69
D1 35.21 47.55
Table 8: Percentage of multitask sessions which have tasks with different implicit feedback signals.
0.2 0.1 0 0
D0 Session Task 93.86 84.96 82.37 67.09
0.2
0.4
0.6
0.8
1
False Positive Rate
Figure 2: ROC of features for task classification. be added into this model. Since we already achieve good classification performance, we keep current model for experiments in this paper. Then we use Algorithm 1 to group queries into taks. We omit the comparison of different clustering algorithms since it is not our focus in this paper.
5.2 Findings 5.2.1 Determining User Satisfaction After task extraction, we compute AllClickRate and 30sClickRate at both session and task level as described in Section 4.1. The results on both D0 and D1 are shown in Table 7. As we can see, in both logs, all implicit measures have big differences between session and task. Take AllClickRate as an example, the differences between tasks and sessions comes from multi-task sessions where some tasks contain clicks, but others do not. Then we extract multi-task sessions to continue study. Table 8 shows the percentage of multi-task sessions with both successful and unsuccessful tasks in AllClick and 30sClick. As we can see, 35% of multi-task sessions in D1 have both clicked and unclicked tasks, which can occupy more than 10% of all sessions in D1 . Next, all tasks are labeled as successful or unsuccessful by using Hidden Markov models as described in Secion 4.1.1. Based on statistics on multitask session, we find that 27% of multitask session in D0 contain both successful and unsuccessful tasks, and 42% of multitask sessions in D1 contain both successful and unsuccessful tasks. The results indicate that extracting tasks from sessions is non-trivial, especially in using logs for determining user satisfaction. Furthermore, we compute the percentage of successful tasks having both clicked and unclicked queries. We find that the percentages of successful multi-query tasks which contains both clicked and unclicked queries are 62% and 30% on D0 and D1 , respectively. The results indicate that taking individual query as a unit to judge user satisfaction is insufficient. Therefore, to determine user satisfaction, It is more precise to choose at task level comparing with session and query level. On the other hand, we study sessions and tasks in deriving web page utilities. As described in Section 4.1, average web page utility of one query trail is computed as the percentage of clicked pages having dwell time longer than 30 seconds. Then we compare several sources in providing utilities: (1) Sequence-Full, which contains all query trails;
(2) Sequence-Origin of sessions, which contains first query trails of sessions; (3) Sequence-Follow of sessions, which contains query trails except first one of sessions; (4) SequenceOrigin of tasks, which contains first query trails of tasks; (5) Sequence-Follow of tasks, which contains query trails except first one of tasks. To conduct this experiment, we use dataset D0 since those click events beyond search result clicks are recorded. We filter D0 by selecting sessions with at least two query trails where each query trail contains at least one clicked page. The filtering is important for comparing the utilities of different sources. After that, we obtain 182,533 sessions which are in high quality for utility calculation and adequate in numbers for significant test. The results of utility comparison are presented in Table 9. On average there are more than half pages deriving utility to users (Sequenct-Full), which is in accordance with [33]. If we only have a look at first queries, the average utility decreases at both session and task level. That is to say, users tend to find useful pages in the rest of search processes. Following original queries, utilities of sessions and tasks both increase and the utility of tasks is even higher. Significant test shows that the source of tasks excluding first query (Sequence-Follow of tasks) outperforms all other sources in deriving utilities (all p-values < 10−5 ). Therefore, following task trails, users can find more useful information.
5.2.2 Predicting User Search Interests As described in Section 4.1, user search interests can be represented by their queries. Further summarizing queries into topics can help understanding user search interests at a higher level. Given two queries submitted by one user, they may come from: (1) different sessions (inter-sessions); (2) same session (intra-session); (3) different tasks in different sessions (inter-tasks among sessions); (4) different tasks in same session (inter-tasks within sessions); (5) same task in same session (intra-task). All these five sources can provide query pairs. Besides, capturing user search interests at topic level is useful to understand user behaviors. For example, average topic similarity between query pairs from different sessions can help tracing the user search interests during a relative long period. Topic similarity between query pairs from same session can reflect user search interests in a relative short time. We use dataset D0 in this experiment since queries in D0 may come from different search engines and then record the whole picture of user search processes. We pick out users with all sessions have two or more queries, since singlequery sessions cannot generate query pairs. Finally we get 21,787 users with 52,510 sessions, 118,330 tasks, and 79,037 distinct queries. As we know, users often repeat their queries
0.7
0.7
Sim@K
0.5
0.6
0.5
Sim@K
0.6
Inter−Sessions Intra−Session Inter−Tasks among Sessions Inter−Tasks within Sessions Intra−Task
0.4
0.3
0.4
0.3
0.2
0.2
0.1
0.1
0
1
3
5
10
N
Inter−Sessions Intra−Session Inter−Tasks among Sessions Inter−Tasks within Sessions Intra−Task
0
1
3
5
10
N
K
K
(a) On dataset S1
(b) On dataset S2 (popular queries are filtered)
Figure 3: Topic similarities of query pairs from different sources. For each K in Sim@K, the left-most bar is for inter-sessions, and right-most bar is for intra-task. Source Sequence-Full Sequence-Origin of Sequence-Follow of Sequence-Origin of Sequence-Follow of
Sessions Sessions Tasks Tasks
Avg. Utility(%) 55.50 49.41 57.38 53.58 58.47
Table 9: Utilities of different sources based on sessions and tasks (N=182,533). multiple times and search popular queries like “facebook”, “youtube” in their daily lives. For a fair comparison, we further construct two datasets for experiments: (a) the first one S1 contains all unique queries from sessions. That is to say, identical queries from one session is not counted twice or more in computing topic similarity. (b) the second one S2 adds a filtering step on S1 by removing all popular queries like “facebook” from sessions. To avoid bias from users with many sessions, we compute topic similarities of different sources and get average values at user level. Besides, we compute similarity Sim@K with different K: 1, 3, 5, 10, and so on. Given two queries Qx and Qy , Sim@1 means that the similarity is only computed on the highest P (t|Q). As shown in Equation 2, if the top 1 topics t of Qx and Qy are different, then Sim@1 is zero. The same to Sim@K at top 3, 5, 10, etc. The results of topic similarity are shown in Figure 3. From the figure we can find several trends: (1) Topic similarities of query pairs are increased along with K. This is straightforward based on the definition of Sim@K, since the bigger K is, the more topics are involved. (2) Inter-Session similarity is comparable or even higher than Intra-Session similarity on first dataset S1 . Based on studies of real examples, the reason is that users are likely to search popular queries such as “facebook” or “hotmail” among different sessions. When we filter those popular queries, similarity of intra-session is increased to be higher than inter-session at second dataset S2 . However, we can still observe that topic similarities of both inter-session and intra-session are low, which indicates that timeout cut-off based session is not good to preserve topic similarity. (3) Topic similarities of intra-session, inter-task among session, and inter-task within session are comparable. As described in Section 5.1, queries are grouped into tasks mainly based on query word features, which means queries from different tasks are not
similar in lexicon. Since queries from different tasks have low topic similarity, it further hints they are not searched for the same user information need. (4) Topic similarity of intra-task is highest among all sources, which indicates task trails, representing user atomic information needs, can well preserve user search interests. Significant test results show that source of intra-task has highest topic similarity among all sources (all p-values < 10−5 ).
5.2.3 Query Suggestion As described in Section 4.1.3, we compare several models for generating query suggestions: (1) session co-occur; (2) session LLR; (3) task co-occur; (4) task LLR; (5) random walk at initial state (at 0-th iteration); (6) random walk with exact solution (at n-th iterations). We choose dataset D1 from search logs for this experiment, since (a) D1 is about ten times larger than D0 , and (b) D1 can provide sufficient information for all query suggestion models. To make D1 less noisy, we conduct pruning steps on all methods [4, 22]. In session-based co-occurrence and LLR methods, we prune query pairs with co-occurrence less than 5 times. In task-based co-occurrence and LLR methods, we prune query pairs with task co-occurrence less than 5 times. In random walk approach, we prune edges of query-URL pairs clicked less than 5 times. After pruning, we construct all models as described in Section 4.1.3. Please note that co-occurrence and LLR methods are used on sessions and tasks with more than 2 queries, while random walk approach can leverage information from sessions having only one query with clicks. Firstly, we compare the coverage of all methods in query suggestions. Instead of counting the percentage of testing cases each model is able to provide suggestions, we compare the number of indexed queries in session-based, taskbased, and random walk approaches. The results are shown in Table 10. By the number of distinct query, session-based, task-based, and random walk methods preserve only 0.7%, 0.5% and 2% queries from D1 , respectively. However, by the frequency of queries, session-based, task-based, and random walk methods keep 52%, 49% and 58% of query occurrences, respectively. These results indicate that after pruning, all methods can generate suggestions for high and middle frequent queries but are not capable of offering suggestions to most tail queries. Since random walk approach can make use of information from single-query sessions, it can gener-
Methods Session-based Task-based Random walk Total
Distinct # of Q. 2,115,815 1,517,291 6,104,997 298,563,791
Frequent # of Q. 650,550,492 609,960,534 720,678,502 1,239,776,369
Table 10: Coverage of all methods in terms of number of queries. Q is short for queries. ate suggestions on more testing queries than session-based and task-based methods. Secondly, we compare the quality of query suggestions generated on a hold-out testing set. Testing queries are sampled from high, middle and low frequent parts of another search logs dataset D2 in July 2011. High frequenct queries are submitted more than 100,000 times; middle frequent queries are submitted more than 100 times; and rest queries are low frequent. We pick out 100 testing queries from each frequent part where every test query has at least one suggestion by all models. To avoid providing duplicated suggestion for all models, we conduct the same postprocessing step on suggestions. Specifically, we scan all suggestions sequentially and filter duplications. Each suggestion is calculated a smallest Levenshtein Edit Distance with other suggestions ranked higher than it, then it is labeled as duplicated and discarded if the edit distance is too small comparing to its length. This simple method can remove duplicate suggestion “amazonkindle” when there is another suggestion “amazon kindle”. All models provide at most 5 suggestions. We then invite 3 annotators to label whether these suggestions are meaningful (1) or meaningless (0). Each time, annotators are shown with query words and search results of a testing query and a suggested query. Those suggested queries which are either too similar or too irrelevant to testing queries are judged as meaningless. The final judge is obtained by voting and the quality of each model is computed via number of meaningful suggestions divided by total number of suggestions. We show the results in Table 11. From the table, we observe that: (1) Session co-occurrence method performs worst. This is reasonable since session co-occurrence model generates many popular but meaningless queries as suggestions. LLR method can ease the problem and increase suggestion quality. To better understand the difference between co-occurrence and LLR methods, we show an example in Table 12. (2) Random walk approach performs best on low frequent queries, which indicates that random walk approach has a good property for easing the sparsity of query logs [27]. (3) Task-based methods perform best on high and middle frequent queries, while task co-occurrence and LLR methods do not have much difference, since popular but irrelevant queries are usually not grouped into same task. Next, we present several queries from hot, middle, and low frequency categories with their suggestions. These examples are shown in Table 13. From suggestions generated by different methods, we find that: (1) Session-based models often generate related queries in a broad range such as provide “verizon” as suggestion to “att”. (2) Random walk approach sometimes generates suggestions which are too similar to test queries, such as providing “at & t” as suggestion to “att”. That is why random walk approach does not perform best on high and middle frequent queries(see Table 11). (3) For low frequent queries, task-based and session-based methods generate nearly same suggestions. (4) Task-based
Source Session Co-occur Session LLR Task Co-occur Task LLR RandWalk(0) RandWalk(n)
High 54% 71% 84% 86% 69% 74%
Middle 62% 73% 83% 85% 71% 77%
Low 67% 72% 72% 73% 85% 88%
Total 61% 72% 80% 82% 75% 80%
Table 11: Quality of query suggestions. Test Cases
amazon
Methods Session Co-occur Session LLR facebook ebay ebay walmart google target youtube best buy yahoo barnes and nobel
Table 12: Suggestions of Session-based models. methods often generate more specific queries for further narrowing down user information need, which are different from session-based and random walk approaches. As a result, suggestions provided by task-based methods can be treated as complementary to results from session-based and random walk approaches.
6. CONCLUSIONS & FUTURE WORK In this paper we proposed to use task trail as an additional source to better understand user search behaviors. Users often perform multitasking behaviors during their search processes. Statistical results on 0.5 billion sessions from web search logs showed that: (a) about 30% of sessions contain multiple tasks, and (b) about 5% of sessions contain interleaved tasks. To evaluate the effectiveness of task trails, we compared task, session and query trails in determining user satisfaction, predicting user search interests, and query suggestion. Comparing to session and query trails, task trail is more precise to determine user satisfaction. Following the task trails, users are more likely to find useful information. Meanwhile, since tasks represent atomic user information needs, they can well preserve topic similarity between query pairs. Further, we found that task-based query suggestion can provide complementary results to other models. These findings verify the need to extract task trails from web search logs and suggest potential applications of using task trails in search and recommendation systems. As our future work, we plan to (1) combine task, session and query trails into search applications such as query suggestion, and (2) group similar user task trails to perform task driven search, suggestion, and web site recommendation.
7. ACKNOWLEDGEMENT The authors thank Wei-Ying Ma, Yi-Min Wang, Hang Li, Daxin Jiang, and Xiaohui Sun for their support on this work. Thanks also to Qiang Hao and Jing Liu for their helpful discussions. This work is supported by the Fundamental Research Funds for the Central Universities, the National Natural Science Foundation of China under Grant No. 61105049, and Microsoft Research Asia Fellowship. In addition, we want to acknowledge the anonymous reviewers for their valuable comments.
8. REFERENCES [1] ODP: http: // www. dmoz. org/ .
Test Case atth
exchangem
harry trumanm
“popular irish baby names”l
Session LLR. at&t my account verizon sprint tmobile att wireless military exchange exchange rate easyfreexbox360 tennis aafes winston churchill robert byrd nelson mandela neil armstrong teddy roosevelt top irish baby names unique irish baby names irish baby boy names irish baby names “traditional irish baby names”
Methods Task LLR Random Walk(0) at&t my account at&t.com att wireless at & t at&t email at and t at&t bill pay at&t wireless at&t customer service att uverse military exchange currency converter exchange rates microsoft exchange navy exchange aafes microsoft exchange currency exchange base exchange exchange rates harry truman quotes harry s truman bess truman truman harry truman facts president truman harry s truman truman library harry s truman biography unique irish baby names “most popular irish irish baby names boy names” irish baby boy names popular irish names top irish baby names top 100 baby names
Random Walk(N) at&t.com at & t att wireless att.net mail att uverse currency converter microsoft exchange aafes currency exchange exchange rates harry s truman truman truman state university truman college truman library “most popular irish boy names” popular irish names irish boys names irish baby names irish names
Table 13: Example of query suggestions provided by different methods. Superscripts h, m, l are notations for high, middle, and low frequent test cases. [2] Bennett, P., Svore, K. and Dumais, S. Classification-enhanced ranking. WWW ’10, pages 111–120. ACM, 2010. [3] Boldi, P., Bonchi, F., Castillo, C., Donato, D., Gionis, A. and Vigna, S. The query-flow graph: model and applications. CIKM ’08, pages 609–618. ACM, 2008. [4] Cao, H., Jiang, D., Pei, J., He, Q., Liao, Z., Chen, E. and Li, H. Context-aware query suggestion by mining click-through and session data. In KDD ’08, 2008. [5] Catledge, L.D. and Pitkow, J.E. Characterizing browsing strategies in the world-wide web. Computer Networks and ISDN Systems, 27(6), 1995. [6] Craswell, N. and Szummer, M. Random walks on the click graph. SIGIR ’07, pages 239–246, 2007. [7] Deng, H. and Irwin, K. and Michael L. Entropy-biased models for query representation on the click graph. SIGIR ’09. [8] Donato, D., Bonchi, F., Chi, T. and Maarek, Y. Do you want to take notes? identifying research missions in yahoo! search pad. WWW ’10, pages 321–330, New York, NY, USA, 2010. ACM. [9] Dunning, T. Accurate methods for the statistics of surprise and coincidence. Comput. Linguist., 19:61–74, March 1993. [10] Fox, S., Karnawat, K., Mydland, M., Dumais, S. and White, T. Evaluating implicit measures to improve web search. ACM Trans. Inf. Syst., 23:147–168, April 2005. [11] Gao, J., Yuan, W., Li, X., Deng, K. and Nie, J.-Y. Smoothing clickthrough data for web search ranking. SIGIR ’09, pages 355–362. ACM, 2009. [12] Hassan, A., Jones, R., and Klinkner, K. Beyond dcg: user behavior as a predictor of a successful search. WSDM ’10, pages 221–230, 2010. [13] Hassan, A., Song, Y. and He, L-w. A task level user satisfaction metric and its application on improving relevance estimation. CIKM ’11, 2011. [14] Haveliwala T., Kamvar, S., and Jeh G. An analytical comparison of approaches to personalizing pagerank. 2003. [15] He, D., G¨ oker, A. and Harper, D.J. Combining evidence for automatic web session identification. I.P.M., 38(5), 2002. [16] Huang, C.K., Chien, L.F. and Oyang, Y.J. Relevant term suggestion in interactive web search based on contextual information in query session logs. JASIST, 2003. [17] Jansen, B., Spink, A. and Kathuria, V. How to define searching sessions on web search engines. WebKDD ’06, 2007. [18] Joachims, T. Optimizing search engines using clickthrough data. KDD ’02. ACM, 2002. [19] Jones, R. and Klinkner, K.L. Beyond the session timeout: automatic hierarchical segmentation of search topics in query logs. CIKM ’08. ACM, 2008.
[20] Jones, R., Rey, B., Madani, O. and Greiner, W. Generating query substitutions. WWW ’06, pages 387–396. ACM, 2006. [21] Kotov, A., Bennett, P., White, R., Dumais, S. and Teevan, J. Modeling and analysis of cross-session search tasks. SIGIR ’11. [22] Liao, Z., Jiang, D., Chen, E., Pei, J., Cao, H. and Li, H. Mining concept sequences from large-scale search logs for context-aware query suggestion. ACM Trans. Intell. Syst. Technol., 3, 2011. [23] Liu, Y., Gao, B., Liu, T.-Y., Zhang, Y., Ma, Z., He, S. and Li, H. Browserank: letting web users vote for page importance. SIGIR ’08, pages 451–458, 2008. [24] Lucchese, C., Orlando, S., Perego, R., Silvestri, F., and Tolomei, G. Identifying task-based sessions in search engine query logs. WSDM ’11, pages 277–286. ACM, 2011. [25] MacQueen, J. Some methods for classification and analysis of multivariate observations. pages 281–297, 1967. [26] Martin E., Kriegel, H., Sander, J. and Xu, X. A density-based algorithm for discovering clusters in large spatial databases with noise. KDD ’96, pages 226–231. AAAI Press, 1996. [27] Mei, Q. and Zhou, D. and Church, K. Query suggestion using hitting time. CIKM ’08, pages 469–478. ACM, 2008. [28] Olston, C. and Chi, E.H. Scenttrails: Integrating browsing and searching on the web. ACM Trans. Comput.-Hum. Interact., 10:177–197, September 2003. [29] Shen, D., Pan, R., Sun, J.-T, Pan, J., Wu, K., Yin, J. and Yang, Q. Q2c@ust: our winning solution to query classification in kddcup 2005. SIGKDD Explor. Newsl., 7:100–110. [30] Shen, X., Tan, B. and Zhai, ChengXiang. Context-sensitive information retrieval using implicit feedback. SIGIR ’05, pages 43–50, New York, NY, USA, 2005. ACM. [31] Silverstein, C., Henzinger, M.R., Marais, H. and Moricz, M. Analysis of a very large web search engine query log. SIGIR Forum, 33:6–12, 1999. [32] Swain, M. and Ballard, D. Color indexing. International Journal of Computer Vision, 7:11–32, 1991. [33] White, R. and Huang, J. Assessing the scenic route: measuring the value of search trails in web logs. SIGIR ’10. ACM, 2010. [34] White, R., Bennett, P. and Dumais, S. Predicting short-term interests using activity-based search context. CIKM ’10, 2010. [35] White, R., Bilenko, M. and Cucerzan, S. Studying the use of popular destinations to enhance web search interaction. SIGIR ’07, pages 159–166. ACM, 2007. [36] Xiang, B., Jiang, D., Pei, J., Sun, X., Chen, E. and Li, H. Context-aware ranking in web search. SIGIR ’10. ACM, 2010.