Undergraduate Research Final Report: Estimation of suspended sediments using MODIS 250 m bands in Mayagüez Bay, Puerto Rico José F. Martínez Colón Undergraduate Research 2007 802-03-4097 Advisor: Dr. Fernando Gilbes Santaella Ph.D. Abstract: Large advances in remote sensing techniques now allow the study of large and dynamic areas with little extensive fieldwork. However, it has become increasingly important to develop better algorithms for the accurate estimation of diverse parameters, such as suspended sediments. A study was conducted using the high spatial and temporal resolution of MODIS (Moderate Resolution Imaging Spectroradiometer) multi-spectral sensor onboard the Terra and Aqua satellite. The work tested the reliability of a model developed by Miller and McKee (2004) to measure suspended sediment concentrations using Band 1 (620 – 670 nm) in Mayagüez Bay, Puerto Rico. The tested algorithm gave a low average correlation value (R2 = 0.0845). This study demonstrates that a site-specific algorithm is needed to better estimate suspended sediments this area using MODIS. Keywords: MODIS, Red Band, suspended sediments, Mayagüez Bay Introduction: There are many disciplines in science that have the particular needs of field work. However, as we have seen throughout history, many advances in technology have been developed to facilitate such studies. For these reasons, it has become increasingly necessary to provide new methods and techniques in order to make assessments on different scientific scenarios as accurately as possible. The use of Remote Sensing systems is no exception. For instance, it is suggested that suspended sediments are responsible for changing the optical properties of water in coastal areas (Lugo, 2002), and their estimation with remote sensors are still under validation. The current study focused on the suspended sediments of Mayagüez Bay, located in the west part of Puerto Rico between latitude 18° 10’ N and 18° 16’ N and longitude 67° 10’ W and 67° 14’ W (Figure 1). This area is highly influenced by several rivers (Yagüez, Añasco, and Guanajibo) and anthropogenic activities (Rivera, 2003). The suspended sediments throughout the bay produce changes in ocean color (González, 2005). They can also affect phytoplankton biomass (Gilbes and Yoshioka, 1996). Furthermore, it influences the growth rate of coral reef (Cuevas, 2004). These factors are enhanced by seasonal river discharge and land run-off (Gilbes et al., 2002).
Figure 1: Location of study area: Mayagüez Bay, Puerto Rico (images provided by the GERS Laboratory) A previous undergraduate research was performed to estimate suspended sediments using remote sensing. González (2005) first studied the dynamics of river plumes around Mayagüez Bay using the AVIRIS (Airborne Visible/Infrared imagine Spectrometer) sensor (Figure 2). A new algorithm was also developed to estimate suspended sediments around Puerto Rico. In the same study a preliminary testing of MODIS (Moderate Resolution Imaging Spectroradiometer) imagery was done (Figure 3).
Figure 2: AVIRIS image of the west coast of Puerto Rico (produced by González, 2005) The spatial resolution of AVIRIS helped to provide good results. However, the tested 1 km resolution bands from MODIS proved to be limited. Her work showed that other approaches are needed to study suspended sediments in Mayagüez Bay.
Figure 3: Suspended sediment concentration as measured by MODIS around Puerto Rico (produced by González, 2005) According to Gilbes et al. (2002) it has become increasingly necessary to provide a new empirical algorithm to monitor and understand the dynamics of suspended sediment in Mayagüez Bay, using a more reliable spatial resolution. MODIS spectral bands 1 and 2 of 250 m resolution have proven to be useful in other coastal areas.
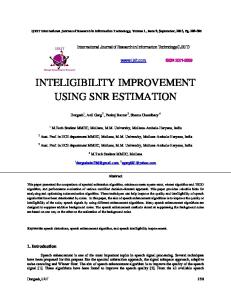
A previous work by Miller and McKee (2004) using that particular spatial resolution provided useful results of total suspended matter (TSM) in the coastal waters off the northern Gulf of Mexico. A linear relationship was established between band 1 (620 – 670 nm) of MODIS Terra and in situ measurements of TSM, providing evidence of the transport and fate of material in coastal environments (Figure 4).
Figure 4: Calibrated images of TSM of the Mississippi River Delta and adjacent waters derived from MODIS Terra Band 1 (from Miller and McKee, 2004) The project presented here followed Miller and McKee (2004) approach. The main purpose of this study was to validate their algorithm in Mayagüez Bay in order to evaluate the dynamics of suspended sediments. It was expected to have results with high degree of precision in respect to field samples and, in turn, provide a new study path to various other research questions. Methods: This project comprised three major phases. The first was data collection. In situ measurements of suspended sediments were obtained from field samplings at different stations in Mayagüez Bay (Figure 5 and Table 1). These were performed throughout several campaigns between 2001 and 2006.
Figure 5: Location of sampling stations throughout Mayagüez Bay. Table 1: Locations and dates of sampling stations Station Number
Station Name
Latitude
Longitude
1
S1, A1*
18 16.00’
67o 12.00’
4
S4, A2*
18o 16.00’
67o 15.20’
5
S5, AAA*
18o 14.40’
67o 11.40’
7
S7
18o 14.40’
67o 13.50’
9
S9
18o 13.14’
67o 10.14’
11
S11
18o 13.14’
67o 12.25’
13
S13, Y1*
18o 12.20’
67o 09.78’
15
S15
18o 12.20’
67o 11.95’
17
S17
18o 11.33’
67o 10.80’
19
S19
18o 11.33’
67o 12.90’
21
S21, G1*
18o 10.25’
67o 11.10’
23
S23
18o 10.25’
67o 13.15’
G2* 18o 10.25’ * = samples in 2005 – 2006
67o 14.80’
24
o
Afterwards, several MODIS images were obtained from NASA Archive Center for the same dates of field measurements. This is a major instrument on the Earth Observing System (EOS)-AM1 and EOS-PM1 missions, Terra and Aqua, respectively. MODIS has the capability to observe nearly the entire earth every two days via a set of 36 spectral bands at nadir geometric instantaneous-fields-of-view (GIFOV’s) of 250, 500, and 1000 m and provide key observations of the atmosphere, oceans, and land surfaces (Barnes et al., 1998). For this study, particular consideration was given to band 1, which has a 250 m spatial resolution and a spectral range of 620-670 nm. The second phase of this project was image preprocessing. The software used was ENVI 4.2 (Environment for Visualization of Images), available at the Computer Laboratory of the Department of Geology at UPRM. First, each image was fixed to the State Plane corresponding Puerto Rico (NAD 83). It was also necessary to create subsets to outline the area of interest. Then, the images were screened and chosen in terms of quality, taking into account cloud coverage over the study area and other image errors. The selected images were corrected for the effect of the atmosphere. The procedure used was the Dark Pixel Subtraction method, which was also used by Miller and McKee (2004). The darkest pixel in each image (lowest reflectance value) using band 2 was selected to fix the standard procedure already implemented in the software. The next step was to apply the following algorithm (as developed by Miller and McKee, 2004): 1140.25*(MODIS Band 1) – 1.91 This equation was applied to the images using the ENVI Band Math function. This way the raw digital values were converted to suspended sediment concentration values Figure 6 shows the relationship found by Miller and McKee (2004) in the Gulf of Mexico, which was used to develop the above algorithm.
Figure 6: Total suspended matter as a function of atmospherically corrected MODIS Terra 250 m Band 1 reflectance (from Miller and McKee, 2004)
The third and final phase was to compare the MODIS estimates with the field data. Each station had to be carefully located on the images using their exact coordinates, and then the values from the corresponding dates were compared. Afterwards, the results were plotted in a Field vs. MODIS data graph to create a regression line and analyze the results. Results: Comparisons between field measurements and MODIS data were difficult due to several concerns of image quality. Few stations were covered with clouds at the time of the field campaigns, therefore they were useless to provide accurate sediment concentrations. Also, some images had errors that made their processing impossible. The suspended sediment concentration that was extracted from image reflectance was compared against the values taken from in situ measurements. The estimated values were very different in most stations, having only few that estimated the sediments accurately (Table 2). The concentration of suspended sediments estimated from the images was several times greater than the other measurements. A graph was developed using these results, having a very low correlation value (R2) of 0.0845 (Figure 7). This shows that despite the MODIS Terra 250 m bands have good spatial resolution the relationship from the model was inconsistent throughout the studied area. Table 2: Concentration of Suspended Sediments as estimated with MODIS using Miller and McKee (2004) algorithm and measured in the field. Sampling Sampled MODIS Field Value Date Stations Estimate clouded 24-Apr-01 stations 25-Apr-01
7
9.95
6.53
26-Apr-01
19 23 1 4 Image Error
28.61 29.61 49.16 10.86
2.12 3.20 23.60 1.95
17 19 21 23 Image Error
29.02 13.95 28.09 9.79
12.90 3.80 6.35 3.80
2-Oct-01 3-Oct-01 4-Oct-01
26-Feb-02 27-Feb-02
clouded stations
21-Aug-02
5 11
46.12 29.87
11.25 6.77
22-Aug-02
19 21 23 5 9 11 13 15 17 19 21 23 1 4 5 7 9 11 13 15 17 19 21 23 clouded stations
151.52 136.08 133.86 16.27 44.15 7.27 12.69 6.74 26.53 22.17 29.09 21.96 41.91 15.20 21.79 15.12 82.32 15.55 23.18 15.47 17.11 15.26 19.10 15.86
6.22 22.10 11.67 13.81 13.41 6.68 12.71 11.74 12.69 6.51 16.98 7.26 6.79 2.96 7.72 3.94 6.84 3.85 9.33 8.42 9.68 2.34 17.23 3.02
A1 A2 AAA Y1 G1 G2 Image Error
64.65 14.49 23.40 30.93 29.85 15.47
3.80 3.89 3.70 2.84 2.78 2.73
A1 A2 G1 G2 Y1 G2
55.43 20.31 28.29 15.58 12.58 0.60
5.13 1.90 19.87 1.97 10.60 1.80
26-Feb-03
27-Feb-03
12-Feb-04
19-Aug-04 10-Mar-05
17-Aug-05 19-Oct-05
6-Dec-05
8-Mar-06
A1 A2 AAA Y1 G1 G2
73.63 41.70 43.88 53.06 59.95 35.13
6.35 2.53 4.03 7.10 24.20 2.12
Measured suspended sediment concentration (mg / l)
30
25
20
R2 = 0.0845
15
10
5
0 0
20
40
60
80
100
120
140
160
MODIS Band 1 suspended sediment concentration
Figure 7: Relationship of Suspended sediment concentrations between field data and MODIS Terra 250 m Band 1 estimates.
Examples of the processed MODIS images are presented in Figure 8.
A
B Figure 8: MODIS Terra 250 m Band 1 images from October 4, 2001 generated using ENVI 4.2 (A: Image after atmosphere correction; B: Image after application of algorithm)
Discussion: MODIS imagery with a spatial resolution of 250 m should provide better results than 1 km imagery. However, this study has shown that its ability to measure suspended sediment over Mayagüez Bay still needs to be revised. The results obtained using the algorithm developed by Miller and McKee (2004) showed values that greatly surpassed the results from field measurements. This is well demonstrated by the low correlation value (R2 = 0.0845). There are several reasons that could explain why this particular model was not appropriate for Mayaguez Bay. Based on the results, there are two main conclusions: the effects of the atmosphere and differences between coastal environments (discharge variations between Mayagüez Bay and Mississippi River delta). The high temporal and spatial resolution that MODIS Terra provides at 250 m has proven to be a valuable tool for monitoring coastal and estuarine waters. However, no robust atmospheric correction method currently exists for these data. The method used by Miller and McKee (2004) of Dark Pixel Subtraction could be used for a wide variety of sky conditions, but it is still vulnerable to noise ratio effects (Shutler et al., 2007). Even more so, the pixels that get mixed with cloud coverage signals influence greatly the estimation of properties, such as suspended sediment concentration. The other possible reason that makes the model inappropriate is the differences between the northern Gulf of Mexico and Mayagüez Bay coastal environments. The main variation is river discharge. The rivers that influence the coastal waters of Mayagüez Bay are Yagüez, Guanajibo, and Añasco, where this last is the principal sediment supplier (González, 2005). According to USGS annual statistics for the project’s time frame, the discharge from this particular fluvial system ranges from 290.8 f3/s to 551.9 f3/s (Table 3). On the other hand, the discharge estimates for the Mississippi River system, range from 200,000 f3/s and 500,000 f3/s (Coupe and Goolsby, 1999). This suggest that the sediment load carried by the river systems in Mayagüez Bay is much lower than in the northern Gulf of Mexico. Also, the amounts of re-suspended sediments are very different. Table 3: Añasco River annual discharge (from US Geological Survey, 2007) Water Year
Discharge (f3/s)
2001 2002 2003 2004
290.8 404.6 304.1 551.9
Further investigation is needed to develop an accurate algorithm to estimate suspended sediment concentration over Mayagüez Bay. It is important to take into account the variables explained before in order to adjust it to better estimate the concentrations measured in the field and make it suitable to the conditions of the studied area. As suggested by Miller and McKee (2004), the use of MODIS Terra 250 m Band 1 can provide good results, since this approach is reasonably robust in coastal and inland waters because scattering from suspended materials frequently dominates the reflectance
spectra when compared to pure water and phytoplankton absorption. It is also important that the atmosphere be corrected using the Dark Pixel Subtraction method, it keeps consistency and simplicity. Conclusion: The use of remote sensing techniques promises to be an excellent tool to estimate suspended sediment concentrations. The spatial and spectral resolution of MODIS Terra 250 m Bands shows that images can be generated with good quality standards. However, the application of this sensor in Mayagüez Bay needs further analyses and understanding of certain variables that may affect the results. The atmospheric conditions and amount of river discharge have a direct effect in the tested algorithm. In order to achieve accurate estimates it is necessary to develop a site-specific algorithm that fits the conditions of this area. It is expected that the development of a more reliable algorithm for the Bay could hold the key for many more research opportunities. References: Barnes, W. L., Pagano, T. S., and Salomonson, V. V., 1998, Prelaunch characteristics of the Moderate resolution Imaging Spectroradiometer (MODIS) on EOS-AM1, IEEE Transactions on Geoscience and Remote Sensing, v. 36, no. 4, p. 10881100. Coupe, R. H. Jr. and Goolsby, D. A., 1999, Monitoring the Water Quality of the Nation's Large Rivers, Mississippi River Basin NASQAN Program, United States Geological Survey, Cuevas, D., 2004, Using IKONOS Images to Evaluate Coral Reefs in Low versus High Sedimentation Environments: Department of Marine Sciences, University of Puerto Rico, Mayagüez. Gilbes, F., Armstrong, R. A., Miller, R. L., Del Castillo, C. E., Rosado, M., and Ramirez, N., 2002, Bio-optical evidence of land-sea interactions in the western coast of Puerto Rico, in Proceedings, Ocean Optics XVI Conference, Santa Fe: Mexico. Gilbes, F., López, J. M., and Yoshioka, P. M., 1996, Spatial and temporal variations of phytoplankton chlorophyll a and suspended particulate matter in Mayagüez Bay, Puerto Rico, Journal of Plankton Research, v. 18, p. 29-43. González E., 2005, Dynamics of river plumes as detected by AVIRIS: Undergraduate Research, University of Puerto Rico, Mayagüez. Lugo, M, 2002, Spatial and temporal variability of suspended sediments and their correlation with optical measurements in the Mayagüez Bay, Puerto Rico, Undergraduate Research, University of Puerto Rico, Mayagüez.
Miller, R. L. and McKee, B. A., 2004, Using MODIS Terra 250 m imagery to map concentrations of total suspended matter in coastal waters, Remote Sensing of Environment, v. 93, p. 259–266. Modis Web, National Aeronautic and Space Administration, Rivera, G., 2003, Sediment dynamics and their temporal variability in the Mayagüez Bay: Undergraduate Research, University of Puerto Rico, Mayagüez.
Shutler, J. D. et al, 2007, Extending the MODIS 1 km ocean colour atmospheric correction to the MODIS 500 m bands and 500 m chlorophyll-a estimation towards coastal and estuarine monitoring, Remote Sensing of Environment, v. 24, p. 521-532. USGS 50144000 Rio Grande de Añasco NR San Sebastian, PR, USGS Surface-Water Annual Statistics for Puerto Rico, 2007, Acknowledgements: I would like to extent my deepest gratitude to the following persons who helped me throughout the development of this project: • • • •
Dr. Fernando Gilbes for his outstanding knowledge and guidance. Patrick Reyes (Ph. D. student) for providing the field data used on this project. William Hernández (Ph. D. student) for his assistance and knowledge of the images and ENVI 4.2 software as well as his experience. Dr. Richard L. Miller for his help in understanding the model under investigation.