Journal of Volcanology and Geothermal Research, 9(1981)99--109
99
Elsevier Scientific Publishing Company, Amsterdam -- Printed in Belgium
ESTIMATION OF HEAT DISCHARGE RATES USING INFRARED MEASUREMENTS BY A HELICOPTER-BORNE THERMOCAMERA OVER THE GEOTHERMAL AREAS OF UNZEN VOLCANO, JAPAN
KOZO YUHARA, SACHIO EHARA and KOICHI TAGOMORI
Faculty of Engineering, Kuyshu University, Fukuoka (Japan) (Accepted June 10, 1980)
ABSTRACT Yuhara, K., Ehara, S. and Tagomori, K., 1981. Estimation of heat discharge rates using infrared measurements by a helicopter-borne thermocamera over the geothermal areas of Unzen volcano, Japan. J. Volcanol. Geotherm. Res., 9: 99--109. UnT.en volcano is situated on Shimabara Peninsula, western Kyushu, Japan. On the flank of the volcano, the Obama, Unzen and Shimabara hot springs are aligned in a direction from the southwest to the northeast across the peak. At Obama and Shimabara, heat is transferred mainly by water flow. But at Unzen heat is transferred by the discharge of natural steam and by conduction as well as water flow. In order to estimate the heat discharge by mechanisms other than water flow, infrared measurements by a helicopterborne thermocamera were conducted over the Unzen hot spring area. The heat discharge was calculated from the thermal image by a method based on heat balance of the ground surface resulting in a value of 1.9 × 10 ' cal/s (7.9 MW). The heat discharged by all mechanisms including that by water flow is estimated to be 5.0 x 10⁶ eal/s (21 MW). Similar preliminary estimates have been made for heat discharge at the Obama and Shimabara hot springs giving values of about 1.2 × 10⁷ cal/s (50 MW) and 1.0 X l 0 s cal/s (0.4 MW), respectively. These values indicate that the heat discharge decreases with distance from the southwest to the northeast direction across the volcano. The total heat discharge from three hot spring areas on Unzen volcano is about 1.7 x 10⁷ cal/s (71 MW). The heat balance method appears useful for quantitative analysis of regional trends but its accuracy may not be always sufficient for detailed surveys. Several methods of determining heat flow, including the heat balance method, were compared at a test field in the Unzen hot spring area. The values obtained by the heat balance method coincide roughly with the other results but more detailed analysis is necessary to improve the accuracy of current methods of geothermal measurements.
INTRODUCTION U n z e n v o l c a n o , w h i c h is c o m p o s e d o f t h r e e lava d o m e g r o u p s o n a g e n t l e s l o p e o f p y r o c l a s t i c r o c k s , is s i t u a t e d o n S h i m a b a r a P e n i n s u l a , w e s t e r n K y u s h u , J a p a n (Fig. 1). N o t i n f r e q u e n t e r u p t i o n s o c c u r r e d d u r i n g h i s t o r i c ages w i t h t h e last e r u p t i o n i n 1 7 9 2 ( K a t s u i , 1 9 7 1 } ; Mt. M a y u y a m a s t a n d i n g a t t h e n o r t h eastern flank of the volcano collapsed and many of the inhabitants were 0377-0273/81/0000--0000/$02.50 © 1981 Elsevier Scientific Publishing Company
100
U 0
II
w
~
0
~.= 0
~
0
•~ N .~
101
killed or injured. On the flank of the volcano, the O b a m a h o t springs, the Unzen h o t springs and Shimabara h o t springs are arranged from the southwest to the northeast across the maximum peak. At Obama and Shimabara, heat is transferred mainly b y water flow, so the heat discharge can be estimated from the temperature and the volume o u t p u t of the water. But, at Unzen heat is transferred b y the discharge of natural steam and b y conduction as well as water flow. Generally, with such complex geothermal phenomena different methods are required for estimating values of heat discharge. Furthermore, with a single method it is very difficult to estimate precisely and rapidly the total heat discharge from a wide area. However, a new method has now been developed for estimating values of heat discharge based on heat balance of the ground surface (8ekioka and Yuhara, 1974). At Unzen, the heat discharge was estimated b y the heat balance method using infrared thermal images obtained b y a helicopter-borne thermocamera. This method provides useful data b u t its accuracy may n o t be always sufficient for detailed surveys. Consequently several different methods including the heat balance method were compared at a test field in the Unzen hot spring area. HELICOPTER-BORNE THERMOGRAPHY
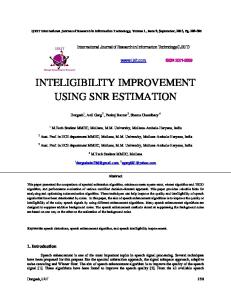
Due to the low flight altitude, a helicopter-borne infrared measurement can give high-resolution temperature data over a relatively small domain (crucial for Unzen where the hot spring area is a b o u t 0.6 km2). The details of the observation system have already been described elsewhere (Yuhara et al., 1978). In this paper, the system is only briefly outlined. The block diagram of the observation and reproduction system is shown in Fig. 2. The observation OBSERVATION SYSTEM
> ~-,~ #
[
TV CAMERA
I
AERIAL VIEW
].~ MONITOR TV
I';
........
~
IL
DATA
,~
4J ANN
If-
I
THERMALIMAGERY
•
-~l RECORDER I
L IISOTHERMALI I DIGITAL 1 I~)REAsoR ~-~ PRINTER [ REPRODUCTION SYSTEM
r ........ i VT R L........
~ I--MONITOR I ,~--~ TV J I
[DATA H RECORDER
I
DISPLAY i~{ ISOTERMAL ]__~ DIGITAL AREA PRINTER UNI T PROCESSOR
Fig. 2. Block diagram of the infrared observation and reproduction system. The video tape recorder (VTR) is not yet part of our system.
102
system is installed in a helicopter which hovers over a target area. The infrared signal received through a reflecting mirror is detected by the thermocamera head and a thermal image of television type is given on the display unit. At the same time, the thermal data are recorded on a magnetic tape for reproduction in the laboratory. The output signal from the display unit is connected to the isothermal area processor, which prints out digitally the area ratio of the isothermal zones on the thermal image. The heat balance method gives the difference of the heat flux A G at two arbitary points where the difference of the surface temperatures is A 0. Such a relation is described as:
G = e(1--0.09m) ( 0 . 5 2 + 0 . 0 6 5 x / ~ ) 0 4 (0 +273) 4 +
PaCpD(l+7)A 0
(I)
where e is the emissivity, m the cloudiness, ew the vapour pressure, Pa the density of the air, D the transfer velocity, - / t h e inverse of the Bowen ratio, 0 the surface temperature and o the Stefan-Boltzmann constant (Sekioka and Yuhara, 1974). These parameters are determined from micrometeorological observations near the ground surface. If a surface temperature is chosen at a non-geothermal area to represent standard temperature, the absolute geother-
Fig. 3. D i s t r i b u t i o n o f s m a l l g e o t h e r m a l u n i t s ( J i g o k u ) in t h e U n z e n h o t s p r i n g area. 1 = K y u h a c h i m a n - J i g o k u , 2 = Seishichi-Jigoku, 3 = Hachiman-Jigoku, 4 = Oito-Jigoku, 5 = D a i k y o k a n - J i g o k u , 6 = K o - J i g o k u . T h e r e c t a n g l e s s h o w t h e a r e a s c o v e r e d b y t h e respective observations.
103 mal heat flux can be obtained at any arbitary point in the geothermal area. Micrometeorological measurements are made at the same time as the helicopter hovers over the geothermal area. The Unzen hot spring area is composed of several small units with areas ranging from a b o u t 10--150 × 104 cm 2 as shown in Fig. 3. Data were obtained b y hovering over each o f these small geothermal units. Observations were completed on June 23, 1978, using a Fuji-Bell 204B helicopter. HEAT DISCHARGE ESTIMATION USING THERMAL IMAGES Thermal images were obtained for the six small geothermal units shown in Fig. 3. They are called Kyuhachiman-Jigoku, Seishichi-Jigoku, HachimanJigoku, Oito-Jigoku, Daikyokan~Jogoku and Ko~Jigoku. These small units are characterized b y white
(2)
Examples o f the technique for estimating heat discharge are shown in Tables 1 and 2. Heat discharge rates for other small units were obtained b y the same manner. Results for each geothermal unit are summarized in Table 3. For Hachiman-Jigoku and Daikyokan~ligoku, only partial coverage was possible because of operational difficulties during the hover phase. Data were obtained for a b o u t t w o thirds of the first area and half of the second area. Using these techniques it is estimated that heat is transferred at Unzen by the discharge of steam and b y conduction at rates of 1.9 × 10⁶ cal/s (7.9 MW). Additionally, the heat discharged b y water flow can be estimated at 3.1 × 10⁴ cal/s (13.0 MW) using the temperature and the o u t p u t volume data obtained b y the Unzen meteorological station (1978). Accordingly, the total heat discharge from the Unzen h o t spring area has been determined as 5.0 × l 0 s cal/s (21 MW). A b o u t 40% of the total heat discharge is transferred by steam and b y conduction and a b o u t 60% is attributed to water flow. Similar-
104
Fig. 4. Data of Oito-Jigoku: (a) aerial view, (b) monochromatic continuous temperature pattern, (c) 5-stage discontinuous isothermal pattern (see text for reference). Fig. 5. Data of Ko-Jigoku: (a) aerial view, (b) monochromatic continuous temperature pat. tern, (c) 5-stage discontinuous isothermal pattern (see text for reference).
105 TABLE 1 Heat discharge from Oito-Jigoku 0 (°C)
ff (°C)
4o (°C)
AG (HFU)
S (106 cm ~ )
G (105 cal/s)
27.5~31.1 31.1~34.6 34.6
29.3 32.9 36.4
8.1 11.7 15.2
2268 3276 4256
80.7 64.1 31.4
1.83 2.10 1.34
Total 176.2 × 10⁶
5.27 × 10⁵
0 = range of observed temperature, $ = mean temperature, 40 = temperature difference between mean temperature and standard temperature, AG = difference of heat flow, S = area concerned, G = heat flow. TABLE 2 Heat discharge from Seishichi-Jigoku (symbols as in Table 1) 0 (°C)
$ (°C)
AO (°C)
AG (HFU)
S (106 cm 2)
G (10 s cal/s)
27.5~31.1 31.1~34.6 34.6~36.4 36.4~43.6 43.6--50.8 50.8
29.3 32.9 35.5 40.4 47.2 54.4
8.1 11.7 14.3 18.8 26.0 33.2
2268 3237 4004 5264 7280 9296
9.57 10.0 2.24 7.28 3.15 1.03
0.22 0.33 0.09 0.38 0.23 0.10
Total 11.46 × 10⁶
1.35 × 10⁵
TABLE 3 Heat discharge from the small geothermal units in the Unzen hot spring area
Kyuhachiman Seishichi Hachiman Oito Daikyokan Ko-Jigoku
Heat discharge (lO s cal/s)
Area (10 6 cm 2)
Average heat flow (HFU)
3.50 1.35 3.80 5.27 1.36 0.47
140.0 33.27 127.3 176.2 39.42 13.09
2500 4060 2990 2990 3450 3590
ly, t h e t o t a l h e a t d i s c h a r g e r a t e s a t O b a m a a n d S h i m a b a r a are t e n t a t i v e l y e s t i m a t e d a t a b o u t 1 . 2 × 10⁷ c a l / s ( 5 0 MW) a n d 1 . 0 × l 0 s c a l / s ( 0 . 4 MW), respectively. It appears that the rates of heat discharge decrease with distance f r o m t h e s o u t h w e s t to the n o r t h e a s t d i r e c t i o n across the volcano. Average h e a t f l o w ( h e a t d i s c h a r g e d i v i d e d b y t h e a r e a c o n c e r n e d ) is l a r g e s t a t Seish i c h i - J i g o k u a n d s m a l l e s t a t K y u h a c h i m a n - J i g o k u as s h o w n i n T a b l e 3. S u c h a r e s u l t c o r r e s p o n d s w e l l t o v i s u a l o b s e r v a t i o n s o f t h e r m a l a c t i v i t y i n t h e field.
106 EXAMINATION
OF THE VARIOUS METHODS
OF ESTIMATING HEAT DISCHARGE
In the previous section, we estimated the heat discharge using the heat balance method. Although this method is convenient and useful, its accuracy is n o t always sufficient for detailed surveys; in particular these observations may contain errors related to perturbations of the ground sur£ace. Consequently it is useful to compare the heat balance method with other more direct techniques. Such measurements were c o n d u c t e d at KyuhachimanJigoku. Shallow ground temperatures (at a depth o f 5 cm) were first measured in order to clarify the outline of the ground temperature distribution in this area, as shown in Fig. 6, from which six representative points for comparative measurements were chosen. The temperatures at these points were 12.5°C (point 20), 19.5°C (point 7), 27.0°C (point 29), 49.6°C (point 32), 74.7°C (point 33) and 96.5°C (point 30). The investigation at these six points proceeded with the following sequence: (1) measurement o f conductive heat flow at 75 cm depth, (2) measurement of conductive heat flow at 10 cm depth, (3) measurement of convective heat flow at the surface b y Bensemaia's calorimeter method (Benseman, 1959), and (4) measurement of conductive and convective heat flow b y the heat balance method. Conductive heat flow at 75 cm depth was determined using the mean temperature gradient between 0.5 and 1 m depths and the thermal conductivity N
~
,<,,...,L///KYUHACHIMAN-JIGOKU~
I
/•
°
\
I
,
,
I
Fig. 6. Shallow-depth isotherms at Kyuhachiman-Jigoku. Solid and open circles are the observation points o f temperature at 5 cm depth and those o f 120 cm depth, respectively.
107 measured b y th e p r obe m e t h o d at 75 cm depth. Conductive heat flow at 10 cm d e p t h was measured directly using a heat flow m e t e r constructed from a thin disk o f k n o w n conductivity housing a series o f thermocouples. At poi nt 20, t h e ground t e m p e r a t u r e is very low and the t e m p e r a t u r e at a d e p t h o f I m seems to be nearly equal to t he standard value o f t he non-geothermal area ( F u k u t o m i , 1951). Therefore, it is assumed t h a t the anomalous geothermal heat flux at p o in t 20 is negligible and t he values shown in Table 4 are calculated relative to p o in t 20. T he excess conductive heat flows near points 30, 32, and 33 are also considered negligible, reflecting near-zero geothermal gradients caused b y t h e escape of steam at shallow d e p t h in t hat area (points 1--4 o f Figs. 6 and 7). In particular f or p o i n t 30 convective transfer o f steam appears to d o m i n a t e and conductive heat transfer remains very small even near t h e surface o f t h e ground. T h e relation between t h e values o f heat flux obtained by the heat balance and t h e alternative m e t h o d s is shown in Fig. 8. From this relationship it can be concluded that: TABLE4 Heat flow measured by four different methods at the six representative points in Kyuhachiman-Jigoku Observation point
Heat balance method (HFU)
Benseman's" method (HFU)
Heat flow meter method (HFU)
Conduction probe method (HFU)
20 7 29 32 33 30
0 0.26 × 10 s 0.29 1.4 1.3 1.8
0 0.16 x 10 s 0.08 1.21 0.66 1.26
0 0.04 × 10³ 2.3 7.1 8.0 0.09
0 2.4 x 10² 2.2 0.0 0.0 0.0
Temperatu re 0
10
20.
30
40 .
50
_ 6 0.
(*C) . 70.
. 80
90
100
20
40 SO 80
tOO 120
Fig. 7. Vertical dmt~ibution of the ground temperature at Kyuhachiman-Jigoku for locations indicated in Fig. 6.
108
(1) Conductive heat flow at 75 cm depth is less than 1% of that obtained by the heat balance method. (2) Conductive heat flow at 10 cm depth is less than 10% of that obtained by the heat balance method. (3) Convective heat flow obtained by Benseman's method is about one half of that obtained by the heat balance method. Observations (1) and (2) demonstrate that measurements of conductive heat flow at a shallow depth are not important in the total heat discharge estimation. In (3) the difference may result from the fact that Benseman's method is primarily sensitive to vapour loss while the heat balance method also includes the convective fluid and conductive heat flow. However, it is clear in ( 1 ) and (2) that the conductive heat flow is secondary in magnitude and the discrepancy in (3) must reflect unspecified approximations in either or both techniques possibly related to vapour or steam flow characteristics. 106
• BENSEMAN / (HFU} OHeotFlowMeter(1Ocmd e e p ) / /
Z~ConductionProbe(?Scmdeep) / /
10S .
.
.
/ { /I°
.
.
r
10s (HFU) 106 HEATSALANCEMETHOO Fig. 8. R e l a t i o n b e t w e e n t h e heat f l o w s o b t a i n e d b y t h e heat balance m e t h o d (QI~B and those o b t a i n e d b y o t h e r m e t h o d s (QD)- • = c o n v e c t i v e heat f l o w o b t a i n e d b y Bermeman's m e t h o d ( Q B ) ; o = c o n d u c t i v e heat f l o w at a d e p t h o f 10 era; A = c o n d u c t i v e heat f l o w at a d e p t h o f 75 era, 104
ACKNOWLEDGEMENTS
The authors wish to thank Assist. Prof. Kazuya Ota, of the Shimabara Volcano Observatory, Kyushu University for his kind instructions in the planning o f this experiment. Thanks are also due to Nakanihon Air Service Co., Nagoya, for their aid in the air-borne observation.
109
REFERENCES Benseman, R.F., 1959. The calorimetry of steaming ground in thermal areas. J. Geophys. Res., 64: 123--126. Comb, A.C., Weickmann, H.K., Marder, C. and Tebo, A., 1965. Application of infrared radiometers to meteorology, J. Appl. Meteorol., 4: 253--262. Fukutomi, T., 1951. O n the possibilityof the prospection of hot springs by the geographic al distribution of underground temperature in 1 m depth (1st paper), Geophys. Bull. Hokkaido Univ., 1:1--14 (in Japanese with English abstract). Katsui, Y. (Editor), 1971. List of the world active volcanoes. Bull. Volcanic Eruptions, Spec. Issue, 72. Sekioka, M. and Yuhara, K., 1974. Heat flux estimation in geothermal area based on the heat balance of the ground surface. J. Geophys. Res., 79: 2053--2958. Unzen Meteorological Station, 1978. Observation of hot springs, riversand springs in Shimabara Peninsula. Tech. News (Fukuoka Meteorological Agency), pp. 153--161 (in Japanese). Yuhara, K., Sekioka, M. and Ehara, S., 1978. Infrared measurement on Satsumaiwojima island, Kagoshima, Japan, by helicopter-borne thermocarnera, Arch. Meteorol. Geophys. Bioklimatol., Ser. A, 27: 171--181.