Estimation of accuracy and bias in genetic evaluations with genetic groups using sampling J. M. Hickey, M. G. Keane, D. A. Kenny, A. R. Cromie, H. A. Mulder and R. F. Veerkamp J Anim Sci 2008.86:1047-1056. doi: 10.2527/jas.2007-0653 originally published online Feb 13, 2008;
The online version of this article, along with updated information and services, is located on the World Wide Web at: http://jas.fass.org/cgi/content/full/86/5/1047
www.asas.org
Downloaded from jas.fass.org by John Hickey on July 11, 2010.
Estimation of accuracy and bias in genetic evaluations with genetic groups using sampling1 J. M. Hickey,*†‡2 M. G. Keane,† D. A. Kenny,‡ A. R. Cromie,§ H. A. Mulder,* and R. F. Veerkamp* *Animal Breeding and Genomics Centre, Animal Sciences Group, PO Box 65, 8200 AB, Lelystad, the Netherlands; †Grange Beef Research Centre, Teagasc, Dunsany, Co. Meath, Ireland; ‡School of Agriculture, Food and Veterinary Medicine, College of Life Sciences, University College Dublin, Belfield, Dublin 4, Ireland; and §Irish Cattle Breeding Federation, Shinagh House, Bandon, Co. Cork, Ireland
ABSTRACT: Accuracy and bias of EBV are important measures of the quality of genetic evaluations. A sampling method that accounts for the uncertainty in the estimation of genetic group effects was used to calculate accuracy and bias of estimated effects. The method works by repeatedly simulating phenotypes for multiple traits for a defined data and pedigree structure. These simulated values are analyzed using BLUP with genetic groups in the relationship matrix. Accuracies and biases are then calculated as correlations among and differences between true and estimated values across all replicates, respectively. The method was applied to the Irish beef production data set for 15 traits and with 15 genetic groups to account for differences in breed means. Accuracy and bias of estimated genetic group effects, estimated comparisons between genetic group effects, EBV within genetic group, and EBV across genetic group were calculated. Small biases were detected for most estimated genetic group effects and most estimated comparisons between genetic group effects. Most of these were not important relative to the
phenotypic SD of the traits involved. For example, a bias of 0.78% of the phenotypic SD was detected for carcass conformation in Aberdeen Angus. However, one trait, calf quality, which had few performance records in the data set, displayed larger bias, ranging from −10.31 to 5.85% of the phenotypic SD across the different estimated genetic group effects. Large differences were observed in the accuracies of genetic group effects, ranging from 0.02 for feed intake in Holstein, which had no data recorded, to >0.97 for carcass conformation, a trait with large amounts of data recorded in the different genetic groups. Large differences were also observed in the accuracies of the comparisons among genetic group effects. The accuracies of the EBV within genetic group and EBV across genetic group were sometimes different; for example, carcass conformation in Belgian Blue had an average accuracy within genetic group of 0.69 compared with an average accuracy across genetic group of 0.89. This suggests that the accuracy of genetic groups should be taken into account when publishing EBV across genetic groups.
Key words: accuracy, bias, data quality, genetic groups, multiple breed genetic evaluations ©2008 American Society of Animal Science. All rights reserved.
INTRODUCTION The quality of genetic evaluations is reflected by the accuracy and bias of estimated effects. Accuracy reflects the quality and quantity of the data, whereas bias reflects the systematic estimation error. When
1 The authors acknowledge Mario Calus, Marco Pool, Debbie Wilhelmus, Ross Evans, Donagh Berry, and Ismo Stranden for useful discussions and the Irish Cattle Breeding Federation for providing the data. 2 Corresponding author:
[email protected] Received October 12, 2007. Accepted January 29, 2008.
J. Anim. Sci. 2008. 86:1047–1056 doi:10.2527/jas.2007-0653
genetic evaluations using BLUP assume homogeneous means in founders, the accuracy and bias of an EBV are the correlation and difference between the EBV and its corresponding true value, respectively. To account for heterogeneous means in founders, genetic groups in the relationship matrix are used in BLUP models (Westell et al., 1988). Such models are common in within-breed (Phocas and Laloe, 2004), across-breed (Sullivan et al., 1999), and international (Schaeffer, 1994) evaluations. In these circumstances the accuracy of an EBV across genetic group depends on the accuracy of the estimated genetic group effects and the EBV within genetic group, and any sampling covariances among these effects (Van Vleck et al.,
1047 Downloaded from jas.fass.org by John Hickey on July 11, 2010.
1048
Hickey et al.
1992). Bias in estimated genetic group effects or EBV within genetic group may bias EBV across genetic group and may be due to sampling covariances among these. Ideally the exact method would be used to calculate the accuracy of EBV within or across genetic group. Because this is infeasible in most national data sets, several methods to approximate accuracy within genetic group have been developed. These give biased approximations for certain data structures (e.g., Tier and Meyer, 2004). Unbiased approximations of accuracy within genetic group can be calculated using sampling (Garcia-Cortes et al., 1995; Fouilloux and Laloe, 2001). No method exists to approximate accuracy across genetic group and methods exist only to calculate retrospective bias (Reverter et al., 1994). The aim of this work was to extend the sampling method to evaluate genetic group effects and EBV within and across genetic groups, in terms of accuracy and bias, and to use this method to evaluate the Irish multiple-breed beef cattle data set.
MATERIALS AND METHODS
the pedigree trace to a founder genetic group. A matrix, B, of dimension g × n, of founder mean values for each genetic group g represented in the pedigree values for each of the n traits, is simulated. For each trait, the founder mean values for each genetic group are simulated from a normal distribution with a mean of zero and a variance equal to the breed variance for that trait in the population under analysis. For each animal i in the pedigree, a vector uagi = bi + uwgi of true breeding values for each of n traits is simulated, dependent upon the status of i’s parents j and k. If both j and k are unknown, then each element in bi is given the average of its founder genetic groups and each element of uwgi is simulated as LGz. LG is obtained by Cholesky decomposition of VG, the genetic covariance matrix of the traits, and z is a multivariate random-sampled vector with a mean of zero and a covariance matrix I. If one parent, say j, is known, then bi is given the average of the genetic group value of the known parent, bj, and the founder genetic group value for the unknown parent, Bg, and uwgi = 0.5(uj) +
Animal Care and Use Committee approval was not obtained for this study because no animals were used; rather, only an existing database was used (The Irish Cattle Breeding Federation Database). Accuracy of an EBV is calculated as the correlation between the EBV and its corresponding true breeding value. Bias is calculated as the difference between the EBV and its corresponding true breeding value. For animal i, rwgi =
cov (uwgi, uˆ wgi)
√var (uwgi) var (uˆ wgi)
and
biaswgi = uwgi −uˆ wgi, where rwgi is the accuracy of the EBV within genetic group (uˆ wgi) and uwgi is the true breeding value within genetic group. Using a sampling process, the variances and covariances required for rwgi can be estimated from the empirical distribution of uˆ wgi and uwgi (Fouilloux and Laloe, 2001), and bias can be detected using the mean error across all samples. When genetic groups are used in the relationship matrix, uagi = bi + uwgi and uˆ agi = bˆ i + uˆ wgi, where uagi is the true breeding value across genetic group and bi is the true genetic group effect for animal i. The sampling method can be extended to account for this and for accuracy and bias of bˆi and uˆ agi, and comparisons among different bˆi and uˆ agi can be calculated.
Methodology Simulation of True Genetic Values. In a genetic evaluation model with genetic groups, all animals in
√0.75 (LGz). If both parents j and k are known, then
bi is taken to be the average of bj and bk, and uwgi = 0.5 (uj) + 0.5 (uk) + √0.5 (LGZ). This results in a matrix of true breeding values with a distribution N(Qm, A ⊗ VG), where Q is an incidence matrix relating animals to m, the means of the founder genetic groups of which they are composed, and A is the relationship matrix between all animals in the pedigree. Simulation of Phenotypic Values. A vector yi of phenotypic values for each trait is generated for each animal i as yi = uagi + ei, where ei = LEz is a vector of random residual values for each trait, and LE is obtained by Cholesky decomposition of VE, the residual covariance matrix for the traits. Values of fixed effects do not affect the distribution of random variables (Garcia-Cortes et al., 1995) and are simulated with values of zero.
Estimation of Genetic Group Values and Breeding Values. Mixed model equations are set up using genetic groups in the relationship matrix and appropriate fixed effects and solved to obtain estimated genetic group values and EBV across genetic group. The EBV within genetic group are obtained by subtracting estimated genetic group values, weighted by the appropriate breed composition, from the EBV across genetic group.
Sampling Process and Calculation of True Accuracies. The whole process is repeated several times, and the accuracy of the genetic group effects, the accuracy of the EBV within genetic group, the accuracy of the EBV across genetic group, and the accuracies of comparisons among the different genetic groups are calculated as the correlations between the true and estimated values across all of the replicates. Bias in these estimates is calculated as the average of the
Downloaded from jas.fass.org by John Hickey on July 11, 2010.
1049
Accuracy and bias in genetic evaluations
national genetic evaluation, which evaluated the direct genetic effects for 15 traits using data on purebred and crossbred animals of 35 breeds, of which 8 breeds dominated. Maternal effects are currently not included in the Irish beef genetic evaluation due to data limitations. Of the 15 traits, 8 (carcass weight, carcass conformation, carcass fatness, cull cow BW, weaning weight, live BW, feed intake, and calf quality) were breeding goal traits, and 7 were correlated linear type traits included as predictors. Most of the 493,092 animals with records on at least one trait had information only on subsets of traits (Table 1), with different breeds tending to have records on particular subsets of traits. Most of the information for some breeds and traits came from crossbreds; for others, it came from purebreds. For example, data on carcass weight, conformation, and fatness were dominated by Holsteins. Data for these traits in most of the other breeds were from the offspring of sires of these other breeds and Holstein dams. Feed intake was primarily recorded on purebred sires of terminal sire breeds at a central performance test station under carefully controlled data recording and environmental conditions. Linear type traits were primarily recorded on purebred Charolais and Limousin. With the exception of the feed intake and some weaning and live BW records, all data were recorded under field conditions. Fifteen genetic groups were defined, 1 for each of the 14 most-numerous breeds and 1 for the remaining breeds. The matrix B was simulated with each trait having a mean of zero and a variance that was set equal to the variance of the genetic group solutions from the January 2007 routine evaluation (Table 2). The VG and VE from the same evaluation were also
Figure 1. Confidence intervals for different numbers of replicates for different levels of accuracy. differences in the true and estimated values across all of the replicates. As the number of replications increases, estimates of accuracy and bias converge to their true values. To determine the number of replicates required to negate the effects of sampling error, confidence intervals for different values of true accuracy for different numbers of replicates were calculated using Fisher z transformations (Figure 1). As the true accuracy was reduced, the confidence interval increased. As a compromise between computing time and sampling error, we deemed 350 replicates to be sufficient, because the confidence interval varied between 0.002 and 0.104.
Application to Data This method was applied to the Irish multiple-breed beef cattle data set used for the January 2007 routine
Table 1. Number of purebred AI sires of each breed, total number of records, and average number of records per AI sire for each of the traits for each of the 7 breeds1 with the most AI sires in the Irish Cattle Breeding Federation database Group1 All breeds Number of purebred AI sires
AA
493,092 304,888 304,589 304,345 65,000 52,162 59,045 2,491 80,473 80,456 79,377 71,933 80,405 71,900 79,334 6,633
CH
194
210
269.64 71.73 71.69 71.68 2.69 6.16 10.42 0.26 5.60 5.60 5.06 3.56 5.60 3.57 5.06 0.97
323.46 88.74 87.80 87.70 3.57 7.13 9.38 0.18 6.42 6.41 5.90 2.83 6.41 2.83 5.90 2.25
No. of records All traits Carcass weight Carcass conformation Carcass fatness Cull cow BW Weaning weight Live BW Feed intake Development of hindquarter Height at withers Length of back Length of pelvis Loin depth Width at withers Width behind withers Calf quality
BB
HE
HO
LI
374 251 1,156 277 Average numbers of records per sire per breed 450.43 17.45 17.37 17.32 1.64 27.36 28.26 1.10 49.22 49.17 48.68 46.08 49.12 46.05 48.64 2.95
79.16 16.91 16.88 16.88 0.75 5.98 8.51 0.19 1.92 1.92 1.82 1.75 1.92 1.75 1.82 0.17
1
267.30 77.54 77.53 77.44 29.08 1.46 3.34 0.00 0.16 0.16 0.10 0.08 0.16 0.08 0.10 0.07
700.94 35.64 35.60 35.54 2.28 23.24 25.44 2.59 78.78 78.79 77.49 73.03 78.70 72.97 77.47 3.37
AA = Aberdeen Angus, BB = Belgian Blue, CH = Charolais, HE = Hereford, HO = Holstein, LI = Limousin, and SI = Simmental.
Downloaded from jas.fass.org by John Hickey on July 11, 2010.
SI 223 224.53 14.73 14.72 14.71 1.35 15.43 16.23 2.00 21.31 21.30 21.17 19.17 21.30 19.17 21.14 0.78
1050
Hickey et al.
Table 2. Breed (σb2), additive genetic (σa2) and residual (σe2) variance used to generate true breeding values for the 15 traits
Carcass weight, kg Carcass conformation, units Carcass fatness, units Cull cow BW, kg Weaning weight, kg Live BW, kg Feed intake, units Development of hindquarter, units Height at withers, units Length of back, units Length of pelvis, units Loin depth, units Width at withers, units Width behind withers, units Calf quality, €
RESULTS
σb2
σ a2
σe2
478.08 1.30 0.56 536.15 59.47 361.84 0.07 0.50 0.05 0.07 0.03 0.27 0.16 0.29 127.78
468.00 0.97 0.49 448.00 1,040.00 2,141.00 0.33 0.49 0.28 0.18 0.16 0.47 0.62 0.51 160.00
406.00 0.68 1.08 664.00 1,312.00 2,078.00 0.34 0.99 0.49 0.41 0.41 1.21 1.17 0.98 240.00
Trait
sion of PEST (Groeneveld, 1990) compiled for a 32bit PC.
used (Table 2 and Table 3). Only animals having a phenotypic value for a trait in the January 2007 routine evaluation were given a simulated phenotypic value. Accuracy and bias of estimated genetic group effects and of the comparisons among genetic groups, and accuracy of the EBV within genetic groups and of the EBV across genetic groups were calculated for sires recorded as AI sires in the Irish Cattle Breeding Federation database. Computation was carried out on several computers, one of which was a 64-bit PC, with a 2.40-GHz, AMD Operaton dual-core processor, and 8 gigabytes of RAM. A program was written in Fortran 90 to simulate the true breed effects, true breeding values, and phenotypes. Mixed model equations were solved using a ver-
Computing Time On the 64-bit PC, 4 replicates could be run simultaneously in 462 min, with the solving of the mixed model equations taking 98.6% of this time. All 350 replicates could have been completed on this machine in 674 h.
Bias and Accuracy of Estimated Effects Results presented here cover the 7 numerically most important breeds in the data set for 6 breeding goal traits. Results are not presented for the minor breeds, for the linear type traits, or for carcass weight and carcass fatness. Carcass weight and carcass fatness have data structure almost identical to carcass conformation, with any differences in accuracy and bias being due to differences in relevant variance components and correlations. Accuracy and bias of estimated genetic group values, of the comparisons between different estimated genetic group values, and of EBV within genetic group and across genetic group of AI sires are presented.
Bias and Accuracy of Genetic Group Effects. Small biases in the estimated genetic group effects were observed for most traits (Table 4). When expressed as a percentage of the phenotypic SD of the traits involved, most of these were not important (Table 2) and only in 3 cases were the biases significantly different from zero (P < 0.05): carcass conformation for the Simmental genetic group, and calf quality for the Belgian Blue and Hereford genetic groups. For carcass conformation the bias ranged from 0.00 to 1.63% of
Table 3. Heritabilities (on the diagonal), genetic correlations (above the diagonal), and residual correlations (below the diagonal) used to simulate true breeding values for the 15 traits1 Trait
Carc Wt
Carc Conf
Carc Fat
Cull Wt
Wean Wt
Live Wt
Feed Int
Dev Hq
Ht With
Len Back
Len Pelv
Loin Depth
Width at With
Width b With
Calf Qual
Carc Wt Carc Conf Carc Fat Cull Wt Wean Wt Live Wt Feed Int Dev Hq Ht With Len Back Len Pelv Loin Depth Width at With Width b With Calf Qual
0.54 0.31 −0.01 0.00 0.28 0.30 −0.02 0.19 0.34 0.29 0.23 0.18 0.22 0.19 0.15
0.49 0.59 0.01 0.00 −0.06 −0.05 −0.62 0.12 −0.05 0.02 −0.04 0.07 0.07 0.05 0.40
−0.29 −0.16 0.31 0.00 −0.03 0.03 0.44 −0.04 −0.03 0.00 0.01 0.04 0.03 0.01 −0.20
0.57 0.04 −0.65 0.40 0.20 0.30 0.00 0.16 0.20 0.23 0.20 0.16 0.17 0.16 0.00
0.35 −0.09 −0.34 0.45 0.44 0.73 0.42 0.38 0.44 0.41 0.36 0.40 0.39 0.41 0.20
0.41 −0.06 −0.30 0.57 0.92 0.51 0.59 0.41 0.46 0.43 0.38 0.43 0.45 0.45 0.20
0.46 −0.09 0.20 0.36 0.59 0.71 0.49 0.22 0.32 0.27 0.24 0.30 0.24 0.26 0.00
0.53 0.58 −0.49 0.39 0.64 0.65 0.37 0.33 0.24 0.25 0.28 0.51 0.49 0.54 0.50
0.60 −0.02 −0.24 0.48 0.68 0.67 0.66 0.49 0.36 0.67 0.60 0.31 0.30 0.35 0.00
0.63 0.07 −0.30 0.56 0.68 0.69 0.57 0.54 0.94 0.31 0.56 0.33 0.32 0.33 0.00
0.64 0.13 −0.29 0.46 0.62 0.65 0.61 0.57 0.94 0.94 0.28 0.33 0.33 0.35 0.00
0.63 0.55 −0.50 0.47 0.71 0.69 0.43 0.92 0.58 0.65 0.66 0.28 0.51 0.56 0.30
0.59 0.49 −0.42 0.29 0.64 0.66 0.40 0.83 0.55 0.60 0.67 0.89 0.35 0.68 0.35
0.60 0.54 −0.40 0.37 0.69 0.70 0.44 0.88 0.58 0.66 0.66 0.93 0.94 0.34 0.50
0.15 0.40 −0.20 0.00 0.20 0.20 0.00 0.50 0.00 0.00 0.00 0.30 0.35 0.50 0.40
1 Carc Wt = carcass weight, Carc Conf = carcass conformation, Carc Fat = carcass fatness, Cull Wt = cull cow BW, Wean Wt = weaning weight, Live Wt = live BW, Feed Int = feed intake, Dev Hq = development of hind quarter, Ht With = height at withers, Len Back = length of back, Len Pelv = length of pelvis, Width at With = width at withers, Width b With = width behind withers, and Calf Qual = calf quality.
Downloaded from jas.fass.org by John Hickey on July 11, 2010.
1051
Accuracy and bias in genetic evaluations
Table 4. Mean bias across 350 replicates, expressed as a percentage of the phenotypic SD of the trait, of estimated genetic group effects for the 7 numerically most important genetic groups1 for 6 breeding goal traits Group Trait
AA
BB
CH
HE
HO
LM
SI
Carcass conformation Cull cow BW Weaning weight Live BW Feed intake Calf quality
0.78 1.20 1.59 0.85 2.44 5.70
0.00 4.38 1.26 −0.49 1.22 4.862
0.78 3.66 1.46 0.28 0.00 1.55
0.00 0.33 1.20 1.05 −3.67 −10.312
0.00 −0.48 −1.38 1.19 −1.22 1.50
0.00 −2.67 0.62 0.88 0.00 0.20
1.632 2.16 0.49 0.60 −1.22 5.85
1
AA = Aberdeen Angus, BB = Belgian Blue, CH = Charolais, HE = Hereford, HO = Holstein, LI = Limousin, and SI = Simmental. 2 Different from zero (P < 0.05).
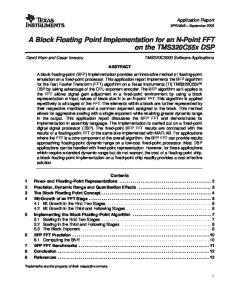
the phenotypic SD. Calf quality was an exception. It displayed much more bias than the other traits, ranging from −10.31 to 5.85% of the phenotypic SD across the different estimated genetic group effects. Large differences were observed in the accuracy of the genetic group effect for different breeds and traits (Table 5). For some traits the genetic group effects were well estimated [e.g., carcass conformation in all breeds (>0.97)], for others they were moderately estimated [e.g., weaning weight in Aberdeen Angus (0.50), cull cow BW in Charolais (0.53), feed intake in Limousin (0.46)], and for some they were poorly estimated [e.g., feed intake in Holstein (0.02), calf quality in Simmental (0.26)]. The accuracy of the genetic group effect was related to the numbers of records for that trait within that genetic group and to the numbers of records on crossbred animals with part of their ancestry within that genetic group. As the numbers of records increased, the accuracy of the genetic group effect increased. In Holsteins, carcass conformation averaged 77.53 records per sire and the accuracy of the genetic group effect was 0.99, whereas feed intake had no records for this breed and the accuracy of the genetic group effect was 0.02. However, this relationship was not directly proportional and was offset by the differing information content in the records of the different breeds (Figure 2).
Bias and Accuracy of Comparisons Among Genetic Group Effects. Small biases were observed in the estimated comparisons between the different breed groups for most traits (Table 6). When expressed as a percentage of the phenotypic SD of the traits involved, most of these were not important, and these biases were only significantly different from zero (P < 0.05) in 8 instances: comparisons for live BW between Belgian Blue and each of Aberdeen Angus, Hereford, Holstein, and Limousin and comparisons for calf quality between Hereford and each of Aberdeen Angus, Belgian Blue, Holstein, and Simmental. There was some disparity between bias in the estimates of individual genetic group effects and bias in the estimates of comparisons between genetic groups. For example, even though the estimated genetic group effect for Belgian Blue was significantly biased (4.86% of the phenotypic SD) in the case of calf quality, the comparisons between Belgian Blue and all other breeds with the exception of Hereford were not biased. Carcass conformation in the Simmental genetic group showed a similar pattern. Large differences were observed in the accuracy of estimated comparisons between different genetic group effects for different traits (Table 7). For carcass conformation (>0.97) and live BW (>0.92) the accuracy of comparison between all genetic groups was always
Table 5. Accuracy of estimated genetic group effects for the 7 numerically most important genetic groups1 for 6 breeding goal traits Group Trait
AA
BB
CH
HE
HO
LM
SI
Carcass conformation Cull cow BW Weaning weight Live BW Feed intake Calf quality
0.99 0.62 0.50 0.87 0.16 0.39
0.99 0.76 0.68 0.89 0.21 0.77
0.99 0.53 0.61 0.94 0.31 0.55
0.99 0.61 0.54 0.90 0.16 0.40
0.99 0.97 0.26 0.86 0.02 0.42
0.99 0.47 0.57 0.92 0.46 0.42
0.97 0.51 0.55 0.92 0.41 0.26
1 AA = Aberdeen Angus, BB = Belgian Blue, CH = Charolais, HE = Hereford, HO = Holstein, LI = Limousin, and SI = Simmental.
Downloaded from jas.fass.org by John Hickey on July 11, 2010.
1052
Hickey et al.
Table 6. Mean bias across 350 replicates, expressed as a percentage of the phenotypic SD of the trait, of estimated comparisons between genetic group effects for the 7 numerically most important genetic groups1 for 6 breeding goal traits Breed1
Breed
AA AA AA AA AA AA BB BB BB BB BB CH CH CH CH HE HE HE HO HO LM
BB CH HE HO LM SI CH HE HO LM SI HE HO LM SI HO LM SI LM SI SI
Carcass conformation
Cull cow BW
Weaning weight
Live BW
Feed intake
Calf quality
0.78 0.00 0.78 0.78 0.78 0.00 −0.78 0.00 −0.78 −0.78 −1.56 0.78 0.78 0.78 0.00 0.00 0.00 −0.78 0.00 −0.78 −0.78
−3.18 −2.46 0.90 1.68 3.87 −0.96 0.72 4.08 4.86 7.05 2.22 3.33 4.14 6.33 1.50 0.78 3.00 −1.83 2.19 −2.64 −4.83
0.33 0.12 0.39 2.97 0.97 1.11 −0.23 0.06 2.64 0.64 0.76 0.29 2.85 0.87 0.99 2.58 0.58 0.70 −2.00 −1.88 0.12
1.332 0.57 −0.22 −0.35 −0.03 0.23 −0.75 −1.542 −1.682 −1.372 −1.09 −0.79 −0.92 −0.62 −0.34 −0.14 0.17 0.45 0.31 0.59 0.28
1.22 2.44 4.89 3.67 2.44 2.44 1.22 4.89 2.44 1.22 2.44 3.67 1.22 0.00 1.22 −1.22 −3.67 −2.44 −1.22 −1.22 1.22
0.90 4.20 16.012 4.20 5.50 −0.10 3.30 15.162 3.30 4.65 −1.00 11.85 0.00 1.35 −4.30 −11.812 −10.50 −16.162 1.30 −4.30 −5.65
1 AA = Aberdeen Angus, BB = Belgian Blue, CH = Charolais, HE = Hereford, HO = Holstein, LI = Limousin, and SI = Simmental. 2 Different from zero (P < 0.05).
high. For weaning weight it ranged from moderately low (0.31) to moderately high (0.80). For feed intake the accuracy of the comparisons among the different genetic groups ranged from very low (0.06) to moderate (0.44). Large differences also existed in the accuracy of estimated comparisons between individual genetic groups and other genetic groups. For example, the
Figure 2. Accuracy of estimated genetic group effect compared with the number of records of offspring with sires in each of the genetic groups for 6 genetic groups (Aberdeen Angus, Belgian Blue, Charolais, Hereford, Limousin, and Simmental) and 2 traits (cull cow weight and calf quality).
accuracy of comparisons between Aberdeen Angus and other breeds for cull cow BW varied from 0.54 (comparison with Limousin) to 0.83 (comparison with Holstein).
Accuracies of EBV Within Genetic Group and Across Genetic Group. Average accuracy of EBV within genetic group and average accuracy of EBV across genetic group for sires recorded as AI sires in the ICBF database for the 7 numerically most important breeds for 6 of the breeding goal traits are given in Table 8. Average accuracy of EBV within genetic group ranged from 0.29 for calf quality in Hereford to 0.83 for carcass conformation in Holstein. Although traits with large numbers of records per sire in the different breeds tended to have greater average accuracy of EBV within genetic group, traits with few records per sire did not always have lower average accuracy of EBV within genetic group, because of the use of correlated traits in the evaluation. For example, average numbers of records per Holstein sire for weaning weight was 1.46, for live BW was 3.34, and for feed intake was zero, yet their respective average accuracy of EBV within genetic group were similar: 0.62, 0.67, and 0.65. Average accuracies of EBV across genetic group ranged from 0.20 for calf quality in Simmental to 0.93 for carcass conformation in Holstein and were dependent upon the accuracy of the estimated genetic group effect and accuracy of EBV within genetic group. The accuracy of EBV across genetic group may benefit or suffer from having high or low accuracy of the esti-
Downloaded from jas.fass.org by John Hickey on July 11, 2010.
1053
Accuracy and bias in genetic evaluations
Table 7. Accuracies of within trait breed comparisons among 7 breeds for 6 breeding goal traits Breed1
Breed
AA AA AA AA AA AA BB BB BB BB BB CH CH CH CH HE HE HE HO HO LM
BB CH HE HO LM SI CH HE HO LM SI HE HO LM SI HO LM SI LM SI SI
Carcass conformation
Cull cow BW
Weaning weight
Live BW
Feed intake
Calf quality
0.99 0.99 0.99 0.99 0.99 0.99 0.99 0.99 0.99 0.99 0.97 0.99 0.99 0.99 0.99 0.99 0.99 0.98 0.99 0.99 0.97
0.76 0.56 0.65 0.83 0.54 0.63 0.65 0.71 0.89 0.60 0.69 0.52 0.76 0.41 0.53 0.81 0.46 0.66 0.71 0.80 0.42
0.73 0.61 0.67 0.39 0.63 0.65 0.76 0.71 0.48 0.80 0.74 0.63 0.38 0.68 0.64 0.31 0.64 0.67 0.37 0.36 0.67
0.95 0.96 0.95 0.92 0.96 0.96 0.97 0.96 0.94 0.97 0.97 0.97 0.95 0.98 0.98 0.95 0.97 0.97 0.95 0.95 0.98
0.23 0.19 0.17 0.12 0.28 0.32 0.27 0.17 0.10 0.34 0.38 0.25 0.06 0.34 0.36 0.11 0.26 0.31 0.11 0.14 0.44
0.61 0.34 0.44 0.39 0.34 0.35 0.61 0.54 0.68 0.53 0.42 0.43 0.44 0.31 0.31 0.40 0.34 0.30 0.33 0.33 0.24
1 AA = Aberdeen Angus, BB = Belgian Blue, CH = Charolais, HE = Hereford, HO = Holstein, LI = Limousin, and SI = Simmental.
mated genetic group effects or from having high or low accuracy of EBV within genetic group. For example, average accuracy of EBV within genetic group for carcass conformation (0.77) and weaning weight (0.79) in Limousin have similar values, but the large differences in the values of the accuracy of the estimated genetic group effect for these traits (carcass conformation: 0.99, weaning weight: 0.57) create large differences in average accuracy of EBV across genetic group: 0.90 and 0.75.
of EBV within genetic group and of EBV across genetic group were calculated. When applied to Irish data the method helped to estimate accuracy and bias of breeding values and to identify weaknesses and strengths in the current data recording and evaluation system.
Accuracy of EBV Across Genetic Group The accuracy of EBV across genetic group of an animal was determined by the accuracy of the estimated genetic group effects of the genetic groups that constitute an animal and the animal’s accuracy of EBV within genetic group. The relative importance of these 2 components depended on the ratio of breed to genetic variance, the accuracy with which these components are estimated, and the sampling covariances among the genetic group effects and among the animal’s individual genetic effect and the genetic group effects.
DISCUSSION The quality of genetic evaluations when genetic groups are included in the relationship matrix was assessed. Accuracy and bias of estimated genetic group effects and of the comparisons among estimated genetic group effects were evaluated, and the accuracy
Table 8. Average accuracy of EBV within genetic group (rwg), and EBV across genetic group (rag) for AI sires of the 7 numerically most important breeds1 for 6 breeding goal traits AA
BB
CH
HE
HO
LM
SI
Trait
rwg
rag
rwg
rag
rwg
rag
rwg
rag
rwg
rag
rwg
rag
rwg
rag
Carcass conformation Cull cow BW Weaning weight Live BW Feed intake Calf quality
0.69 0.60 0.60 0.62 0.57 0.34
0.88 0.63 0.57 0.68 0.35 0.30
0.69 0.59 0.61 0.63 0.58 0.35
0.89 0.70 0.60 0.69 0.37 0.50
0.71 0.61 0.75 0.77 0.65 0.40
0.89 0.62 0.71 0.80 0.51 0.36
0.64 0.57 0.60 0.62 0.55 0.29
0.89 0.59 0.57 0.69 0.34 0.28
0.83 0.78 0.62 0.67 0.65 0.40
0.93 0.91 0.57 0.72 0.46 0.34
0.77 0.67 0.79 0.81 0.71 0.50
0.90 0.59 0.75 0.83 0.61 0.35
0.68 0.64 0.75 0.76 0.66 0.37
0.89 0.59 0.71 0.80 0.57 0.20
1
AA = Aberdeen Angus, BB = Belgian Blue, CH = Charolais, HE = Hereford, HO = Holstein, LI = Limousin, SI = Simmental.
Downloaded from jas.fass.org by John Hickey on July 11, 2010.
1054
Hickey et al.
Where there is poor partitioning of these effects, the sampling covariances among them may become important. The accuracy of the estimated genetic group effect and the accuracy of EBV across genetic group provide information about how well these effects are estimated for individuals. However, as selection decisions involve comparing alternatives, the accuracy of comparisons among these effects may be more important. Publishing the accuracies of every pair-wise comparison would be cumbersome under the current system, in which an active bull list of the top 75 sires for total beef merit is published in Ireland. Web-based delivery of sire breeding advice as part of customized selection indices (Garrick, 2005) would make the delivery of these accuracies feasible.
Advantages of the Methodology The quality of genetic evaluations depends on the quality of the data used in the analysis and on the quality of the model used to analyze it. The quality of models can be assessed with goodness-of-fit tests such as the R2, Akaike (Akaike, 1973), and Bayesian (Schwarz, 1978) information criterion, or based on the predictive ability of models by estimating effects on a randomly selected portion of the data and then using these estimated effects to predict records for the remaining data (e.g., Stone, 1974; Perez-Enciso et al., 1993; Olesen et al., 1994; Urioste et al., 2003). Assessing the quality of the data involved in genetic evaluations has received less attention than the assessment of the quality of models, and the methods developed do not provide complete assessment. Current methods to check data quality use basic statistics, determine the consistency of results and sire variances from consecutive evaluations, check for trends in Mendelian sampling (Klei et al., 2002), or approximate the accuracy of individual EBV within genetic group (e.g., Tier and Meyer, 2004). These generate summary statistics that are difficult to interpret, or give incomplete assessment, or fail to account for all of the issues known to affect data quality. Data mining techniques are being developed to assess data quality in genetic evaluations (Banos et al., 2003), but although these promise undoubtedly powerful insights, they require specialist training. The sampling method used in this study assesses the data quality in genetic evaluations using statistical parameters and techniques with which practitioners of animal breeding are familiar. It takes full account of issues influencing data quality, such as effective numbers of direct and correlated records contributing to an animal’s EBV, any number of fixed effects each with any number of levels, missing records, and connectedness among animals and sub-populations. In addition, the sampling method can be used to assess a breeding program in terms of its potential to provide genetic improvement. Deterministic methods
can be used to predict the genetic gain within a breeding program (Wray and Hill, 1989) and these have been expanded to situations involving crossbred as well as purebred data (e.g., Bijma and van Arendonk, 1998). However, deterministic methods have some drawbacks. The sampling approach used in this study can take full account of the structure existing in the data to determine the accuracy of EBV. The accuracy of EBV are proportional to the potential of response to selection (Falconer and Mackay, 1996). In a breeding program involving multiple genetic groups, response to selection is affected by both the accuracy of EBV within genetic group and the accuracy of EBV across genetic groups. Although the accuracy of EBV within genetic group may be acceptable (e.g., for feed intake in Holstein due to correlated information) and genetic gain can be made within a breed, the accuracy of the estimated genetic group effect, and, consequently, the accuracy of EBV across genetic groups may not be acceptable and efficiency of across breed selection would be reduced. The sampling method allows alternative data recording scenarios to be tested. Phenotypic records could be simulated for animals in the pedigree that do not have phenotypes in the real data to determine the effect that recording this information would have on the accuracy and bias of the estimated effects before embarking on potentially expensive data recording. By looking at areas of strength and weakness for the different traits, suggestions could be made about where the priorities lie for efforts to increase or decrease the effective numbers of records. The sampling method calculates accuracy and bias assuming that the true genetic model is used in the evaluations. This is obviously a simplification of the real genetic model and parameters are only estimated. For example, in the Irish model no account is taken of heterogeneity of variances in the different genetic groups or of effects of nonadditive genetic variance. Modeling of these effects is difficult because of the number of parameters to be estimated and the quality of the data needed for these estimations (e.g., Lutaaya et al., 2002; Legarra et al., 2007). In addition, because the method is based on BLUP, it does not account for possible biases due to unrecorded selection or unrecorded preferential treatment of animals. The true accuracy and bias of genetic evaluations might therefore be somewhat different from their calculated accuracy. The computing required for this analysis was extensive, especially for the calculation of accuracies for routine genetic evaluations. However, several steps can be taken to reduce the computing time required and therefore allow routine application. Using more modern breeding value estimation software could reduce the overall time requirements. Using MiX99 (Lidauer et al., 2006) compiled for a 64-bit PC, the mixed model equations for each replicate could have been solved in 366 min instead of the 462 min required with PEST. To use this method to routinely assess the
Downloaded from jas.fass.org by John Hickey on July 11, 2010.
Accuracy and bias in genetic evaluations
quality of genetic evaluations with genetic groups in the relationship matrix, the seed number used in the simulation and the solutions of the mixed model equations could be stored for each replicate. Then, for the subsequent genetic evaluation, one could update the files of simulated values with values simulated for new records included since the previous genetic evaluation and use the solutions of the matching replicate from the previous genetic evaluation as starting values for solving the mixed model equations. This study used 350 replicates to calculate accuracy and bias of estimated effects. Using fewer replicates would have reduced the computing time. For animals with a true accuracy of 0.50, reducing the number of replicates from 350 to 200 would have only increased the 95% confidence interval of their accuracy from 0.07 to 0.10 (Figure 1).
Bias and Accuracy of Estimated Effects in the Irish Beef Cattle Population The Irish multiple-breed beef cattle data set is extremely unbalanced. Certain breeds are only mated with certain others, purebred data are unavailable for certain breeds, and the amount of data recorded on the different traits differs within breeds. In spite of such imbalances the genetic evaluation model applied to the Irish multiple-breed beef cattle population allows the estimation of breed effects and comparisons among breed effects without serious systematic bias. The large differences in accuracy of the estimated genetic group effects and in the accuracy of the comparisons among the genetic group effects reflect large differences in the quality and quantity of the information used to estimate these effects and comparisons. From the results it is clear that some feed intake records on Holstein animals are required to get a reasonable estimate of the breed effect. The EBV within breed are reasonably accurate due to correlated information; hence, there is no need for continuous recording of Holstein animals for feed intake. For the beef breeds the focus should be on increasing the effective numbers of records to improve the accuracy of estimated genetic group effects and consequently the accuracy of EBV across Limousin, Simmental, and Charolais breeds for cull cow BW, and Aberdeen Angus and Hereford for weaning weight. The calf quality trait exhibited more bias than feed intake even though calf quality tended to have more records per sire in the different breeds. Feed intake was recorded on animals that were selected for performance testing based on their EBV for other traits. At the same time, performance testing was done by comparing animals from different breeds under equal circumstances. Calf quality was recorded on commercial animals sold for export. Although these were likely to be superior commercial animals, they were not selected on the basis of the other traits recorded. Therefore, better correction was likely for se-
1055
lective recording of feed intake compared with calf quality. In conclusion, a method was developed to assess the quality of genetic evaluations in which animals from different genetic groups are compared, in terms of accuracy and bias of estimated effects and of comparisons among effects. Accuracy of EBV within genetic group and EBV across genetic group was very different in some instances, with the differences due to the accuracies of the estimated genetic group effects. Further theoretical work is required to quantify the effect of the ratio of breed group variance to genetic variance on the relative importance of the different components contributing to the accuracy of EBV across genetic group and to quantify the effect of sampling covariances among these components. This method can be used to calculate accuracy of multiple-breed EBV.
LITERATURE CITED Akaike, H. 1973. Information theory and an extension of the maximum likelihood principle. Pages 267–281 in 2nd Int. Symp. Inf. Theory, Budapest, Hungary. Akademiai, Budapest, Hungary. Banos, G., P. A. Mitkas, Z. Abas, A. L. Symeonidis, G. Milis, and U. Emanuelson. 2003. Quality control of national genetic evaluation results using data mining techniques: A progress report. Interbull Bull. 31:8–15. Bijma, P., and J. A. M. van Arendonk. 1998. Maximizing genetic gain for the sire line of a crossbreeding scheme utilizing both purebred and crossbred information. Anim. Sci. 66:529–542. Falconer, D. S., and T. F. C. Mackay. 1996. Introduction to Quantitative Genetics. 4th ed. Longman, New York, NY. Fouilloux, M. N., and D. Laloe. 2001. A sampling method for estimating the accuracy of predicted breeding values in genetic evaluation. Genet. Sel. Evol. 33:473–486. Garcia-Cortes, L. A., C. Moreno, L. Varona, and J. Altarriba. 1995. Estimation of prediction error variances by resampling. J. Anim. Breed. Genet. 112:176–182. Garrick, D. J. 2005. Making the Web Equal Profit: Surfing for Genetics. Pages 105–111 in Proc. 37th Annu. Mtg. Beef Improvement Federation, Billings, MT. Groeneveld, E. 1990. PEST User’s Manual. University of Illinois, Urbana. Klei, L., T. Mark, F. Fikse, and T. Lawlor. 2002. A method for verifying genetic evaluation results. Interbull Bull. 29:178–182. Legarra, A., J. K. Bertrand, T. Strabel, R. L. Sapp, J. P. Sanchez, and I. Misztal. 2007. Multi-breed genetic evaluation in a Gelbvieh population. J. Anim. Breed. Genet. 124:286–295. Lidauer, M., I. Stranden, K. Vuori, and E. Mantysaari. 2006. Mix99 User Manual. MTT, Jokioinen, Finland. Lutaaya, E., I. Misztal, J. W. Mabry, T. Short, H. H. Timm, and R. Holzbauer. 2002. Joint evaluation of purebreds and crossbreds in swine. J. Anim. Sci. 80:2263–2266. Olesen, I., M. Pe´rez-Enciso, D. Gianola, and D. L. Thomas. 1994. A comparison of normal and nonnormal mixed models for number of lambs born in Norwegian sheep. J. Anim. Sci. 72:1166–1173. Perez-Enciso, M., R. J. Tempelman, and D. Gianola. 1993. A comparison between linear and Poisson mixed models for litter size in Iberian pigs. Livest. Prod. Sci. 35:303–316. Phocas, F., and D. Laloe. 2004. Should genetic groups be fitted in BLUP evaluation? Practical answer for the French Al beef sire evaluation. Genet. Sel. Evol. 36:325–345. Reverter, A., B. L. Golden, R. M. Bourdon, and J. S. Brinks. 1994. Technical note: Detection of bias in genetic predictions. J. Anim. Sci. 72:34–37. Schaeffer, L. R. 1994. Multiple-country comparisons of dairy sires. J. Dairy Sci. 77:2671–2678.
Downloaded from jas.fass.org by John Hickey on July 11, 2010.
1056
Hickey et al.
Schwarz, G. 1978. Estimating the dimension of a model. Ann. Statist. 6:461–464. Stone, M. 1974. Cross-validatory choice and assessment of statistical predictions. J. R. Stat. Soc. Ser. B. Method. 36:111–147. Sullivan, P. G., J. W. Wilton, S. P. Miller, and L. R. Banks. 1999. Genetic trends and breed overlap derived from multiple-breed genetic evaluations of beef cattle for growth traits. J. Anim. Sci. 77:2019–2027. Tier, B., and K. Meyer. 2004. Approximating prediction error covariances in multiple-trait and random regression models. J. Anim. Breed. Genet. 121:77–89.
Urioste, J. I., R. Rekaya, D. Gianola, W. F. Fikse, and K. A. Weigel. 2003. Model comparison for genetic evaluation of milk yield in Uruguayan Holsteins. Livest. Prod. Sci. 84:63–73. Van Vleck, L. D., A. F. Hakim, L. V. Cundiff, R. M. Koch, J. D. Crouse, and K. G. Boldman. 1992. Estimated breeding values for meat characteristics of crossbred cattle with an animal model. J. Anim. Sci. 70:363–371. Westell, R. A., R. L. Quaas, and L. D. Van Vleck. 1988. Genetic groups in an animal model. J. Dairy Sci. 71:1310–1318. Wray, N., and W. G. Hill. 1989. Asymptotic rates of response from index selection. Anim. Prod. 49:217–227.
Downloaded from jas.fass.org by John Hickey on July 11, 2010.
References
This article cites 20 articles, 7 of which you can access for free at: http://jas.fass.org/cgi/content/full/86/5/1047#BIBL
Downloaded from jas.fass.org by John Hickey on July 11, 2010.