COPYRIGHT 2011, MICHAEL G. FOSTER SCHOOL OF BUSINESS, UNIVERSITY OF WASHINGTON, SEATTLE, WA 98195
doi:10.1017/S0022109011000159
Estimating the Effects of Large Shareholders Using a Geographic Instrument Bo Becker, Henrik Cronqvist, and Rudiger ¨ Fahlenbrach ∗
Abstract Large shareholders may play an important role for firm performance and policies, but identifying this empirically presents a challenge due to the endogeneity of ownership structures. We develop and test an empirical framework that allows us to separate selection from treatment effects of large shareholders. Individual blockholders tend to hold blocks in public firms located close to where they reside. Using this empirical observation, we develop an instrument (the density of wealthy individuals near a firm’s headquarters) for the presence of large, nonmanagerial individual shareholders in firms. These shareholders have a large impact on firms, controlling for selection effects.
I.
Introduction
A public firm’s shareholders have extensive legal control rights in the corporation, but in practice much of this control is delegated to managers. In companies with small, dispersed shareholders, owners may find it costly to coordinate and
∗ Becker, [email protected], Harvard Business School, Soldiers Field, Boston, MA 02163, and NBER; Cronqvist, [email protected], Claremont McKenna College, Robert Day School of Economics and Finance, 500 E. 9th St., Claremont, CA 91711; and Fahlenbrach, ruediger.fahlenbrach@ ´ epfl.ch, Ecole Polytechnique F´ed´erale de Lausanne (EPFL), Quartier UNIL-Dorigny, Extranef 211, 1015 Lausanne, Switzerland, and Swiss Finance Institute. We have benefited from comments by Ulf Axelson, Malcolm Baker, Hendrik Bessembinder (the editor), Sanjai Bhagat, Peter Bossaerts, Murillo Campello, Shawn Cole, Jeffrey Coles (associate editor and referee), Harry DeAngelo, Mara Faccio, Cliff Holderness, Eric Hughson, Wei Jiang, Andrew Karolyi, Chris Leach, Florencio L´opezde-Silanes, Tim Loughran, Ernst Maug, Felix Meschke, Lisa Meulbroek, Bernadette Minton, Erwan Morellec, Ramana Nanda, Josh Pollet, Michael Roberts, Antoinette Schoar, Jagadeesh Sivadasan, Laura Starks, Phil Strahan, G¨unter Strobl, Per Str¨omberg, Ren´e Stulz, Elu von Thadden, Belen Villalonga, Michael Weisbach, Karen Wruck, Jaime Zender, and seminar and conference participants at Boston College, Claremont McKenna College, 2nd Annual Corporate Governance Conference at Drexel University, EPFL, European Summer Symposium in Financial Markets in Gerzensee, European Finance Association, Harvard University, INSEAD, 6th Annual Napa Conference on Financial Markets Research, Ohio State University, Swedish Institute for Financial Research, University of Alberta, University of Amsterdam, University of Colorado at Boulder, University of Illinois at UrbanaChampaign, Universit¨at Mannheim, and Vanderbilt University. Alexander Bonnett, Hannah Gregg, Alan Illing, Peter Wong, and Scott Yonker provided excellent research assistance. Fahlenbrach gratefully acknowledges financial support from the Dice Center for Research in Financial Economics and the Swiss Finance Institute.
907
908
Journal of Financial and Quantitative Analysis
exercise monitoring and control, leaving management with considerable discretion. The resulting agency problems between owners and managers may be severe (e.g., Berle and Means (1932), Jensen and Meckling (1976)).1 By concentrating a block of shares in the hands of a single decision maker, large shareholders may play a beneficial role in remedying these agency problems and facilitating effective owner control (e.g., Grossman and Hart (1980), Shleifer and Vishny (1986)). A large shareholder may restrain managers from extracting rents and thereby improve firm performance, benefiting all shareholders. Other theories predict that a block in a firm may be costly. Large shareholders may, for example, reduce the liquidity of a firm’s shares (because they make asymmetric information problems more severe) or influence firm policies in some way that is not in the interest of small shareholders (e.g., favoring tax-inefficient forms of cash distribution). Testing these theories regarding the effects of large owners is challenging. Researchers in corporate finance have recognized for more than 20 years (at least since Demsetz and Lehn (1985)) the difficulty of causal inference in studies of ownership and performance. Suppose, for example, that blockholders systematically target firms with poor performance because of the potential performance increases due to improved monitoring, or that they select more liquid stocks because of the relatively lower cost of creating a block. Suppose also, as predicted by theory, that conditional on such selection, blockholder monitoring improves operating profitability and reduces the liquidity of the firm’s shares. If this is the case, then ordinary least squares (OLS) regressions of performance or stock liquidity on block presence in a firm confound selection effects and treatment effects of block ownership. In this paper, we develop and test a new instrumental variable (IV) framework that allows us to separate these effects for a large group of blockholders. This allows us to quantify the impact of large owners on several key aspects of firm behavior. Our analysis focuses on individual nonmanagerial blockholders and excludes blocks held by mutual funds and other institutions. This is motivated by the limitations of our identification strategy (i.e., what our instrument predicts) but is also appealing when testing predictions from theories of large shareholders. Nonmanagement individuals who hold a large block of shares in a firm seem to fit naturally with the notion of having a principal present in the firm because they are generally less constrained than institutional investors from being active monitors of management. They do not face the regulatory constraints of many mutual funds and pension funds (e.g., Black (1990), Roe (1990)), they are not afraid of losing money management business (e.g., Brickley, Lease, and Smith (1988), Davis and Kim (2007)), and they come with fewer agency problems of their own (e.g., Diamond (1984)).2 Managers who are also blockholders have interests that may
1 There is a large literature on manager-shareholder conflicts. Demsetz (1983) argues that a manager may extract nonpecuniary benefits to the detriment of shareholders. Jensen (1986), (1989) argues that managers expropriate small, dispersed shareholders by diverting corporate resources for empire building or perk consumption. 2 While institutions are not generally active owners, some institutions are more active than others. There is evidence from the 1980s and early 1990s that some public pension funds, for example, the California Public Employees’ Retirement System (CalPERS), were active in corporate governance (e.g., Smith (1996), Del Guercio and Hawkins (1999)). Also, Brav, Jiang, Partnoy, and Thomas (2008)
Becker, Cronqvist, and Fahlenbrach
909
differ dramatically from those of other owners (see, e.g., Barclay and Holderness (1989)). Thus, nonmanagement individual blockholders appear to fit well with theories of outside monitors. Our instrument for the presence of a large shareholder in a firm is the number of high net worth individuals in the state where a firm is headquartered divided by the number of public firms headquartered in the state, which we refer to as wealth density.3 This variable is a valid instrument for the presence of blocks in local firms if it is correlated with the frequency of such blocks (relevancy condition) but affects the dependent variables only through its effect on block ownership (exclusion restriction). Our instrument reflects economic forces that are important for the presence of a block in a firm. The relevancy condition is easiest to evaluate. First, blockholders exhibit a preference for firms headquartered near where they live, presumably because of lower monitoring costs or asymmetric information.4 The median distance between a nonmanagerial individual blockholder and the firm in which they have a block is 28.5 miles. Second, personal wealth is likely a determinant of an individual’s ability to invest a large stake in a public firm. Finally, there is significant cross-state variation in the wealth density instrument, possibly reflecting exogenously attractive areas or the fact that wealthy people prefer to live near other wealthy individuals because of social reasons or similar tastes (e.g., Glaeser (1998)). We find that our instrument predicts the presence of a block in a firm with considerable power. The economic magnitude of the estimated effect is large: Moving from the 25th to the 75th percentile of wealth density increases the predicted probability of a block in a local firm from 8.7% to 12.8% (i.e., it increases the probability by about 50%). While there is no statistical test of the validity of the exclusion restriction in the presence of a single instrument, we provide several empirical observations and arguments to support its validity. First, our instrument comes from inheritance data, that is, deceased wealthy individuals, so it reflects “old money,” limiting the impact of local wealth-creating events such as initial public offerings of local firms, which may directly affect current firm performance and policies. Second, if wealth density was correlated with firm-specific variables measuring the demand for a block in a firm, we would also expect it to predict the presence of blocks other than nonmanagerial individual blocks. We find that wealth density does not predict the presence of blocks by managers or institutional investors. We return to a more detailed discussion of the validity of our instrument in Section IV.D. Our empirical evidence is consistent with theories of large shareholders as monitors of management. We find that blocks are not randomly allocated to firms, but large shareholders systematically target firms based on where the benefits from additional monitoring are expected to be more significant (e.g., smaller and relatively poorly performing firms). Controlling for such block selection, we find that the presence of a large shareholder significantly reduces a firm’s investments, and Clifford (2008) compare firms before and after an activist hedge fund accumulates a stake and find significant changes in performance and firm policies. 3 To the best of our knowledge, no database available reliably captures U.S. wealth distribution on a scale finer than state level (e.g., metropolitan statistical areas (MSAs)). 4 See Lerner (1995) for evidence on local bias among venture capitalists, Coval and Moskowitz (1999), (2001) for mutual funds, and Bailey, Kumar, and Ng (2008) for retail investors.
910
Journal of Financial and Quantitative Analysis
reduces corporate cash holdings, increases payouts to shareholders, reduces total top-executive pay, and increases firm performance. Firms with blockholders also have significantly more outside directors on their boards. In addition to monitoring benefits, we also find that block presence comes with some costs. One such cost is less liquid publicly traded shares. This may reflect a smaller float as well as the presence of privately informed traders (i.e., the blockholders). Our paper contributes to existing research on large shareholders’ impact on firms by explicitly addressing the endogeneity of the ownership structure. In his survey, Holderness (2003) emphasizes endogeneity problems in analyzing block ownership and concludes that “[s]urprisingly few major corporate decisions have been shown to be different in the presence of a blockholder” (p. 60). Controlling for selection effects dramatically changes our inference about block impact on firm behavior. We show that large shareholders indeed play a large role for corporate governance in large public U.S. firms and can have large effects on several firm policies. For example, large shareholders target firms with poor performance, but conditional on doing so, they improve performance, consistent with monitoring theories of blockholders. In addition to effects on performance, we test for a large shareholder’s impact on corporate policies, many of which have not been previously analyzed, and we find evidence consistent with blockholder monitoring causing changes in these policies. On the other hand, capital structure does not appear much affected by large shareholders. In general, our findings are consistent with the interpretation that firms in areas with a relatively low supply of potential blockholders display the characteristics of firms with more severe agency problems between owners and managers. There are no clear policy implications of our findings. First, because large shareholders and small shareholders do not necessarily have coinciding preferences about firm policy, changes that benefit one may not benefit the other. Encouraging block formation may not be beneficial on net. Second, our results are limited to noninstitutional outsiders, which are scarce and difficult to produce. Blocks held by mutual funds and other institutions (which can more easily be grown) may have a very different impact on firms. Finally, the potential impact of a blockholder is likely different across different individuals and firms. The firms where we observe blockholders are likely to be those where the potential benefits are the largest. The second contribution of our paper is to show that the local supply of potential blockholders (i.e., the local supply of one potentially important governance mechanism) in the area where a firm is headquartered may have significant effects on firm behavior, that is, that geography matters for the ownership structure of firms (see Coval and Moskowitz (1999) for related patterns for institutional stock ownership). We use these patterns to empirically model the supply side of large shareholders. This allows us to examine whether ownership structure influences firms’ behavior, controlling for selection effects. The economics of the supply of blocks is largely unexplored in the governance literature, perhaps because the focus has mainly been on partial equilibrium analysis and results (see, however, Gorton and Kahl (2008) for a recent exception). Our paper also relates to work in corporate governance that attempts to address endogeneity problems. Coles, Lemmon, and Wang (2008) and Coles,
Becker, Cronqvist, and Fahlenbrach
911
Lemmon, and Meschke (2011) develop structural models of finance and governance, which on theory can allow econometricians to estimate underlying parameters. Several papers in this area use natural experiments generated by legal changes, including Bertrand and Mullainathan (2003) (changes in antitakeover laws) and P´erez-Gonz´alez (2005) (the abolition of foreign majority ownership regulations in Mexico). Several papers use the passage of the Sarbanes-Oxley Act as an exogenous change (e.g., Chhaochharia and Grinstein (2007), Hochberg, Sapienza, and Vissing-Jorgensen (2009)). See also Hochberg and Lindsey (2010), who use a labor-based instrument in a corporate finance context, and Kedia and Rajgopal (2009), who find that option grants vary geographically. In contrast to these papers, we develop an IV for the incidence of large, private shareholders in a firm. The paper is organized as follows. Section II reviews the role of large shareholders in the governance of public corporations. Section III describes our data. Section IV defines the instrument, describes the econometric model that we use to identify and quantify the impact of blocks on firms, and examines the validity of the instrument. Section V analyzes the impact of large shareholders on firm performance and corporate policies using our 2-stage selection model. Section VI concludes.
II.
Large Shareholders and Corporate Governance
A.
Monitoring and the Effects of Large Shareholders
Theory suggests that large shareholder monitoring may have a significant impact on several aspects of firm behavior, including a firm’s operating profitability, corporate investment policy, and choice of financial and executive compensation policies. In this section we review theories of large shareholders and discuss the empirical predictions that we test in the remainder of the paper. Theories regarding beneficial effects of large shareholders typically start by positing agency problems between owners and managers and by assuming that large owners are able to reduce these. Due to the size of their stake, they either have better incentives to monitor or more power to influence decisions than small, dispersed owners.5 Large shareholders use their influence over firm behavior in several ways. They may affect operating decisions by monitoring management. This can result in improved project selection and investment levels, and possibly reduced waste. Demsetz and Lehn (1985) argue that blockholder monitoring restrains managers from consuming firm resources, thereby improving performance. Also, the presence of a block may mitigate overinvestment by management and improve the investment efficiency of the targeted firm (Jensen (1986)). To test these predictions empirically, we examine the impact of large shareholders on measures of operating performance (e.g., return on assets (ROA)), costs (e.g., selling, general, and administrative (SG&A) expenses), and investment behavior. 5 Some recent theories argue that large shareholders can exert governance even if they do not intervene in a firm’s operations (e.g., Admati and Pfleiderer (2009), Edmans (2009)).
912
Journal of Financial and Quantitative Analysis
Blockholders may also affect firms’ financial policies. Again, the starting point of the argument is that managers may want to deviate from optimal capital structures (i.e., optimal in the view of owners). Managers may prefer lower leverage to reduce firm risk and protect their underdiversified human capital (e.g., Fama (1980)). Alternatively, managers may prefer to increase leverage in order to inflate the voting power of their equity stakes (see Harris and Raviv (1988), Stulz (1988)). In either case, there is a role for large shareholder monitoring related to capital structure decisions. In terms of payout policy and cash holdings, managers may prefer lower payouts, as payouts reduce the amount of resources under management’s control and subject managers to capital markets discipline when the firm requires external financing (e.g., Easterbrook (1984), Jensen (1986)). Monitoring by a large shareholder may restrict managers from reducing payouts or holding too much cash. Chief executive officer (CEO) pay is perhaps the most obvious potential source of conflict between management and owners. Whether CEOs are paid excessively and set their own pay is a question that has been subject to considerable debate and academic research (see, e.g., Bebchuk and Fried (2004) for a review of this work). Because large shareholders may restrain rent extraction by a firm’s CEO, we examine whether the presence of a block reduces CEO pay.
B.
The Costs of Large Shareholders
There are several potential costs of having a large owner. For example, monitoring may reduce managerial initiative (e.g., Burkart, Gromb, and Panunzi (1997)). Even when the presence of a block is ex post efficient, in the sense that the owner will improve investment decisions, the possibility of future intervention may reduce a manager’s ex ante incentive to exert effort and to search for value-increasing investment opportunities (in the Burkart et al. model, this happens because the manager will sometimes be overruled by active owners, reducing his utility). The net effect of concentrated ownership, that is, the benefits of monitoring versus the cost of reduced managerial incentives, is indeterminate. In the model, the net effect depends on the size of the monitoring shareholder’s stake. This theory thus predicts that the impact of blockholders on firm financial performance is ambiguous. Another potential cost of large shareholders is reduced liquidity in a firm’s publicly traded shares. Glosten and Milgrom (1985) suggest that one cause of stock market illiquidity is the presence of privately informed traders. One such group of potentially informed traders is blockholders (especially in our sample, which precedes Regulation Fair Disclosure (FD)). Holmstrom and Tirole (1993) model how concentrated ownership reduces incentives for information production in the stock market by reducing liquidity. Bhide (1993) argues that large shareholders who reduce agency problems by monitoring management may also reduce stock liquidity by increasing informational asymmetries. Based on these theoretical predictions, we test whether blocks have an effect on the liquidity of a firm’s shares using measures of stock liquidity (e.g., Amihud’s (2002) illiquidity measure).
Becker, Cronqvist, and Fahlenbrach
913
Other theories argue that blockholder-liquidity causality might go in the opposite direction of the previous arguments. For example, Kahn and Winton (1998) model the choice to exit or monitor/intervene to improve firm performance and predict that intervention is less likely when the firm’s stock is more liquid because of the lower cost of exit. Maug (1998) argues that liquidity may reduce the cost of creating a block because it makes it less costly to purchase more shares, so we would expect more blocks in firms with more liquid stocks. Our IV approach will allow us to test and isolate the causal effect of blocks on liquidity without selection effects confounding the estimates. Several theories explicitly consider the trade-offs that result from the simultaneous benefits and costs of large shareholders. For example, Bolton and von Thadden (1998) argue that large shareholders reduce the threat of takeovers.
III. A.
Data Data on Large Shareholders
We analyze an unbalanced panel of large publicly traded U.S. corporations from 1996 to 2001. The sample consists of nondual-class Standard & Poor’s (S&P) 1500 firms and was originally compiled by Dlugosz, Fahlenbrach, Gompers, and Metrick (DFGM) (2006), who identify a firm’s 5% blockholders, if any.6 The raw database contains 1,919 different firms, 18,818 blockholder-firmyear observations, and approximately 7,600 firm-year observations.7 We exclude financial firms and utilities, which reduces the sample to approximately 6,000 firm-year observations. Firms are included in our sample whether or not they have any large shareholders. We define a large shareholder as a nonmanagerial individual blockholder if it meets both of the following criteria: First, an individual has the sole voting power of the block. Second, this individual is neither a current nor a former officer of the firm (e.g., we exclude Bill Gates’s block in Microsoft). We identify current and former officers through proxy statements and a Dow Jones Interactive news search. We exclude holdings by current and former officers’ spouses or trusts (e.g., the Bill and Melinda Gates Trust). We exclude blocks held by 2ndgeneration family members only if a family member is an officer (e.g., the block by the Hewlett and Packard families is included, as the family has nonexecutive directorships but none of the family members are officers of Hewlett-Packard). Our data set contains 715 firm-year observations with at least 1 nonmanagerial individual blockholder. 6 Available from Wharton Research Data Services (http://wrds.wharton.upenn.edu). The use of annual data may underestimate the true number of large shareholders because some blockholders can enter and exit our panel within a year, thus not showing up in firms’ proxy statements. If some large shareholders choose to own a stake below the 5% reporting threshold, they also do not show up in the proxy statements and in the DFGM (2006) database. 7 The database has 20,975 blockholder entries. However, not all of these entries are 5% blockholders. For example, “Karen Smith” and “Peter Smith” are recorded in the raw data, but they jointly hold shares through the “Smith Family Trust.” Conditioning on the final blockholder flag in the DFGM (2006) database will eliminate Karen Smith and Peter Smith and retain only the Smith Family Trust.
914
B.
Journal of Financial and Quantitative Analysis
The Location of Large Shareholders
We obtain data on the geographic location (zip code) of each block in our sample from firms’ proxy statements. We exclude blocks located abroad. For some individuals who are officers or directors, the proxy statements do not give an address, but state “same address as company.” We thus underestimate the actual distance between the location of some individuals and firm headquarters. Also, when individuals have multiple residences, we use the one reported in the proxy. We obtain zip codes of firm headquarters from the ExecuComp database, the Compact Disclosure discs, or hand-collect them from proxy statements. Finally, we identify the latitude and longitude of each blockholder and firm by matching the zip codes to data from the U.S. Census Bureau’s Gazetteer Place and Zip Code Database. We compute the distance (in miles) from a blockholder to each of its firms’ headquarters using the methodology of Coval and Moskowitz (1999). Table 1 reports a mean distance of 385.4 miles and a small median distance of 28.5 miles for nonmanagerial individual blockholders. More than half (61%) are located in the same state as the firm in which they hold a block. Not surprisingly, the median distance between blockholder residence and firm headquarters for managerial blocks is 0, and more than 90% of all managerial large shareholders are located in the same state as the corporate headquarters. The results are significantly different for institutional investors. The median distance between mutual fund (money manager) headquarters and the headquarters of the firms in which they own large stakes is 1,121 miles (871 miles). Less than 10% of all mutual fund and money manager headquarters are located in the same state as the corporate headquarters of their block investments. TABLE 1 Distance between Large Shareholders’ Residence and Firms’ Headquarters Table 1 gives summary statistics for the distance in miles between the location of a blockholder and the headquarters of the firm in which the block is held for 4 different types of large shareholders. The 4 types of blockholders are nonmanagerial individuals, managers (both current and former), mutual funds, and money managers. The summary statistics are based on firm-year observations. If a firm has multiple blockholders of the same category in a given year, the distance in miles is calculated as the average distance between firm headquarters and the locations of the blockholders. Firm-years are only included in the summary statistics if there is at least 1 blockholder of the respective category. The sample is approximately 6,000 firm-year observations of nondual-class S&P 1500 firms during the period 1996–2001, excluding financial firms and utilities. Blockholders are entities that own at least 5% of the outstanding shares. The blockholder zip codes are handcollected from proxy statements. The firms’ zip codes come from the ExecuComp database, the Compact Disclosure discs, or are hand-collected from proxy statements. The distances are calculated for U.S.-based (excluding Alaska and Hawaii) blockholders only, using latitude and longitude data from the U.S. Census Bureau’s Gazetteer Place and Zip Code Database. The indicator variable “Same State” is equal to 1 if the blockholder and firm headquarters are located in the same state, and 0 otherwise. Distance in Miles Type of Blockholder
Our data for the geographic distribution of high net worth individuals are from the Statistics of Income (SOI) program at the Internal Revenue Service
Becker, Cronqvist, and Fahlenbrach
915
(IRS).8 It reports the number of high net worth individuals in each state, estimated from estate tax return filings. SOI reports estimates of the number of high net worth individuals by state in 1995, 1998, and 2001 as well as their estimated average wealth. The definition of high net worth varies somewhat from year to year. In 1995, it is the net wealth of $0.6 million to $10 million (in terms of counting the total number of high net worth individuals, the upper cutoff makes a minor difference). In 1998 and 2001, the lower limit is $1 million and there is no upper limit. However, the 3 cross sections are very similar. We use 1995 data because they predate the block observations in our sample, but we have also used 1995 data for 1996–1998 and 1998 data for 1999–2001, as well as 1998 data for all years, with very small differences in results. We also collect several control variables that vary at the state level. We obtain education, population, and income data from the Census Bureau. We collect corporate income tax rates for 2000 (we have used other years as well) from various sources. When there are multiple brackets we use the rates applying to the highest income levels. D.
Firm Variables
The theories of large shareholders discussed in Section II predict that large shareholders can affect a broad set of corporate decisions: Operating Performance. We analyze ROA and return on sales (ROS). We also analyze cost-cutting policy (scaled SG&A expenses) and investments (scaled capital expenditures). Capital Structure. We analyze measures of book and market leverage. Resources and Payout Policy. We analyze total payout as a fraction of earnings before interest, taxes, depreciation, and amortization (EBITDA) and cash holdings. Managerial Compensation and Board Structure. We analyze the log of total CEO pay and the fraction of pay in equity. We also analyze the number of outside directors on the board. Liquidity. We analyze trading volume and the illiquidity measure of Amihud (2002). Our data source for annual accounting variables is Compustat. We exclude observations with explanatory variables in the top and bottom 1%, but we have also used winsorizing at the 1% level with very small differences in results. Our data sources for CEO compensation and board structure are the ExecuComp database and the Investor Responsibility Research Center (IRRC) director database, respectively. The data used to calculate the liquidity measures come from the Center for Research in Security Prices (CRSP). All variables are defined in Appendix A. Table 2 reports summary statistics. Panel A shows that there exists at least 1 nonmanagerial individual block in 11.8% of all firm-year observations. A manager 8 For
details, see IRS, SOI Bulletin, Winter 2002–2003, Publication 1136 (Rev. 4-2003).
916
Journal of Financial and Quantitative Analysis
(either current or former) holds a block in 21.9% of all firm-year observations. More than 2/3 of all sample observations have at least 1 large mutual fund shareholder. Panel B reports means, medians, and standard deviations for the variables we use in Section V.9 TABLE 2 Summary Statistics Table 2 presents sample summary statistics. Panel A gives the number of observations and frequency for 4 types of blockholders: Nonmanagerial individuals, managers (both current and former), mutual funds, and money managers. Panel B gives mean, median, and standard deviation (SD) for all other variables. The sample size ( N) changes across variables, because of data availability and because outliers are excluded from regressions. All variables are defined in Appendix A. The sample is nondual-class S&P 1500 firms during the period 1996–2001. Panel A. Blockholders Type of Blockholder Nonmanagerial individuals Management Mutual funds Money managers Panel B. Regression Variables
N
Frequency
5,984 5,984 5,984 5,984
0.118 0.219 0.677 0.305
Variables
N
Mean
Median
SD
Firm age ROA ROS SG&A Investment Leverage, BV Leverage, long-term only, BV Leverage, MV Total payout ratio Cash holdings Number of outsiders on board CEO pay (log) CEO incentive pay Trading volume Annualized stock return Volatility Illiquidity
Instrument and Empirical Methodology The Instrumental Variable
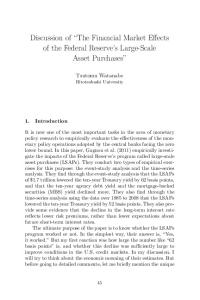
We define our instrument, the density of high net worth individuals, as the number of high net worth individuals in 1995 divided by the total number of firms headquartered in a state, using the 1995 SOI data and information on firm headquarters from the Compustat database. Throughout the analysis, we normalize the measure so that it is measured in units of thousands of individuals per firm headquarters. The significant geographic variation in the density of high net worth individuals is illustrated in Figure 1. States with a large number of high net worth individuals (e.g., California) will not necessarily have the highest density measure 9 The number of blockholders in Table B1 does not correspond to those in Table 1, because Table 1 is the raw database and allows for more than 1 large shareholder per firm-year.
Becker, Cronqvist, and Fahlenbrach
917
when a large number of firms are also headquartered in that state. Across states, the median wealth density is 565 (Oklahoma), and the mean is 664. Of the top 5 states in terms of number of headquarters, California has a density of 442, Texas 299, New York 473, Florida 603, and Massachusetts 270. Across sample firms, the mean density is 460 individuals per firm and the standard deviation is 151. FIGURE 1 Geographic Distribution of High Net Worth Individuals Figure 1 shows estimates of the number of high net worth individuals per Compustat firm headquarters for each U.S. state. The wealth data are from the Internal Revenue Service’s Statistics of Income (SOI) data, which report the estimated number of individuals with a high net worth in 1995. The data for firms’ headquarters are from Compustat in 1995.
B.
Estimated Wealth Distributions
Substantial personal wealth is required to buy a 5% or larger stake in one of the firms in our sample. Our data on high net worth individuals counts many wealthy people who do not in fact have the resources to buy a 5% stake in most (or any) listed firms. Is our variable informative about the very top of the wealth distribution? Also, are there enough wealthy individuals to explain the observed frequency and size of the stakes we classify as individually held? To assess whether the number and wealth of high net worth individuals are large enough to be consistent with the value of blocks in our sample, we have to extrapolate from wealthy to very wealthy individuals. The extrapolation, using the power law distribution of individual wealth, suggests that high net worth individuals have resources that would allow them, as a group, to hold 5% of public equity in most states. We provide more details in Appendix B. C.
Two-Stage Selection Model
Most of the existing empirical literature in corporate finance on the economic effects of large shareholders has estimated an equation of the following form: (1)
yit
= γdit + δj(i) + λt + βXit + εit ,
918
Journal of Financial and Quantitative Analysis
where i and t are indices for firms and years, respectively, and j(i) indicates the industry to which firm i belongs. Here, yit is a firm performance or corporate policy variable, δj(i) are industry fixed effects, λt are year fixed effects, Xit is a vector of time-varying firm-level controls (e.g., the size or age of the firm), and dit is an indicator variable that is equal to 1 if a large shareholder is present in firm i in year t, and 0 otherwise. It is not possible to draw causal inferences about the effect of blockholders on firm behavior from estimates of γ in equation (1), because there are economic reasons to expect that blocks are not randomly allocated to firms. For example, firm size or growth options are potential determinants of corporate policy choices and firm performance, but the same variables may also be correlated with the presence of a large shareholder. If Xit does not include all relevant variables, the large shareholder indicator variable dit will be correlated with the error term in equation (1), and OLS estimates of γ will be biased. For example, if the selection and treatment effects go in opposite directions, γ will be biased toward 0. To explicitly address this endogeneity problem, we use a 2-stage selection model, following Heckman and Robb (1985). The model we estimate differs from standard 2-stage least squares (2SLS) models because of the binary nature of the endogenous variable of interest (the presence of a block). As in standard 2SLS, the estimation involves 2 equations. The 1st-stage equation is (2)
where dit∗ is a latent variable, wit is our instrument (i.e., the number of high net worth individuals per firm headquarters in a state), aj(i) are industry fixed effects, ct are year fixed effects, and Xit is a vector of firm-level control variables. We report estimates of the 1st stage using both linear probability models and probit models.10 In the 2nd stage, firm performance or corporate policies are modeled and it is assessed how they are affected by the predicted probability of block presence in a firm. The 2nd-stage equation is = γBLOCK dˆ it + δj(i) + λt + βXit + εit . (3) yit Since the only endogenous variable in equation (3) is an indicator variable, this model is sometimes referred to as a “dummy endogenous variable model” (Heckman (1978)). The vector of control variables, Xit , is identical to the one included in the 1st stage. We assume that eit and εit follow a joint normal distribution with a correlation coefficient of ρ. The model is estimated by maximizing the joint likelihood function (see also Maddala (1983)).11 The estimated coefficient γBLOCK captures the treatment effect of a large shareholder on yit . 10 Similar model specifications have been estimated recently in the corporate finance literature (see, e.g., Li and Prabhala (2007)). Our specification with a 1st-stage probit (and a variable in the 1st stage that is not included in the 2nd stage) is similar to the treatment effects model estimated in Villalonga and Amit (2006). 11 The maximum likelihood estimator (MLE) model requires the assumption of joint normality of the error terms. An alternative approach would be to model the 1st stage as a probit model and then
Becker, Cronqvist, and Fahlenbrach
919
If the error terms eit and εit are uncorrelated (ρ = 0), then the effect of large shareholders on firm performance or corporate policies can be consistently estimated with OLS. If ρ is positive, then the coefficient γ estimated through OLS is overstated; if ρ is negative, then it will be understated. We test whether ρ is 0 with a χ2 test that is reported in all tables. D. 1.
Validity of the Instrument Relevancy Condition
The 1st condition for wealth density to be a valid instrument is that it significantly predicts the presence of large nonmanagerial individual shareholders in local firms. There are economic reasons to expect such a relation. First, we found that blockholders exhibit a preference for firms headquartered near where they live. Second, we found that there is significant geographic variation in the density of wealthy individuals. This is important because personal wealth is likely a key determinant of an individual’s ability to accumulate a large equity stake in a public firm. It is important to estimate regressions of block presence on wealth density with firm- and state-level controls to rule out the possibility that our instrument is correlated with some firm-level determinant of blocks (e.g., firm size) or statelevel variables (e.g., corporate tax rates). The simplest way to assess the validity of the relevancy condition is to collapse data by state. Figure 2 plots the frequency with which firms in a state have a large individual nonmanagement shareholder against our instrument. Each state is represented by a circle whose area is determined by the number of firms used to calculate the state block frequency.12 States that are large in terms of firms (e.g., California and Texas), appear large (918 and 649 observations, respectively). On the other hand, South Dakota (the low outlier just below 1.5 on the x-axis) and Iowa (the high outlier with block frequency around 55%) are small (6 and 40 observations, respectively). The graph shows an estimated regression line where observations have been weighted by the number of firms used in calculating the frequency (i.e., the circle sizes). The estimated slope is 0.190 (heteroskedasticity-robust standard error of 0.05; t-statistic of 3.77). 2.
Exclusion Restriction
The 2nd condition for our instrument’s validity is that it affects the dependent variables only through its effect on the endogenous block variable (i.e., wealth density must not affect the dependent variables directly) and not through any other mechanism. That is, the correlation between the instrument and the 2nd-stage
use traditional IV techniques where the IV is created from the probit fitted 1st-stage values. We have also estimated these regressions, and the overall results from the probit-IV regressions are similar in significance and magnitude to our reported MLE results. 12 The block frequency is an average across our sample years to maximize the number of observations used to calculate the average. Using only the 1996 cross section of blocks and firms increases the significance and estimated slope.
920
Journal of Financial and Quantitative Analysis FIGURE 2 Frequency of Individual Blocks by U.S. State
Figure 2 plots the frequency of large, individually held, nonmanagerial blocks in each state (across all sample years) against the density of high net worth individuals in 1995. Each circle represents 1 state. The area of a circle is proportional to the number of firms in the state. The solid line represents the regression line from a weighted least squares regression (weights are the number of firms). This regression has an estimated intercept of 0.031 (standard error = 0.026), with an estimated slope of 0.190 (standard error = 0.051). The slope is significantly different from 0 at the 0.1% level. The adjusted R 2 is 0.236.
error term must be 0. The validity of this condition cannot be tested econometrically with only a single instrument, but we provide several supportive empirical observations and arguments. One concern may be that areas with wealthy individuals experienced recent wealth creation (e.g., Microsoft executives in the State of Washington) so that there is a direct effect of firm performance on wealth density, or potentially reverse causality. Three arguments alleviate this concern. Our instrument reflects “old money” because it is based on inheritance data, and it is not related to contemporaneous firm performance and recent IPOs, which reduces concerns of reverse causality with firm performance. Also, our block variable does not include executives (current or former officers), that is, those most likely to have wealth created in IPOs and through superior firm performance. In addition, we measure our wealth density instrument with a lag (i.e., prior to our sample period), and while our instrument is measured at the state level, we examine performance and policies at the firm level. Second, while the density of high net worth individuals predicts individual nonmanagerial blocks, it does not predict the presence of large shareholdings by either managers or institutional investors. It therefore seems unlikely that our instrument measures the “demand for blocks.” If it did, we would expect wealth density to predict the presence of several different types of blocks, and not only nonmanagerial individual blocks. Third, it appears unlikely that location choices of firms and individuals are motivated by the market for blocks in listed firms. Firm headquarters relocations are extremely rare events. Pirinsky and Wang (2006) identify only 115 relocations among more than 5,000 firms between 1992 and 1997. Therefore, firm locations typically must be determined by early decisions that long predate the ownership structure in the very large firms in our sample.
Becker, Cronqvist, and Fahlenbrach
921
Wealthy individuals are presumably more mobile. Various agglomeration economies affect location choices (see, e.g., Duranton and Puga (2004) or Glaeser (2008) and the references therein). Wealthy people likely want to live near other wealthy individuals for social reasons and because they have correlated tastes. Such agglomeration seems consistent with the apparent concentration of wealthy people (New York’s Upper East Side, Aspen, Beverly Hills, East Hampton) and is not primarily about the production side of the economy, but about the consumption side, because that is where the major externalities are (this is unlike location choices of the middle class, where productivity externalities may dominate). In particular, expectations about future policies (e.g., leverage or payout policy) in local firms are probably less likely to figure much in location decisions of wealthy individuals. Thus, we do not believe endogenous firm or individual/block location choices affect our results to a significant extent. Finally, because we study a very broad set of corporate policies, any theory of a direct relation between wealth density and a particular policy also has to explain a large number of relationships (i.e., both the relation between wealth density and block presence and the relation with all the dependent variables). We are aware of no economic theory that predicts a direct relation between wealth density and the multitude of dependent variables that we study.
E.
Other Econometric Issues
If IVs are insufficiently correlated with endogenous variables, identification with IV suffers from a “weak instrument problem” (e.g., Bound, Jaeger, and Baker (1995), Nelson and Startz (1990), and Staiger and Stock (1997)). Weak instruments may lead to IV coefficient estimates that are biased toward OLS coefficients, and to confidence intervals that are understated. The problem of weak instruments is serious in settings with a large number of instruments, which are individually weakly correlated with the endogenous variable(s), but which as a group are able to explain some of its variation (see, e.g., Angrist, Imbens, and Krueger (1999)). When the number of instruments is low, however, IV results neither are particularly biased nor generate excess precision. Given this and the fact that we use a single instrument, weak instrument bias should not be a concern in our regressions.13 The impact of large shareholders is likely to vary across firms and owners. Our results should be interpreted with this in mind. With homogenous effects (conditional on the control variables), performance and corporate policies will be similarly affected by a large shareholder across all firms. In that case, the 2ndstage large shareholder coefficients that we estimate can be interpreted as the
13 Following Staiger and Stock (1997), it is common practice to examine the strength of the instrument in the 1st stage using F-statistics. Based on the cutoff values of Stock, Wright, and Yogo (2002) and Stock and Yogo (2005) and using the Kleibergen and Paap (2006) test statistic that allows for clustered standard errors, we can reject the null hypothesis of weak instruments in all our reported 1st-stage regressions.
922
Journal of Financial and Quantitative Analysis
effect for any firm with a large shareholder, including the majority of firms that do not actually have such a shareholder. If the homogeneity assumption does not hold, however, our regressions estimate the average impact of blocks across a subset of firms that actually have such blocks. Specifically, our estimates reflect the mean effect for those firms that have a large shareholder because they are located in states with a high wealth density measure.14 It seems highly likely that the homogeneity assumption is unwarranted, and that our estimated effects are local (i.e., they would not generally represent the average effect of blocks across the universe of firms). The potential impact of a blockholder likely varies across firms, for example, because other governance mechanisms are in place in some firms but not others, or simply because some firms are well run and some less so. Our estimated effects therefore have to be thought of as average effects for those firms that are marginal targets, that is, neither the most obvious targets (because those firms have blocks in all states) nor the firms with the lowest potential impact of a block (because those firms do not have blockholders even in states with very high wealth density). We estimate average effects across many policies, so there may be larger effects in a subset of firms with blocks.15 Second, different blocks are probably formed for different reasons, for example, to force management to raise leverage, to solidify a commercial relationship, to contain some agency problem, or to force a change in strategy. We only estimate averages, so effects of blocks that are infrequent may not be visible with our methodology. If the effects are in the tails (e.g., blocks reduce excessive leverage but do not affect nonexcessive leverage), then our specifications may also report small effects (or none).
V.
Results
A.
Wealth Density and the Presence of a Large Shareholder in a Firm
We start by reporting results from the 1st-stage regression, in which we predict the presence of a nonmanagerial individual blockholder in a firm. Table 3 reports several model specifications. We find that the density of wealthy individuals in a state significantly predicts the presence of a large shareholder in firms headquartered in that state. In all regressions predicting the presence of a nonmanagerial block, our IV’s t-statistics are significant at the 1% level. The heteroskedasticity-consistent standard errors are clustered by state. In unreported regressions, we have clustered standard errors by firm and estimate consistently smaller standard errors for the instrument.
14 For
further discussion, see Imbens and Angrist (1994) and Angrist, Imbens, and Rubin (1996). may miss potential effects of blockholders if heterogeneity leads to effects of opposite signs (see, e.g., Cronqvist and Fahlenbrach (2009)). If blockholders increase leverage in some firms but reduce it in others, the estimated net effect might be indistinguishable from 0. While perhaps possible for leverage, this possibility seems less likely for other variables (e.g., profits or liquidity). In any case, this suggests that there may be more effects of large shareholders than we identify but does not suggest ever finding any effects spuriously. 15 We
Becker, Cronqvist, and Fahlenbrach
923
TABLE 3 First-Stage Results Table 3 gives results from linear probability models and probit regressions of 3 large shareholder variables on measures of the density of high net worth individuals in a state in 1995 and controls. The dependent variables are defined as follows. The large shareholder dummy variable is equal to 1 if an individual nonmanagerial large shareholder is present in the firm, and 0 otherwise (columns (1)–(4)). Block ownership is the percentage ownership by individual nonmanagerial blockholders (column (5)). The managerial block dummy variable is equal to 1 if a large individual managerial shareholder is present in the firm, and 0 otherwise (column (6)). The Fund/MM block dummy variable is equal to 1 if a mutual fund or money manager is present in a firm, and 0 otherwise (column (7)). The sample is nondual-class S&P 1500 firms during the period 1996– 2001. Blockholders are entities that own at least 5% of outstanding shares. All other variables are defined in Appendix A. Robust standard errors (shown in parentheses) are clustered by state. ***, **, and * indicate statistical significance at the 1%, 5%, and 10% levels, respectively. Dependent Variable
Large Shareholder Dummy
Block Ownership
Managerial Block Dummy
Fund/MM Block Dummy
Probit
Regression Type
Variable Name Density of high net worth individuals (1995)
OLS
Probit
Probit
Probit
OLS
Probit
(1)
(2)
(3)
(4)
(5)
(6)
(7)
2.29*** (0.560)
0.281 (0.216)
–0.291 (0.212)
0.190*** (0.060)
0.892*** (0.250)
0.728*** (0.281)
Wealth per listed firm (1995)
0.513*** (0.174)
Lagged return
–0.071 (0.052)
–0.071 (0.052)
–0.129 (0.212)
0.008 (0.036)
–0.116*** (0.052)
log(assets, book value)
–0.159*** (0.039)
–0.158*** (0.039)
–0.304*** (0.069)
–0.221*** (0.042)
–0.142*** (0.027)
Age
0.016* (0.009)
0.016* (0.009)
0.057** (0.015)
–0.007 (0.009)
–0.009 (0.006)
Age2
–0.00021 (0.00013)
–0.00020 (0.00013)
–0.0008*** (0.0002)
–0.0002 (0.0002)
0.00008 (0.0007)
Sales growth
0.132* (0.070)
0.124* (0.070)
0.182 (0.315)
0.037 (0.065)
0.131** (0.063)
Return on assets (ROA)
–0.250 (0.309)
–0.224 (0.311)
–0.903 (0.870)
0.690*** (0.215)
–0.526 (0.447)
Year fixed effects Industry fixed effects R2
No No 0.008
No No N/A
Yes Yes N/A
Yes Yes N/A
Yes Yes 0.026
Yes Yes 0.035
Yes Yes N/A
N
5,972
5,972
5,754
5,754
5,754
5,754
5,754
A linear probability model of having a nonmanagerial individual block estimated by OLS is reported in column (1) of Table 3. The estimated coefficient on the density of high net worth individuals, 0.190, implies that a 1-standarddeviation increase in the instrument (0.420) is predicted to increase the probability of having a block by 8.0 percentage points.16 This effect is large compared to the unconditional mean probability of 11.8%. Because block probabilities are close to 0 for most firms, the linear probability model may be a poor modeling choice, and we therefore turn to other model specifications. In column (2) of Table 3, we estimate probit regressions. Our previous finding that block presence in a firm is significantly predicted by the density of local 16 This standard deviation of the instrument is calculated across 50 states. Calculating the standard deviation across firms yields a lower number (0.151) because few firms are located in the states with extreme wealth densities. An increase in the density of 0.151 increases the predicted probability of a block by 2.9 percentage points, according to column (1) of Table 3.
924
Journal of Financial and Quantitative Analysis
wealth is robust and does not change across specifications. Around the sample mean probability of having a block, the effect of increasing the density by 1 standard deviation is to increase the block probability by about 5.4 percentage points. That is, the magnitude of the effect remains large in this model. In column (3), time-varying firm-level controls, as well as year and industry-fixed effects, are included.17 The estimated effect of the instrument is slightly lower, but remains significant at the 1% level. This regression corresponds closely to the 1st-stage estimation used to identify the effect of blockholders on a range of dependent variables discussed later. Size has a negative correlation with block probabilities, and age and sales growth have positive correlations. In the remaining columns of Table 3, we report robustness checks and placebo tests. First, we consider alternative ways of defining the instrument and dependent variable. In column (4), we replace the numerator of the wealth density measure (the number of wealthy individuals) with the total wealth held by these individuals, thus incorporating information on the high net worth individuals’ average wealth (based on data from the 1995 SOI). At the sample mean, a 1-standarddeviation increase in the wealth per listed firm variable increases the predicted probability of having a block by 10%. In column (5), the dependent variable is the percentage of common stock owned by individual shareholders with large blocks, adding up across blocks if there is more than 1 such block (18% of the firms with individually held blocks have more than 1 such block, most often 2). Since this is a continuous variable, the regression is estimated with OLS. The coefficient on the density variable is highly significant and predicts that a 1-standard-deviation increase in the instrument results in a 0.96% increase in the average fraction of shares held by large individuals shareholders (the unconditional average is 1.79% of shares). We conclude from the tests reported so far that there is a robust effect of local wealth on individually held blocks in local firms, across various ways of measuring both wealth and ownership, and controlling for important firm-level variables.18 It is important for our identification not just that the instrument predicts individual blocks, but also that it does not predict the presence of other types of blocks (some small negative effect is to be expected, since the ownership shares of all owner categories add up to 1). If it did, we might be concerned that any effects we identify might reflect those other owners. In column (6) of Table 3, we report a probit specification with a dummy variable for the presence of a managerial blockholder as the dependent variable. The coefficient on the instrument is positive but insignificant. Column (7) shows a negative, but statistically insignificant, 17 Industries are based on Fama and French (1997). We have checked that our results are similar when using 2-digit North American Industry Classification System (NAICS) industries. 18 As a further robustness check, in unreported regressions, we have used the log of the number of high net worth individuals and the log of the number of firms as separate independent variables, or the number of high net worth individuals per capita and the number of firms per capita. Both variables are always significant of opposite sign and similar magnitudes. An alternative instrument involves scaling the number of high net worth individuals by the investment opportunity set available to local blockholders, proxied by the total market capitalization in the state. We used this alternative instrument, but it produces a less significant 1st-stage result (too weak to be useful in the 2nd stage). One reason for this could be that the investment opportunities for the individuals we consider are not local when it comes to investments other than blocks.
Becker, Cronqvist, and Fahlenbrach
925
effect of the instrument on the propensity to have a block owned by a mutual fund or money manager. There are two important conclusions from Table 3. First, nonmanagerial individual blocks are not randomly allocated to firms, but economic mechanisms systematically affect block allocations. For example, large shareholders select smaller firms with poor past performance, but with significant growth in their sales. Conditional on firm size, firm age is positively correlated with the presence of a blockholder in a firm, suggesting that nonmanagerial individuals do not invest in the youngest firms. These are characteristics of firms where the agency problems between owners and managers may be particularly severe. One interpretation is that the evidence so far is consistent with economic theories of large shareholders as monitors, and that blocks are systematically allocated to firms based on where the demand for monitoring is more significant. Our instrument strongly predicts the presence of a large individual shareholder. Meanwhile, the placebo tests suggest that our instrument is not identifying a set of firms with more blockholders in general, but very specifically predicts the presence of individually held blocks. Other block types are, if anything, less common when there are many local high net worth individuals. Second, causal inference regarding the impact of blocks of shares on firms is not possible from standard econometric models such as equation (1) and OLS. Because several of the variables that explain the presence of a blockholder in a firm (e.g., past performance, firm size) can also be expected to play a role in explaining firm performance and policy choices in the 2nd-stage regressions, standard models will confound selection and treatment effects of blocks. For example, we find that large shareholders select firms with relatively poor recent past performance, but conditional on such selection, we expect blockholders to improve performance through monitoring of management. This is precisely why it is important to use an instrument when quantifying the impact of block presence on firms.
B.
State-Level Control Variables
Because the variation in our instrument comes from state-level differences, a concern is that so far we have captured differences across states that are correlated with blockholder presence but have nothing to do with the economic explanation we provide. If a variable is both a determinant of block presence and correlated with our wealth density measure, our identification is not valid. Therefore, we reestimate the 1st stage with controls that may be correlated with blocks: population density, the state-level corporate tax rate, per capita income, and educational attainment. Table 4 shows that none of these state-level control variables significantly predict the presence of a nonmanagerial individual blockholder in a firm. Also, the inclusion of state-level control variables does not affect the estimated effect of our instrument much. Columns (1)–(4) include the state-level controls one by one. In column (5), which includes all the state-level controls, we find that the estimated coefficient on wealth density is 0.626 and statistically significant at the
926
Journal of Financial and Quantitative Analysis
5% level. That is, measures of economic performance or the quality of the labor force in a state do not seem to explain our evidence.19 TABLE 4 First-Stage Results with State-Level Controls Table 4 presents probit regressions of a blockholder indicator variable on the density of high net worth individuals in 1995 and other variables that vary at the state level. The dependent variable is equal to 1 if a large individual nonmanagerial shareholder is present in the firm, and 0 otherwise. The sample is nondual-class S&P 1500 firms during the period 1996– 2001. The state-level variables are defined in Section III.C. Each specification includes the firm-level controls of column (3) in Table 3. Robust standard errors (shown in parentheses) are clustered by state. ***, **, and * indicate statistical significance at the 1%, 5%, and 10% levels, respectively. Regression Type (Probit) Variable Name
(1)
Density of high net worth individuals
0.709** (0.279)
Population density
–0.005 (0.005)
Corporate tax rate (state)
(2) 0.725*** (0.281)
(3) 0.657** (0.283)
0.011 (0.014)
0.014 (0.014) –0.001 (0.002)
Educational attainment (% high school graduates)
N
C. 1.
(5) 0.626** (0.2683) –0.004 (0.004)
Per capita income
Firm control variables Year fixed effects Industry fixed effects
(4) 0.737*** (0.279)
–0.001 (0.002) 0.003 (0.005)
0.003 (0.005)
Yes Yes Yes
Yes Yes Yes
Yes Yes Yes
Yes Yes Yes
Yes Yes Yes
5,754
5,754
5,754
5,754
5,754
Empirical Analysis of the Effects of Large Shareholders Firm Performance
Table 5 reports evidence on the effect of large shareholders on performance. Column (1) estimates effects for ROA. Age, sales growth, and dividend yield have positive coefficients, while age squared has a negative coefficient.20 The coefficient on the instrumented block indicator variable is 0.037, significant at the 10% level. This implies a predicted 3.7 percentage points higher profitability, all else being equal, with the presence of a large shareholder in a firm. The magnitude of this effect is large given that the mean ROA is 4.7%. However, the 2nd-stage regression estimates a coefficient for the predicted probability of having a large nonmanagerial individual shareholder as opposed to the existence of a large shareholder. Therefore, the magnitude of the 2nd-stage coefficient measures the difference between a firm that is predicted to have a large shareholder 19 We have also included additional state-level controls: a measure of income inequality, a state of Delaware incorporation indicator variable, and the G-index of Gompers, Ishii, and Metrick (2003) as a measure of antitakeover provisions. We have included fixed effects for the 9 Census divisions (regions). None of the variables significantly predicts block presence in a firm, and none of them affects the estimated effect of wealth density. 20 We include the dividend yield and dividend payer dummy variable in the reported specification for profitability, following Fama and French (2000). Payout policy is potentially endogenous and affected by large shareholders. We find that the statistical significance of the block indicator variable is somewhat stronger if we exclude the dividend variables from the ROA and ROS specifications.
Becker, Cronqvist, and Fahlenbrach
927
with certainty and a firm that is predicted with certainty to not have a large shareholder.21 It is important to note that the relatively large profit effect estimated here is identified from the marginal firm having a block when our instrument is high, but not if it were low, and that these firms may see larger improvements from having a block than the general population of firms. We cannot use the 0.037 coefficient to predict that if we added an individual nonmanagerial block to the 88% of sample firms that do not have such a block, they would experience an average ROA improvement of 3.7%. This effect is effectively estimated for firms where there is a marginal block that would have been absent if the firm was in a state with fewer wealthy individuals. The estimated correlation coefficient of the error terms in the 1st- and 2ndstage equations is negative (–0.250) and statistically significant at the 10% level. That is, there is a systematic inverse relation between the unexplained (based on our model in the 1st stage) probability of having a block in a firm and the unexplained part from our operating performance regression model. An economic interpretation of this result is that large shareholders tend to target firms with relatively poor operating performance, holding other firm-level variables constant. In column (2) of Table 5, we replace ROA with ROS (profits scaled by sales). The impact of large shareholders is robust and remains positive and significant (this time at the 1% level). Again, the effect appears economically large. There are several potential explanations for a positive block impact on profitability and firm cash flows.22 We study two of the most straightforward ones: cost reduction and investment policy. In column (3) of Table 5, we find that SG&A expenditures, a measure of cost cutting, do not seem to be significantly affected by blocks. In column (4), we find that investments (scaled capital expenditures) of firms are lower by around 7% of assets in the presence of a block, with a coefficient significant at the 5% level. This can be compared to mean investment of 28% of assets. The estimated error term correlation between the 1st- and 2ndstage equations is positive, suggesting that large shareholders select firms that invest more. The evidence in Table 5 is consistent with theories of large shareholders as monitors. First, theory predicts that blockholders may monitor and restrain management from consuming firm resources (e.g., Demsetz and Lehn (1985), Shleifer and Vishny (1986)), thereby improving ROA and other operating performance measures. Blockholders target poorly performing firms, but conditional on such
21 For a less extreme effect, one may multiply the estimated coefficient with, for example, the interquartile range of the distribution of predicted probabilities (0.16). For expositional clarity, we discuss our results in Section V.C as moving from a probability of a large block of 0 to a probability of a large block of 1. 22 It is important to note that we do not develop a unified theory or model from which we can derive testable implications for all of our empirical tests at once. Hence, while our IV specification will enable us to determine a causal effect of blockholders on different corporate policies, we will not be able to say with certainty whether such an effect moves the firm toward a global optimum (across leverage, payout, etc.). For an alternative approach, see, for example, Coles et al. (2011) and Coles et al. (2008), who specify models in which optimal firm value and governance (level of managerial ownership and the proportion of outsiders on the board) are jointly determined by the relative importance of the productivity parameters of physical assets, managerial/insider effort, and outside director’s advising/monitoring role in the firm production process.
928
Journal of Financial and Quantitative Analysis TABLE 5 Operating Performance and Large Shareholders
Table 5 presents results from the 2nd-stage regression of operating performance measures on the instrumented large shareholder dummy and control variables. The large shareholder dummy variable is equal to 1 if a large individual nonmanagerial shareholder is present in the firm, and 0 otherwise. It is instrumented in the 1st-stage regression with the density of high net worth individuals in 1995. The last 2 rows of the table show the coefficient and standard error for the density of high net worth individuals from the 1st-stage probit regression of the large shareholder dummy variable on the density measure and controls. Here, ρˆ is the estimated correlation between 1st- and 2nd-stage error terms. The sample is nondualclass S&P 1500 firms during the period 1996–2001. All other variables are defined in Appendix A. Robust standard errors (shown in parentheses) are clustered by state. ***, **, and * indicate statistical significance at the 1%, 5%, and 10% levels, respectively. Dependent Variable
Variable Name
ROA
ROS
SG&A
Investment
(1)
(2)
(3)
(4)
Panel A. 2nd-Stage Results Large shareholder dummy [instrumented]
0.0371* (0.0221)
0.0782*** (0.0251)
–0.0625 (0.0390)
–0.0704** (0.0297)
Age
0.0006* (0.0003)
0.0004 (0.0003)
–0.002 (0.001)
–0.0036*** (0.001)
Age2 (/1,000)
–0.008* (0.004)
–0.008** (0.004)
0.00002 (0.00001)
0.00004*** (0.00001)
Assets, log
–0.0024 (0.0023)
0.0048* (0.0026)
–0.015*** (0.004)
–0.024*** (0.0036)
Sales growth
0.0163*** (0.0040)
0.0025 (0.0053)
0.010 (0.011)
0.106*** (0.027)
Dividend payer dummy
0.0008 (0.0040)
–0.002 (0.005)
Dividend yield
0.327*** (0.044)
0.219*** (0.057) 0.038 (0.039)
0.372*** (0.046)
0.009 (0.007)
0.059*** (0.007)
Lagged ROA Lagged return
0.033*** (0.003)
0.027*** (0.004)
Year fixed effects Industry fixed effects Estimated ρˆ χ2 test (ρˆ = 0)
Yes Yes –0.250 3.01*
Yes Yes –0.449 10.73***
Yes Yes 0.282 3.61*
Yes Yes 0.184 6.83***
5,503
5,509
5,172
5,485
N Panel B. 1st-Stage Results Density of high net worth individuals
0.722*** (0.281)
0.725*** (0.257)
1.013*** (0.360)
0.887*** (0.313)
selection, they have a positive impact on profitability.23 We also infer that the positive effect of blockholder presence in a firm empirically must dominate the reduction in managerial incentives effect identified by Burkart et al. (1997). One economic source through which large shareholders seem to systematically affect firm performance is improved investment efficiency. Blockholders target firms that invest more than otherwise similar firms, but then the large shareholders work 23 Our evidence complements existing evidence on blocks from event studies. For example, Holderness and Sheehan (1985) report that the stock market reacts positively to the announcement of block presence in a firm by 6 controversial so-called “raiders.” Holthausen, Leftwich, and Mayers (1987) study block trades more generally and find that price effects are permanent for buyer-initiated transactions, but temporary for seller-initiated transactions. Barclay and Holderness (1991) study negotiated block trades (mainly corporate blocks) and find that stock price increases are larger when the new blockholder achieves control. Slovin and Sushka (1993) find that the sale of a large inside block to an outside blockholder triggered by the death of an insider leads to positive announcement returns.
Becker, Cronqvist, and Fahlenbrach
929
to reduce the overall capital expenditure of these firms by restricting management from overinvesting (i.e., selecting and investing in projects with lower returns than their respective cost of capital). 2.
Capital Structure
There is a role for large shareholders to monitor leverage choices because theory predicts that managers may deviate from optimal capital structures because of underdiversified human capital (e.g., Fama (1980)) or to inflate their control (e.g., Harris and Raviv (1988), Stulz (1988)). Some existing evidence is consistent with Stulz’s theory that managers take on excessive leverage to increase the voting power of their equity (e.g., Berger, Ofek, and Yermack (1997)). The findings by Jung, Kim, and Stulz (1996) support the view that agency problems make some firms issue equity when a debt issuance would have been better for firm value. Table 6 reports our evidence on blockholder impact for 3 different leverage measures: book leverage, long-term book leverage, and market leverage. Across all measures, we find that the coefficient on the instrumented block indicator variable is negative, although only the coefficient for long-term book leverage is significant (at the 10% level). This coefficient implies 3.7 percentage points lower long-term book leverage for firms with a large blockholder, which may be compared to a mean leverage ratio of 21% in our sample. Overall, there is little evidence that blockholder presence influences firms’ capital structures. This is an average effect, and if some blockholders reduce leverage while others increase it, the average result might be 0. From a theoretical point of view, this might be TABLE 6 Capital Structure and Large Shareholders Table 6 presents results from the 2nd-stage regression of 3 measures of leverage on a large shareholder dummy and control variables. The large shareholder dummy variable is equal to 1 if a large individual nonmanagerial shareholder is present in the firm, and 0 otherwise. It is instrumented in the 1st-stage regression with the density of high net worth individuals in 1995. The last 2 rows of the table give the coefficient and standard error for the density of high net worth individuals from the 1st-stage probit regression of the large shareholder dummy variable on the density measure and controls. Here, ρˆ is the estimated correlation between 1st- and 2nd-stage error terms. The sample is nondual-class S&P 1500 firms during the period 1996–2001. All other variables are defined in Appendix A. Robust standard errors (shown in parentheses) are clustered by state. ***, **, and * indicate statistical significance at the 1%, 5%, and 10% levels, respectively. Dependent Variable
Variable Name
Leverage, BV
Long-Term Leverage, BV
Leverage, MV
(1)
(2)
(3)
Panel A. 2nd-Stage Results Large shareholder dummy [instrumented] Controls (1st, 2nd stage)
–0.0323 (0.0246)
–0.0372* (0.0222)
–0.0330 (0.0436)
2
Age, age , log(assets), sales growth, ROA, dummy for dividend payers, lagged return
Year fixed effects Industry fixed effects Estimated ρˆ χ2 test (ρˆ = 0)
Yes Yes 0.142 5.42*
Yes Yes 0.138 5.06**
Yes Yes 0.029 1.13
N
5,654
5,657
5,555
0.692** (0.286)
0.684** (0.284)
Panel B. 1st-Stage Results Density of high net worth individuals
0.747*** (0.292)
930
Journal of Financial and Quantitative Analysis
plausible, because owners’ risk aversion and lack of diversification might point to lower leverage, while control motives might favor debt financing over equity issues. The results are also consistent with the absence of any effect of large shareholders on capital structure. 3.
Resources and Payout Policy
Table 7 reports evidence on the effect of large shareholders on payout policy and cash holdings. In column (1), we study the total payout ratio (dividends and repurchases scaled by EBITDA).24 The estimated coefficient on the instrumented block indicator is positive and significant. Hence, large shareholders appear to cause firms to substantially increase their total payout. The effect is large. A block in a firm is estimated to approximately double the payout ratio compared to the sample mean. Moreover, the estimated error term correlation between the 1st- and 2nd-stage equations is negative and significant, which suggests that the blockholders we analyze tend to select firms with low payout ratios compared to other similar firms. Conditional on selecting these low-payout firms, blockholders seem to cause a significant increase in the amount paid out to shareholders.25 TABLE 7 Payout Policy, Cash Holdings, and Large Shareholders Table 7 presents results from the 2nd-stage regression of a measure of payout policy and a measure of cash holdings on a large shareholder dummy and control variables. The large shareholder dummy variable is equal to 1 if a large individual nonmanagerial shareholder is present in the firm, and 0 otherwise. It is instrumented in the 1st-stage regression with the density of high net worth individuals in 1995. The last 2 rows of the table give the coefficient and standard error for the density of high net worth individuals from the 1st-stage probit regression of the large shareholder dummy variables on the density measure and controls. Here,ρˆ is the estimated correlation between 1st- and 2nd-stage error terms. The sample is nondual-class S&P 1500 firms during the period 1996–2001. All other variables are defined in Appendix A. Robust standard errors (shown in parentheses) are clustered by state. ***, **, and * indicate statistical significance at the 1%, 5%, and 10% levels, respectively. Dependent Variable
Variable Name
Total Payout Ratio
Cash Holdings
(1)
(2)
Panel A. 2nd-Stage Results Large shareholder dummy [instrumented] Controls (1st, 2nd stage) Year fixed effects Industry fixed effects Estimated ρˆ χ2 test (ρˆ = 0)
Panel B. 1st-Stage Results Density of high net worth individuals
0.624** (0.269)
0.782*** (0.284)
24 Scaling the total dollar payout by book value of assets or market value of assets does not change our conclusions. 25 In unreported regressions, we separate payouts through dividends from payouts through repurchases and find that the increase in payouts is mostly driven by increases in dividends. One possible explanation is that dividends are a firmer commitment for management (e.g., Jagannathan, Stephens, and Weisbach (2000)).
Becker, Cronqvist, and Fahlenbrach
931
We next consider block impact on corporate cash holdings. In column (2), we find that the coefficient on the block indicator is –0.049 (significant at the 10% level). Thus, cash holdings of a firm with a block are smaller by 4.9% of total assets (sample mean cash holdings are 18%). There is some evidence that the presence of a large shareholder in a firm reduces cash holdings by about 1/3 of average holdings. Theory suggests that managers may prefer larger cash holdings and lower payout ratios because payouts reduce the amount of resources and assets under management’s control and potentially subject managers to more capital market discipline (e.g., Easterbrook (1984), Jensen (1986)). In analyzing the determinants of corporate cash holdings, Opler, Pinkowitz, Stulz, and Williamson ((1999), p. 44) conclude that “management accumulates excess cash if it has the opportunity to do so.” A possible problem with excess cash, as found by Harford (1999), is that it may allow management to pursue acquisitions that do not increase shareholder value. Our evidence suggests that blockholder monitoring restrains managers from such resource grabbing. 4.
Managerial Compensation and Governance
Table 8 reports evidence on the impact of large shareholders on managerial compensation contracts and governance structures related to a firm’s board. In column (1), where the dependent variable is the log of total CEO pay, the coefficient on the instrumented block indicator variable is –0.96, significant at the 1% level, implying that CEO pay is reduced by 0.8 standard deviations in the presence of a TABLE 8 Managerial Compensation, Governance Mechanisms, and Large Shareholders Table 8 presents results from the 2nd-stage regression of CEO pay and board structure on a large shareholder dummy and control variables. The large shareholder dummy variable is equal to 1 if a large individual nonmanagerial shareholder is present in the firm, and 0 otherwise. It is instrumented in the 1st-stage regression with the density of high net worth individuals in 1995. The last 2 rows of the table give the coefficient and standard error for the density of high net worth individuals from the 1st-stage probit regression of the large shareholder dummy variable on the density measure and controls. Here, ρˆ is the estimated correlation between 1st- and 2nd-stage error terms. The sample is nondual-class S&P 1500 firms during the period 1996–2001. All other variables are defined in Appendix A. Robust standard errors (shown in parentheses) are clustered by state. ***, **, and * indicate statistical significance at the 1%, 5%, and 10% levels, respectively. Dependent Variable
Variable Name
CEO Pay (log)
CEO Incentive Pay
No. of Outsiders on Board
(1)
(2)
(3)
–0.446*** (0.048)
2.112*** (0.156)
Panel A. 2nd-Stage Results Large shareholder dummy [instrumented] Controls (1st, 2nd stage) Year fixed effects Industry fixed effects Estimated ρˆ χ2 test (ρˆ = 0)
N
–0.960*** (0.192) 2
Age, age , log(assets), sales growth, ROA, dummy for dividend payers, lagged return) Yes Yes 0.540 15.76***
Yes Yes 0.741 56.14***
Yes Yes –0.368 1.83
4,936
4,947
5,368
Panel B. 1st-Stage Results Density of high net worth individuals
0.922*** (0.308)
0.620** (0.278)
0.480*** (0.174)
932
Journal of Financial and Quantitative Analysis
blockholder, which for the typical CEO corresponds to about $1.5 million annually in lower pay. The estimated error term correlation between the 1st- and 2nd-stage equations is positive (0.540) and significant at the 1% level, suggesting that large shareholders seem to target firms with more generous executive pay packages compared to those of otherwise similar firms.26 This large effect of blockholders seems consistent with the joint hypotheses that CEOs extract rents through compensation (e.g., Holderness and Sheehan (1985), Bertrand and Mullainathan (2001), and Bebchuk and Fried (2004)), and that blockholder monitoring can mitigate or eliminate such agency problems. Note that firm heterogeneity may be important, for example, if shareholders target poorly managed firms. We cannot infer that firms without blockholders would respond with drastic pay reductions if a blockholder appeared. We next analyze the composition of pay. In column (2) of Table 8, we find that incentive pay is a significantly smaller fraction of total compensation by 0.446 with a blockholder present in the firm. The reduction in total CEO pay because of large shareholder presence is almost all in terms of the incentive pay component. Many CEOs of large U.S. public firms receive $1M in cash pay for tax reasons, which may induce a mechanical relation between incentive pay and pay levels (incentive compensation is a lower fraction of the total pay package for CEOs with lower total compensation). This could explain our finding. Alternatively, the evidence of less incentive pay in a firm with a blockholder is consistent with substitution of different governance mechanisms. Firms with a large shareholder as a monitor do not require as much pay-for-performance sensitivity to align the interests of owners and management as do firms with no block. We also analyze the impact of large shareholders on a firm’s board composition. A seat on the board may provide a blockholder with nonpublic information about the firm as well as opportunities to influence firm decisions. In column (3) of Table 8, where the dependent variable is the number of outside directors of the firm, the coefficient on the block indicator variable is 2.1, significant at the 1% level. A block increases the number of outside directors by 2, which may be compared to the mean number of outsiders of 7.44 among the firms in our sample.27 This evidence suggests that large shareholders monitor firms by either serving on the board of directors themselves or by supporting other outside directors.28
26 Whatever selection bias affects OLS results would seem unlikely to cloud these large estimated effects of blocks on CEO pay. Indeed, CEO pay is one of the few variables where OLS results are significant in the same direction as our IV results (this is consistent with findings in Bertrand and Mullainathan (2003) that blockholders reduce CEO pay). See Table 10 for a systematic comparison of OLS and IV estimates. 27 Outside directors are often thought of as positive from a governance perspective (see, e.g., Rosenstein and Wyatt (1990), who report significantly positive share-price reactions surrounding outside director appointments). But researchers have not found much significant evidence of an effect of outside directors on longer-term firm performance measures (e.g., Hermalin and Weisbach (1991), Bhagat and Black (2002)), possibly because of the endogeneity of board composition (e.g., Hermalin and Weisbach (1998)). 28 Overall board size increases as well (not reported). As a consequence, when using the fraction of outside directors as the dependent variable, the individual nonmanagerial large shareholder variable is statistically insignificant.
Becker, Cronqvist, and Fahlenbrach 5.
933
Liquidity and Risk
Theory suggests that a potential cost of a large shareholder in a firm is reduced liquidity in the firm’s publicly traded shares (e.g., Holmstrom and Tirole (1993), Bolton and von Thadden (1998)). Table 9 reports our evidence for 3 variables: trading volume, Amihud’s (2002) illiquidity measure, and share price volatility. We find that a large shareholder in a firm causes the firm’s shares to see lower trading volume, have lower volatility, and be less liquid. These effects are significant at the 1% level, and the magnitudes are large. For example, for the trading volume regression in column (1), the estimated regression coefficient on the instrumented block indicator is –0.004, implying that the presence of a blockholder causes a decline in trading volume by 0.6 standard deviations. The evidence of lower trading volume may suggest that large shareholders mechanically reduce liquidity by keeping shares off the stock market, shrinking the float, and lowering noise trading. However, the likely drop in float is much smaller than the estimated drop in trading volume. A possible additional source of lower volume (and higher illiquidity) is the presence of privately informed traders. This result supports theoretical predictions by, for example, Glosten and Milgrom (1985) and Bhide (1993). They argue that large shareholders who reduce agency problems by monitoring management may also reduce stock liquidity by increasing informational asymmetries. In the context of liquidity, our empirical evidence suggests that the cost of the presence of a large shareholder significantly outweighs any potential benefits for small shareholders. The evidence also indirectly supports theories arguing that stock market liquidity may reduce the cost of creating a block (e.g., Maug (1998)). The estimated error term correlation between the 1st- and 2nd-stage equations in columns (1) and (2) of Table 9 are significant at the 1% level, suggesting that large shareholders target firms whose stocks are more liquid compared to those of other firms. Because these selection effects are strong, it is important to take them into account when empirically analyzing block impact on liquidity.29 The block effects on stock liquidity highlight that there are costs of large shareholders that accompany the benefits of improved monitoring of management and reduction of agency problems. Column (3) of Table 9 suggests that stock price volatility falls when a firm has an individual nonmanagerial block, although the effect is less dramatic than the volume and liquidity effects. A block is predicted to reduce annual volatility by 7.5%, which is a little less than 1/5 of average and median values. This is consistent with large shareholders influencing corporate policies in a conservative direction. D.
Robustness Checks and Additional Tests
We have performed several robustness checks. One concern is that the significance of our instrument is driven by a few states with the most extreme wealth 29 In Table 10, we discuss comparisons of OLS and instrumental coefficient estimates. Only for 1 of these dependent variables (trading volume) is the OLS coefficient significant and of the same sign as the IV estimate, and in that case it is much smaller. This is an indication of the selection effects.
934
Journal of Financial and Quantitative Analysis TABLE 9 Liquidity and Large Shareholders
Table 9 presents results from the 2nd-stage regression of measures of liquidity on a large shareholder dummy and control variables. The large shareholder dummy variable is equal to 1 if a large individual nonmanagerial shareholder is present in the firm, and 0 otherwise. It is instrumented in the 1st-stage regression with the density of high net worth individuals in 1995. The last 2 rows of the table give the coefficient and standard error for the density of high net worth individuals from the 1st-stage probit regression of the large shareholder dummy variable on the density measure and controls. Here, ρˆ is the estimated correlation between 1st- and 2nd-stage error terms. The sample is nondual-class S&P 1500 firms during the period 1996–2001. All other variables are defined in Appendix A. Robust standard errors (shown in parentheses) are clustered by state. ***, **, and * indicate statistical significance at the 1%, 5%, and 10% levels, respectively. Dependent Variable
Variable Name
Trading Volume
Illiquidity
Stock Price Volatility
(1)
(2)
(3)
Panel A. 2nd-Stage Results Large shareholder dummy [instrumented] Controls (1st, 2nd stage)
Other controls Year fixed effects Industry fixed effects Estimated ρˆ χ2 test (ρˆ = 0)
N
–0.0039*** (0.0009)
0.124*** (0.017)
–0.075*** (0.028)
Age, age2 , log(assets), sales growth, lagged return, ROA, dummy for dividend payers, institutional block ownership, dummy of NASDAQ membership, average share price Volatility
Trading volume
Volatility, Trading volume
Yes Yes 0.364 145.11***
Yes Yes –0.667 22.09***
Yes Yes 0.290 11.15***
5,636
5,633
5,614
0.388* (0.218)
0.578** (0.273)
Panel B. 1st-Stage Results Density of high net worth individuals
0.824*** (0.277)
densities. This is not the case, because we find that dropping the 10 states with the highest or lowest wealth density has little effect on the economic and statistical significance of our results. The same is true if we drop the 10 states with the lowest number of firm headquarters. A related concern is that New York City is driving our results. Many wealthy individuals may consider New York City an attractive city to live in, and at the same time, hold blocks in one of the many firms in New York. When we exclude New York City, we find that the economic and statistical significance of the estimated 1st-stage coefficient of the instrument increases. The block indicator may be proxying for nonlinear firm size effects. When we add [log(assets)]2 and [log(assets)]3 in the regressions, as well as alternative measures of size such as the log of market value and the log of sales, our results do not change (for predicting blockholders, higher powers of size tend not to be significant). Also, individual and institutional blocks may be substitutes. We have added an indicator variable for the presence of a large mutual fund, money manager, or other institutional owner as a control, but it does not affect any of our results. We also developed a potential alternative instrument using income data, which are available for a finer geographic segmentation than the state level. The Census Bureau reports data on aggregate capital income (interest, distributions, dividends, and capital gains) by location. We collected the mean of such income in 1995, in current dollars for each MSA, divided by the number of locally headquartered Compustat firms. This ratio is available for 5,242 of our approximately
Becker, Cronqvist, and Fahlenbrach
935
6,000 firm-year observations.30 We conjecture that high local capital income predicts the presence of blocks in local firms. Using the log of this ratio in the 1st stage as an alternative instrument works well. However, when both instruments are included in the 1st stage, the MSA-based instrument candidate is not statistically significant, rendering it inappropriate as an additional instrument. We have also used as an additional instrument the average wealth density in neighboring states. The idea is that if there are more wealthy individuals in a neighboring state, it may influence the effective supply of blockholders, though probably less so than the presence of in-state wealthy individuals. We calculated a straight average across the neighboring states, giving equal weight to all states (and dropping Alaskan and Hawaiian observations). This variable is too weakly correlated with blocks to be a useful variable on its own. In a simple OLS regression of the block dummy variable on the wealth instrument (as in column (1) of Table 3) and a simple average of the instrument across neighboring states, the coefficients are 0.197 (0.007) and –0.005 (0.03), respectively. We have implemented an overidentification test using either the MSA instrument or the neighboring states instrument. The overidentification test does not reject with either additional instrument. However, neither the wealth density in neighboring states nor the MSA instrument is sufficiently correlated with the block variable to make the results of the over identification tests meaningful. Finally, we check the robustness of our results for different classifications of large nonmanagerial, individual shareholders. Second-generation family members who are not current or former officers are included in our measure, but we find that excluding these blocks does not materially affect our results. Also, some blockholders who are directors do not provide their private address in firms’ proxy statements but report “same address as company.” Excluding these does not change any of our results, although significance is sometimes slightly reduced.
VI.
Discussion and Conclusion
We develop and test a new IV framework that allows us to separate selection effects from treatment effects for a large group of blockholders and to quantify their impact on several aspects of firm behavior. We start by documenting that nonmanagerial individual shareholders hold blocks in firms that are headquartered close to where they live. We then use this empirical fact to create an IV (the geographic variation in the density of wealthy individuals) for the presence of a large shareholder in a publicly traded U.S. firm. This instrument predicts the presence of a block in a firm with surprising power, and it is robust to the inclusion of variables that vary geographically, reducing concerns about its validity. Our evidence contributes in 3 ways to existing research on blockholders and more generally to corporate governance research. First, we find that blocks are not randomly allocated to firms but are systematically allocated based on where the benefits to additional monitoring are more significant. This result confirms a suspicion about block ownership endogeneity that researchers have had at least since Demsetz and Lehn (1985). Importantly, the nonrandomness of blocks matters. 30 We
lose observations because a fraction of firms are headquartered outside MSAs.
936
Journal of Financial and Quantitative Analysis
The inferences about the impact of large shareholders change significantly once we control for selection effects. Table 10 summarizes this result by showing that OLS estimates of blockholder effects combine selection and treatment effects. For example, while ROS is positively affected by a block according to our IV estimates, the OLS estimate is negative and insignificant. We infer that blocks are more likely in firms with otherwise low profitability, but that the presence of a blockholder tends to raise profits (back toward the mean). TABLE 10 Comparison of Instrumental Variable and OLS Estimates Table 10 compares instrumental variable (IV) and OLS estimates of nonmanagerial individual blockholder effects on firms. Each reported number corresponds to a separately estimated coefficient on the large shareholder dummy variable for the different dependent variables. We use the same control variables in each regression as in Tables 5–9. The IV column gives the estimated 2nd-stage coefficients on the instrumented large nonmanagerial individual shareholder dummy variable. It is instrumented with the density of high net worth individuals in 1995. The OLS column gives the corresponding OLS estimate of the large nonmanagerial individual shareholder dummy variable. All variables are defined in Appendix A. Robust standard errors (shown in parentheses) are clustered by state. ***, **, and * indicate statistical significance at the 1%, 5%, and 10% levels, respectively. Blockholder Coefficient Dependent Variable
IV
OLS
ROA ROS SG&A Investment Leverage, BV Long-term leverage, BV Leverage, MV Total payout ratio Cash holdings CEO pay (log) CEO incentive pay (log) Number of outside directors Trading volume Volatility Illiquidity
After controlling for block selection effects, we find that large shareholders affect a broad set of firm policies in addition to performance. The presence of a large shareholder reduces the firm’s investments, reduces corporate cash holdings, increases payouts to shareholders, and reduces total top-executive pay. These results are economically and statistically significant. Firms with blockholders are also found to have more outside directors on their boards. Many theories predict that large shareholders mitigate agency problems between managers and owners by monitoring management, but our paper is the first to show that blocks cause changes in firm behavior that are consistent with theories of blockholders as monitors. Finally, we find that large shareholders come with costs as well as benefits. While large shareholders improve firm performance through monitoring, we also find costs of their presence to other shareholders. One cost is a less liquid publicly traded stock because of a smaller float and because the presence of privately informed blockholders, who might sell, increases informational asymmetries and as a result increases illiquidity, consistent with theoretical predictions (e.g., Bhide (1993)). We want to recognize some limitations of our analysis. We have sidestepped the issue of how large shareholders other than individuals (e.g., institutions) affect
Becker, Cronqvist, and Fahlenbrach
937
corporate performance and policies, because our instrument is not expected to (and does not) predict the presence of such owners. It is perhaps even more challenging to identify a valid instrument for the presence of institutional investors than for individual nonmanagement blocks. Also, we have not analyzed interactions of individual blocks with other governance mechanisms because testable predictions have not been worked out theoretically (see Zwiebel (1995) for an exception), and we are concerned about reintroducing endogeneity issues in the analysis. In addition, our empirical framework does not separate the effect of the presence of a large shareholder from the threat of future block presence in a firm. As suggested by Manne (1965), the threat of actions by blockholders can influence managerial behavior, and if firms in high wealth density areas face a higher threat of block creation, this may partly explain our results. Finally, in the absence of a unified structural model from which theoretical predictions can be derived and tested, we cannot say with certainty whether the levels of, for example, payout and investment in firms with blockholders are closer to the optimal levels that would prevail in a frictionless financial system.
Appendix A. Variable Definitions ASSETS (log):
Log of total assets (Compustat item 6).
AVERAGE SHARE PRICE:
Mean daily closing share price previous year.
CASH HOLDINGS: Cash and short-term investments (item 1) ÷ lagged net property, plant, and equipment (item 8). CEO INCENTIVE PAY: Fraction of total CEO pay (ExecuComp item TDC1) that is paid in either stock or options. CEO PAY (log): Log of the sum of cash salary, cash bonus, and the Black and Scholes (1973) value of options granted during a fiscal year to the CEO (ExecuComp item TDC1). DIVIDEND YIELD: Ratio of the sum of common dividends (item 21) and preferred dividends (item 19) over book value of common equity (item 60). DIVIDEND PAYER: Indicator variable that is equal to 1 if the sum of common dividends (item 21) and preferred dividends (item 19) > 0, and 0 otherwise. FIRM AGE: Log of months since first listing on stock exchange. ILLIQUIDITY: Yearly average of absolute daily return ÷ daily dollar volume, as calculated by Amihud (2002). Data come from CRSP. INDUSTRY FIXED EFFECTS:
The 10 Fama and French (1997) industries, FF10.
INSTITUTIONAL BLOCK OWNERSHIP: Aggregate ownership by institutions, counting only blocks of 5% or more of common equity. INVESTMENT: Capital expenditures (item 128) ÷ lagged net property, plant, and equipment (item 8). LAGGED RETURN:
Stock market return over the previous fiscal year.
LEVERAGE, BV: Leverage long-term debt (item 9) + current liabilities (item 34) ÷ long-term debt + current liabilities + book value of common equity (item 60). LEVERAGE, LONG-TERM ONLY, BV: Leverage long-term debt (item 9) ÷ long-term debt + book value of common equity (item 60). LEVERAGE, MV: Leverage long-term debt (item 9) + current liabilities (item 34) ÷ long-term debt + current liabilities + market value of common equity.
938
Journal of Financial and Quantitative Analysis
MARKET CAPITALIZATION: Number of shares outstanding × calendar year closing price (item 25 × item 199). NASDAQ LISTING: Dummy variable equal to 1 for firms listed on NASDAQ, and 0 otherwise. NUMBER OF OUTSIDERS ON BOARD: Number of nonaffiliated directors on firm’s board, from the IRRC director database. PAYOUT RATIO: Common dividends (item 21) + dollar expenditures on the purchase of common and preferred stock (item 115) − the reduction in the value of the net number of preferred shares outstanding (changes in item 56) ÷ EBITDA. RETURN ON ASSETS: Ratio of EBITDA (item 18) ÷ lagged total assets (item 6). RETURN ON SALES: Ratio of EBITDA (item 18) ÷ lagged total sales (item 12). SALES GROWTH: Net sales (item 12) ÷ lagged net sales, minus 1. SG&A: Selling, general, and administrative expenses (item 189) ÷ sales (item 12). TRADING VOLUME: Yearly average of number of shares traded per month ÷ total shares outstanding. VOLATILITY: Annualized standard deviation of monthly share price, calculated over previous 24 months.
Appendix B. Wealth Levels Relative to Blockholdings In Appendix B we consider the resources of high net worth individuals, relative to the size of the equity blockholdings we study (see Section IV.B). We use the fact that empirical wealth distributions closely follow a power law, at least for the top 5%–10% of individuals by wealth (e.g., Levy and Solomon (LS) (1997), Klass, Biham, Levy, Malcai, and Solomon (2006)). Such a power law implies a particular relationship between the wealth rank of an individual and her wealth. Using this empirical fact, we may estimate the number of people of any particular wealth level (as long as it is in the top 5%–10% of individuals) using the number of people above the cutoff for the SOI wealth data. We use the power law parameter of 1.36, as estimated by LS (1997), to estimate the top of the wealth distribution.31 We infer the number and wealth of the very wealthiest individuals for each state in 1998. Table B1 presents our estimates of the wealth distributions for Oregon (with the median number of millionaires: 27,000), Georgia (75th percentile: 64,000), New York (2nd highest: 243,000), and California (highest: 412,000). In these 4 states, the estimated wealth of the 100 richest individuals was $17.4 billion, $32.8 billion, $87.4 billion, and $128.8 billion, respectively. The estimated number of ultrawealthy individuals (with more than $100 million in personal wealth) is 51 in Oregon, 122 in Georgia, 463 in New York, and 785 in California. The table also reports the number of sample firms in each state, the total market value of equity of these firms, and the median, average, and largest firm market values in 1999. Five percent of the median firm’s market value across the 4 states is $43 million, $70 million, $171 million, and $58 million, respectively, and there are an estimated 162, 198, 223, and 1,659 individuals with enough estimated wealth to buy such a stake if they invested all their wealth. These estimates suggest that there is enough money in the hands of the wealthiest individuals for them to potentially play a significant role as owners of large blocks of shares. The estimates in Table B1 depend on the accuracy of the power law distribution. The following exercise shows that an extrapolation using the power law distribution works remarkably well and that the variable we use tracks the whole top of the wealth distribution, including its far tail. Forbes publishes an annual list of the wealthiest Americans and 31 LS (1997) use data from the 1996 Forbes 400 list of the richest people in the U.S. to back out the parameter of 1.36. Klass et al. (2006) calculate an average parameter of 1.49 using the Forbes 400 lists during 1988–2003. We use the 1996 parameter, as it predates our sample.
Becker, Cronqvist, and Fahlenbrach
939
TABLE B1 Estimated Wealth Distributions Table B1 presents estimates of the number and wealth of high net worth individuals for 4 U.S. states (Oregon, Georgia, New York, and California). The wealth estimates are based on data from the Internal Revenue Service’s Statistics of Income (SOI) data, which report the estimated number of individuals with a high net worth ($1M and up) in 1998. The wealth of subsamples of these individuals (100 richest, number with $100 million or more in net wealth) is estimated assuming individual net wealth follows a power law distribution with Wn = A × n−1/1.36 for wealth W and individual rank n, where A is a constant. The parameter of 1.36 is estimated by Levy and Solomon (LS) (1997). The 1999 end-of-year market value and number of listed firms are constructed from Compustat data. The sample is nondual-class S&P 1500 firms. Variable Name
Oregon
Georgia
New York
California
Data Source
No. of individuals with high net worth Wealth of 100 richest individuals ($M) Their wealth as fraction of state market value 1999 No. of individuals with $100M in wealth Their wealth as fraction of state market value 1999 No. of sample firms in state (1999) Total market value of equity in 1999 ($M) Median market value in 1999 × 5% ($M) Average market value in 1999 × 5% ($M) Largest market value in 1999 × 5% ($M)
27,000 17,367 140%
64,000 32,759 8%
243,000 87,373 5%
412,000 128,817 9%
SOI (1995) Estimate using LS (1997)
51 110%
122 9%
463 8%
785 18%
Estimate using LS (1997)
7 12,420 43 89 259
26 392,538 70 755 7,200
70 1,827,770 171 1,015 17,500
153 1,420,483 58 597 9,700
Compustat Compustat Compustat Compustat Compustat
198 8 0.6 0.4
223 20 0.6 0.4
No. of individuals with enough wealth to buy 5% of: Median firm in state 162 Average firm in state 61 2nd largest firm in state 27 Largest firm in state 14.1
Estimates using LS (1997) 1,659 69 1.9 1.6
their principal residences. The minimum wealth required to make the 1998 list was $430 million. We count the number of high net worth individuals in each state. We then use the power law and the SOI data to predict, for each state, the number of individuals with wealth greater than $430 million. Finally, we compare our estimates to the actual number of ultrawealthy individuals. Figure B1 plots the actual against the predicted number of individuals with more than $430 million in each state. The correlation coefficient is 0.89 and highly statistically significant. Thus, the power law distribution can be used to accurately predict the geographic distribution of ultrawealthy individuals using the distribution of moderately wealthy individuals. FIGURE B1 Actual versus Predicted Number of Individuals on the Forbes 400 List Figure B1 plots state by state, the actual number of individuals on the Forbes list of the wealthiest Americans (in 1998) against the predicted number of individuals. We use the wealth data from the Internal Revenue Service’s Statistics of Income (SOI) database (1998) and the power law distribution with a parameter of 1.36 estimated by Levy and Solomon (1997) to predict the number of individuals on the list (minimum wealth required to be on the Forbes 1998 list was $430 million). The correlation coefficient between actual and predicted number of ultrawealthy individuals is 0.89.
940
Journal of Financial and Quantitative Analysis
References Admati, A. R., and P. Pfleiderer. “The ‘Wall Street Walk’ and Shareholder Activism: Exit as a Form of Voice.” Review of Financial Studies, 22 (2009), 2645–2685. Amihud, Y. “Illiquidity and Stock Returns: Cross-Section and Time-Series Effects.” Journal of Financial Markets, 5 (2002), 31–56. Angrist, J. D.; G. Imbens; and A. B. Krueger. “Jackknife Instrumental Variables Estimation.” Journal of Applied Econometrics, 14 (1999), 57–67. Angrist, J. D.; G. W. Imbens; and D. B. Rubin. “Identification of Causal Effects Using Instrumental Variables.” Journal of the American Statistical Association, 91 (1996), 444–455. Bailey, W.; A. Kumar; and D. T. Ng. “Foreign Investments of U.S. Individual Investors: Causes and Consequences.” Management Science, 54 (2008), 443–459. Barclay, M. J., and C. G. Holderness. “Private Benefits from Control of Public Corporations.” Journal of Financial Economics, 25 (1989), 371–395. Barclay, M. J., and C. G. Holderness. “Negotiated Block Trades and Corporate Control.” Journal of Finance, 46 (1991), 861–878. Bebchuk, L., and J. Fried. Pay Without Performance: The Unfulfilled Promise of Executive Compensation. Cambridge, MA: Harvard University Press (2004). Berger, P. G.; E. Ofek; and D. L. Yermack. “Managerial Entrenchment and Capital Structure Decisions.” Journal of Finance, 52 (1997), 1411–1438. Berle, A. A., and G. C. Means. The Modern Corporation and Private Property. New York, NY: MacMillan (1932). Bertrand, M., and S. Mullainathan. “Are CEOs Rewarded for Luck? The Ones without Principals Are.” Quarterly Journal of Economics, 116 (2001), 901–932. Bertrand, M., and S. Mullainathan. “Enjoying the Quiet Life? Corporate Governance and Managerial Preferences.” Journal of Political Economy, 111 (2003), 1043–1075. Bhagat, S., and B. Black. “The Non-Correlation between Board Independence and Long-Term Firm Performance.” Journal of Corporation Law, 27 (2002), 231–273. Bhide, A. “The Hidden Costs of Stock Market Liquidity.” Journal of Financial Economics, 34 (1993), 31–51. Black, B. S. “Shareholder Passivity Reexamined.” Michigan Law Review, 89 (1990), 520–608. Black, F., and M. Scholes. “The Pricing of Options and Corporate Liabilities.” Journal of Political Economy, 81 (1973), 637–654. Bolton, P., and E.-L. von Thadden. “Blocks, Liquidity, and Corporate Control.” Journal of Finance, 53 (1998), 1–25. Bound, J.; D. A. Jaeger; and R. M. Baker. “Problems with Instrumental Variables Estimation When the Correlation between the Instruments and the Endogenous Explanatory Variable Is Weak.” Journal of the American Statistical Association, 90 (1995), 443–450. Brav, A.; W. Jiang; F. Partnoy; and R. S. Thomas. “Hedge Fund Activism, Corporate Governance, and Firm Performance.” Journal of Finance, 63 (2008), 1729–1775. Brickley, J. A.; R. C. Lease; and C. W. Smith, Jr. “Ownership Structure and Voting on Antitakeover Amendments.” Journal of Financial Economics, 20 (1988), 267–291. Burkart, M.; D. Gromb; and F. Panunzi. “Large Shareholders, Monitoring, and the Value of the Firm.” Quarterly Journal of Economics, 112 (1997), 693–728. Chhaochharia, V., and Y. Grinstein. “Corporate Governance and Firm Value: The Impact of the 2002 Governance Rules.” Journal of Finance, 62 (2007), 1789–1825. Clifford, C. P. “Value Creation or Destruction? Hedge Funds as Shareholder Activists.” Journal of Corporate Finance, 14 (2008), 323–336. Coles, J. L.; M. L. Lemmon; and J. F. Meschke. “Structural Models and Endogeneity in Corporate Finance: The Link between Managerial Ownership and Corporate Performance.” Journal of Financial Economics, forthcoming (2011). Coles, J. L.; M. L. Lemmon; and Y. A. Wang. “The Joint Determinants of Managerial Ownership, Board Independence, and Firm Performance.” Working Paper, University of Utah (2008). Coval, J. D., and T. J. Moskowitz. “Home Bias at Home: Local Equity Preference in Domestic Portfolios.” Journal of Finance, 54 (1999), 2045–2073. Coval, J. D., and T. J. Moskowitz. “The Geography of Investment: Informed Trading and Asset Prices.” Journal of Political Economy, 109 (2001), 811–841. Cronqvist, H., and R. Fahlenbrach. “Large Shareholders and Corporate Policies.” Review of Financial Studies, 22 (2009), 3941–3976. Davis, G. F., and E. H. Kim. “Business Ties and Proxy Voting by Mutual Funds.” Journal of Financial Economics, 85 (2007), 552–570. Del Guercio, D., and J. Hawkins. “The Motivation and Impact of Pension Fund Activism.” Journal of Financial Economics, 52 (1999), 293–340.
Becker, Cronqvist, and Fahlenbrach
941
Demsetz, H. “The Structure of Ownership and the Theory of the Firm.” Journal of Law and Economics, 26 (1983), 375–390. Demsetz, H., and K. Lehn. “The Structure of Corporate Ownership: Causes and Consequences.” Journal of Political Economy, 93 (1985), 1155–1177. Diamond, D. W. “Financial Intermediation and Delegated Monitoring.” Review of Economic Studies, 51 (1984), 393–414. Dlugosz, J.; R. Fahlenbrach; P. Gompers; and A. Metrick. “Large Blocks of Stock: Prevalence, Size, and Measurement.” Journal of Corporate Finance, 12 (2006), 594–618. Duranton, G., and D. Puga. “Micro-Foundations of Urban Agglomeration Economies.” In Handbook of Regional and Urban Economics, vol. 4, J. V. Henderson and J.-F. Thisse, eds. Amsterdam, The Netherlands: Elsevier BV (2004). Easterbrook, F. H. “Two Agency-Cost Explanations of Dividends.” American Economic Review, 74 (1984), 650–659. Edmans, A. “Blockholder Trading, Market Efficiency, and Managerial Myopia.” Journal of Finance, 64 (2009), 2481–2513. Fama, E. F. “Agency Problems and the Theory of the Firm.” Journal of Political Economy, 88 (1980), 288–307. Fama, E. F., and K. R. French. “Industry Costs of Equity.” Journal of Financial Economics, 43 (1997), 153–193. Fama, E. F., and K. R. French. “Forecasting Profitability and Earnings.” Journal of Business, 73 (2000), 161–175. Glaeser, E. L. “Are Cities Dying?” Journal of Economic Perspectives, 12 (1998), 139–160. Glaeser, E. L. Cities, Agglomeration and Spatial Equilibrium. Oxford, UK: Oxford University Press (2008). Glosten, L. R., and P. R. Milgrom. “Bid, Ask and Transaction Prices in a Specialist Market with Heterogeneously Informed Traders.” Journal of Financial Economics, 14 (1985), 71–100. Gompers, P.; J. Ishii; and A. Metrick. “Corporate Governance and Equity Prices.” Quarterly Journal of Economics, 118 (2003), 107–155. Gorton, G., and M. Kahl. “Blockholder Scarcity, Takeovers, and Ownership Structures.” Journal of Financial and Quantitative Analysis, 43 (2008), 937–974. Grossman, S. J., and O. D. Hart. “Takeover Bids, the Free-Rider Problem and the Theory of the Corporation.” Bell Journal of Economics, 11 (1980), 42–64. Harford, J. “Corporate Cash Reserves and Acquisitions.” Journal of Finance, 54 (1999), 1969–1997. Harris, M., and A. Raviv. “Corporate Control Contests and Capital Structure.” Journal of Financial Economics, 20 (1988), 55–86. Heckman, J. J. “Dummy Endogenous Variables in a Simultaneous Equations System.” Econometrica, 46 (1978), 931–959. Heckman, J. J., and R. Robb, Jr. “Alternative Methods for Evaluating the Impact of Interventions: An Overview.” Journal of Econometrics, 30 (1985), 239–267. Hermalin, B. E., and M. S. Weisbach. “The Effects of Board Composition and Direct Incentives on Firm Performance.” Financial Management, 20 (1991), 101–112. Hermalin, B. E., and M. S. Weisbach. “Endogenously Chosen Boards of Directors and Their Monitoring of the CEO.” American Economic Review, 88 (1998), 96–118. Hochberg, Y. V., and L. Lindsey. “Incentives, Targeting, and Firm Performance: An Analysis of NonExecutive Stock Options.” Review of Financial Studies, 23 (2010), 4148–4186. Hochberg, Y. V.; P. Sapienza; and A. Vissing-Jorgensen. “A Lobbying Approach to Evaluating the Sarbanes-Oxley Act of 2002.” Journal of Accounting Research, 47 (2009), 519–583. Holderness, C. G. “A Survey of Blockholders and Corporate Control.” Federal Reserve Bank of New York Economic Policy Review, 9 (2003), 51–64. Holderness, C. G., and D. P. Sheehan. “Raiders or Saviors? The Evidence on Six Controversial Investors.” Journal of Financial Economics, 14 (1985), 555–579. Holmstrom, B., and J. Tirole. “Market Liquidity and Performance Monitoring.” Journal of Political Economy, 101 (1993), 678–709. Holthausen, R. W.; R. W. Leftwich; and D. Mayers. “The Effect of Large Block Transactions on Security Prices: A Cross-Sectional Analysis.” Journal of Financial Economics, 19 (1987), 237–267. Imbens, G. W., and J. D. Angrist. “Identification and Estimation of Local Average Treatment Effects.” Econometrica, 62 (1994), 467–475. Jagannathan, M.; C. P. Stephens; and M. S. Weisbach. “Financial Flexibility and the Choice between Dividends and Stock Repurchases.” Journal of Financial Economics, 57 (2000), 355–384. Jensen, M. C. “Agency Costs of Free Cash Flow, Corporate Finance, and Takeovers.” American Economic Review, 76 (1986), 323–329.
942
Journal of Financial and Quantitative Analysis
Jensen, M. C. “Eclipse of the Public Corporation.” Harvard Business Review, 67 (1989), 61–74. Jensen, M. C., and W. H. Meckling. “Theory of the Firm: Managerial Behavior, Agency Costs and Ownership Structure.” Journal of Financial Economics, 3 (1976), 305–360. Jung, K.; Y.-C. Kim; and R. M. Stulz. “Timing, Investment Opportunities, Managerial Discretion, and the Security Issue Decision.” Journal of Financial Economics, 42 (1996), 159–185. Kahn, C., and A. Winton. “Ownership Structure, Speculation, and Shareholder Intervention.” Journal of Finance, 53 (1998), 99–129. Kedia, S., and S. Rajgopal. “Neighborhood Matters: The Impact of Location on Broad Based Stock Option Plans.” Journal of Financial Economics, 92 (2009), 109–127. Klass, O. S.; O. Biham; M. Levy; O. Malcai; and S. Solomon. “The Forbes 400 and the Pareto Wealth Distribution.” Economics Letters, 90 (2006), 290–295. Kleibergen, F., and R. Paap. “Generalized Reduced Rank Tests Using the Singular Value Decomposition.” Journal of Econometrics, 133 (2006), 97–126. Lerner, J. “Venture Capitalists and the Oversight of Private Firms.” Journal of Finance, 50 (1995), 301–318. Levy, M., and S. Solomon. “New Evidence for the Power–Law Distribution of Wealth.” Physica A, 242 (1997), 90–94. Li, K., and N. R. Prabhala. “Self-Selection Models in Corporate Finance.” In Handbook of Corporate Finance, vol. 1, B. E. Eckbo, ed. Amsterdam, Holland: Elsevier BV (2007). Maddala, G. S. Limited-Dependent and Qualitative Variables in Econometrics. Cambridge, UK: Cambridge University Press (1983). Manne, H. G. “Mergers and the Market for Corporate Control.” Journal of Political Economy, 73 (1965), 110–120. Maug, E. “Large Shareholders as Monitors: Is There a Trade-Off between Liquidity and Control?” Journal of Finance, 53 (1998), 65–98. Nelson, C. R., and R. Startz. “The Distribution of the Instrumental Variables Estimator and Its t-Ratio When the Instrument Is a Poor One.” Journal of Business, 63 (1990), S125–S140. Opler, T.; L. Pinkowitz; R. M. Stulz; and R. Williamson. “The Determinants and Implications of Corporate Cash Holdings.” Journal of Financial Economics, 52 (1999), 3–46. P´erez-Gonz´alez, F. “The Impact of Acquiring ‘Control’ on Productivity: Evidence from Mexican Manufacturing Plants.” Working Paper, Stanford University (2005). Pirinsky, C., and Q. Wang. “Does Corporate Headquarters Location Matter for Stock Returns?” Journal of Finance, 61 (2006), 1991–2015. Roe, M. J. “Political and Legal Restraints on Ownership and Control of Public Companies.” Journal of Financial Economics, 27 (1990), 7–41. Rosenstein, S., and J. G. Wyatt. “Outside Directors, Board Independence, and Shareholder Wealth.” Journal of Financial Economics, 26 (1990), 175–191. Shleifer, A., and R. W. Vishny. “Large Shareholders and Corporate Control.” Journal of Political Economy, 94 (1986), 461–488. Slovin, M. B., and M. E. Sushka. “Ownership Concentration, Corporate Control Activity, and Firm Value: Evidence from the Death of Inside Blockholders.” Journal of Finance, 48 (1993), 1293– 1321. Smith, M. P. “Shareholder Activism by Institutional Investors: Evidence from CalPERS.” Journal of Finance, 51 (1996), 227–252. Staiger, D., and J. H. Stock. “Instrumental Variables Regression with Weak Instruments.” Econometrica, 65 (1997), 557–586. Stock, J. H.; J. H. Wright; and M. Yogo. “A Survey of Weak Instruments and Weak Identification in Generalized Methods of Moments.” Journal of Business and Economic Statistics, 20 (2002), 518–529. Stock, J. H., and M. Yogo. “Asymptotic Distributions of Instrumental Variables Statistics with Many Weak Instruments.” In Identification and Inference for Econometric Models: Essays in Honor of Thomas Rothenberg, D. W. K. Andrews and J. H. Stock, eds. Cambridge, UK: Cambridge University Press (2005). Stulz, R. M. “Managerial Control of Voting Rights: Financing Policies and the Market for Corporate Control.” Journal of Financial Economics, 20 (1988), 25–54. Villalonga, B., and R. Amit. “How Do Family Ownership, Control and Management Affect Firm Value?” Journal of Financial Economics, 80 (2006), 385–417. Zwiebel, J. “Block Investment and Partial Benefits of Corporate Control.” Review of Economic Studies, 62 (1995), 161–185.
Estimating the Effects of Large Shareholders Using a ...
A public firm's shareholders have extensive legal control rights in the corpo- ration, but in practice ..... his utility). The net effect of concentrated ownership, that is, the benefits of mon- ... address, but state âsame address as company.â We thus ...
B003 The Effects Of The Airline Deregulation On Shareholders' Wealth.pdf. B003 The Effects Of The Airline Deregulation On Shareholders' Wealth.pdf. Open.
Jun 3, 2008 - We also find blockholder fixed effects in firm performance measures, and ... board membership, direct management involvement, or with a ...
Sep 1, 2015 - Their applications utilize data from online sample frames or ... is unsurprising to find that 37% of enrollees do not make health insurance decision on .... mail order, and the prevalence and stringency of prior authorization requiremen
Sep 1, 2015 - bility by developing two additional suspect choice indicators. ...... premiums, or (2) (mis)assignment to plans requiring higher expenditures due ..... Reason: Financial Decisions over the Life-Cycle and Implications for Regula- .... ht
Sep 1, 2015 - Human Services Office of the Assistant Secretary for Planning and Evaluation, the ASU Health Economics ... Their applications utilize data from online sample .... insurance programs since the start of Medicare. ... ty such as customer s
... to achieve a decline of the ten-year Treasury yield by 52 basis points. In other words, the. 1Gagnon et al. (2010), the working paper version of this paper, provides a more extended discussion of the LSAPs' implementation and gave me a sense of r
Bovine Spongiform Encephalopathy (BSE) clinical surveillance data were .... where pa is the proportion of animals in the population that are of age a, and aa reflects the rel- ...... This work was funded by a grant from GIS ''Infection a` Prions''.
Available online 19 January 2007. Abstract .... sive surveillance system was set up, in which veterinary practitioners and farmers were required to report animals ...
CFD platform, in: accepted the 12th International Topical Meeting on. Nuclear Reactor Thermal Hydraulics (NURETH-12), Pittsburgh, Pennsyl- vania, USA ...
similar. Many social and biological networks have been recently found to dis- ... of share alone, nor in the distribution of shares Wij over all nodes. We define.
E-mail address of the corresponding author: mirkin@uic. ... mised DNA topoisomerases on DNA templates ...... Modulation of tyrT promoter activity by template.
methods using data mining algorithms such as neural networks and support vector ... machine learning techniques viz. linear regression, linear regression with ...
â Department of Marketing, Yale School of Management, 52 Hillhouse Ave. Rm. 319, ... western University, 2001 Sheridan Road, Evanston, IL 60208. Email: y%.
Pohang University of Science and Technology ..... Lecture Notes in Computer Science, Springer-Verlag, ... Series, Federal Reserve Board, Washington (1995).
Available online 22 September 2009. Keywords: Irrigation .... information to the CORINE agricultural land use classes respecting regional crop areas. ... program developed at the Texas agricultural experimental station at regional level.
Based on this argument, Himmelberg, Hubbard, and Palia (1999) recently ..... own company charters, annual reports, and Web pages, and the commercial tele- ... member's sale of traded high voting shares to a third party (a sort of right of ..... be go
Pohang University of Science and Technology. Pohang ... A (generalized) radial ba- sis function .... Lecture Notes in Computer Science, Springer-Verlag,.
perform the estimations for a single simulation repli- cate. For this reason, we performed a limited ...... should cover as many pairwise-distance classes as possi-.
perform the estimations for a single simulation repli- cate. For this reason, we performed a limited ...... should cover as many pairwise-distance classes as possi-.
collection of machines, meaning that this search for dirty cells must be distributed. ...... to create a wide variety of infrastructure but could be limiting for application ...