Estimating End-Use Emissions Factors For Policy Analysis: The Case of Space Cooling and Heating Grant D. Jacobsen∗ University of Oregon Published: Environmental Science & Technology, 48.12 (2014) 6544-6552
Abstract This paper provides the first estimates of end-use specific emissions factors, which are estimates of the amount of a pollutant that is emitted when a unit of electricity is generated to meet demand from a specific end-use. In particular, this paper provides estimates of emissions factors for space cooling and heating, which are two of the most significant end-uses. The analysis is based on a novel two-stage regression framework that estimates emissions factors that are specific to cooling or heating by exploiting variation in cooling and heating demand induced by weather variation. Heating is associated with similar or greater CO2 emissions factor than cooling in all regions. The difference is greatest in the Midwest and Northeast, where the estimated CO2 emissions factor for heating is more than 20% larger than the emissions factor for cooling. The minor differences in emissions factors in other regions, combined with the substantial difference in the demand pattern for cooling and heating, suggests that the use of overall regional emissions factors is reasonable for policy evaluations in certain locations. Accurately quantifying the emissions factors associated with different end-uses across regions will aid in designing improved energy and environmental policies.
∗
Post: 1209 University of Oregon, 119 Hendricks Hall, Eugene, OR, 97403-1209, Tel: (541) 346-3419, Fax: (541) 346-2040, Email:
[email protected]
1
1 Introduction Electricity generation produces substantial emissions of harmful air pollutants, such as carbon dioxide, sulfur dioxide, and nitrogen oxides. In 2012, electricity generation led to the release of about 40 percent the U.S. total greenhouse gas emissions, amounting to 2,023 Tg CO2 Eq.1 Based on a social cost of carbon figure of $36 metric ton of CO2 ,2 the collective damages from these emissions are over $70 billion dollars. Numerous policies have been implemented that aim, at least in part, to reduce the emissions from electricity generation. Some policies, such as energy efficiency standards, decrease emissions by reducing demand for electricity. Other policies, such as Renewable Portfolio Standards, reduce emissions by displacing dirty generation with cleaner generation. Due to the extent of emissions-related damages, policies that reduce emissions levels can have major impacts on social welfare. However, evaluating the effect of such policies, which is often a required component of the federal rule-making process, is challenging because of the complexity of the electric system. Electricity is generated by numerous different sources, and different sources of generation are associated with high emissions rates (e.g., coal-fired generation), moderate emissions rates (e.g., gas-fired generation), or zero emissions (e.g., hydropower). The extent to which a policy achieves emissions reductions depends on the manner in which the conserved or displaced electricity would have been generated. For example, policies that induce conservation during summer when load is higher and additional generation sources are brought online may have a different impact on emissions than policies that induce conservation during other periods. There are currently a variety of approaches for calculating “emissions factors”, which represent the estimated change in emissions associated with a change in electricity generation. Emissions factors are used in policy analysis to calculate the expected change in pollution
2
associated with a policy-induced change in generation. Most emissions factors are based on either average emissions rates or simulated models of the electricity dispatch.3 The EPA’s eGrid database is a widely used source for emissions factors and reports average emissions rates for total generation, fossil-fuel based generation, and non-baseload generation (nonbaseload generators are assumed to be combustion-based generators with capacity factors less than 0.8). While the eGrid factors can be easily calculated, there are challenges in applying them to policy analysis because policies tend to target a specific end-use or set of end-uses (primary residential end-uses and corresponding energy amounts are displayed in Table 1). For example, the U.S. Department of Energy (DOE) sets individual standards for more than 50 types of appliances and equipment, including clothes dryers and washers, dishwashers, refrigerators, air-conditioners, heating equipment, and others. Additionally, “energy code” provisions in building codes set efficiency standards targeted at space heating, space cooling, and water heating.4 Because different end-uses are associated with different demand patterns (i.e. demand for space cooling tends to occur during the day in summer months), it is not clear which of the eGrid factors, if any, is appropriate for each end-use. However, these emissions factors can play an important role in both policy analysis and design. For example, recent research has shown that the extent to which optimally-designed energy codes trade-off conservation of electricity versus natural gas energy savings depends on how the emissions factors for electricity compares to that of natural gas.5 This paper employs a regression framework to estimate emissions factors that are tailored to specific end-uses, as well as to estimate overall regional emissions factors. In particular, emissions factors are estimated for two of the primary end-uses: space cooling and space heating. The analysis is based on a two-stage procedure in which the first stage ex-
3
ploits weather variation to estimate cooling or heating-induced demand, and the second stage estimates the emissions factor for space cooling or space heating. Results indicate that emissions factors for heating-induced demand are greater, by 8% on average, than those for cooling-induced demand. The difference is substantial in some regions, such as the Northeast, and almost non-existent in others, such as the West. Given the substantial difference in the pattern of demand for heating and cooling electricity (both across hours-of-the-day and seasons), the results suggest that overall regional emissions factors may be reasonable for analyses of most policies in these areas, even if the policies target specific end-uses. This research relates to recent studies that have used a regression framework to investigate heterogeneity in the emissions associated with electricity generation. In particular, researchers have used regression analysis to estimate marginal emissions factors (MEFs). MEFs represent the emissions rate for the marginal generator in a given region at a given time.6−7 The studies have found variation in marginal emissions rates across regions of the United States, as well as across time-of-day and season. However, applying these sets of emissions factors to evaluate the outcomes induced by policies requires precise information about the manner in which a policy conserves energy (e.g. the hours when the electricity is conserved) and this information is very rarely available. Additionally, the methodologies applied in these papers are based on hourly variation in generation and emissions. The estimates provided in the present paper are based on monthly variation and capture a richer set of generator responses, such as generators with low ramp rates and high start-up costs coming online in anticipation of a period of elevated demand. This issued is discussed further in section 3. This research also relates to research that has examined the impact of wind-generation on emissions levels.8−10 These studies regress hourly emissions levels on the amount of
4
hourly wind generation. The results indicate that increased wind generation is associated with decreased emissions, that the extent to which a kWh of wind generation reduces emissions varies substantially across turbines, and that the nature of the variation depends on the time profile of the turbine’s output and the regional generation mix. While these studies are useful for evaluating supply-side changes related to alternative sources of generation, the present study is more useful for evaluating demand-side changes, such as changes in consumption induced by an increase in efficiency standards for air-conditioners. This paper proceeds as follows. Section 2 presents background information on electricity generation and dispatch. Section 3 presents the data and describes the empirical framework for estimating emissions factors for space cooling and heating. Section 4 presents the results. Section 5 discusses implications of the results and concludes the paper.
2 Background on Electricity Generation and Dispatch The electric system in the United States consists of over 15,000 generators.11 Emissions are primarily produced by generators that are fueled by coal, oil, or natural gas, and these fuels produce different rates of emissions. Coal tends to be the dirtiest fuel source and natural gas the cleanest. The average U.S. emissions rates for CO2 are 2.15, 1.88, and 0.94 lbs./kWh for coal, oil, or natural gas fired generation, respectively. The corresponding numbers for SO2 are 6.51, 6.53, 0.12 lbs./MWh, and the corresponding numbers for NOX are 2.02, 2.82, 0.49 lbs./MWh.11 There is also variation in emissions factors across generators with similar fuel types due to numerous factors, such as the efficiency of the plant and the installation of available control technologies. In addition to varying in their fuel sources and emissions rates, generators also vary in other important ways related to their output and operating decisions, including their capac5
ity, variable costs, start-up costs, start-up times, turn-down capability (i.e. minimum generation levels) and ramp rates (i.e. the speed at which they can increase or decrease their generation). Generators typically can be classified as either baseload units, intermediate units, or peaking units. Baseload units — which are often coal-fired facilities — generally have high start-up costs and low variable costs, operate 24 hours a day, have slow ramp rates, and have relatively high minimum generation levels. The start-up costs often occur indirectly through damages from the large thermal and pressure stresses that are experienced by baseload plants when they are turned on or off.12 Intermediate and peaking units — typically natural gas or oil-fired facilities — generally have higher costs, operate at varying load levels in response to system demand, including on/off, and have faster ramp rates. The importance of grid reliability combined with the high costs of storing electricity mandates that generation and demand be balanced at all times, and this balancing is maintained by system operators that bring additional generators online as demand increases. The pattern in which generators are dispatched to meet demand (i.e. the “dispatch curve”) depends on several factors, including variable cost, plant start-up times and costs, ramp rate, and transmission constraints. While the lowest-cost sources of generation are likely to be dispatched early, the short-term volatility in load requires that system operators also maintain flexibility in the generation fleet. The need for flexibility requires that some intermediate and peaking units be kept online at all times even if these plants have relatively higher costs of generation. Due to the features of the electric grid, the manner in which changes in demand are met depends on the length of the event. Short-term events, such as the peak in daily load that usually occurs in the afternoon, will be met by intermediate or peaking with fast ramp rates. In contrast, longer-term events, such as a stretch of cold weather, can be met by the oper-
6
ation of intermediate or baseload plants with slower ramp rates that come online because they anticipate there will be consistent demand for their generation. The overall complexity of the grid poses challenges for estimating emissions factors through engineering models13 of the dispatch curve because it requires precise knowledge about a large number of factors for each plant (variable costs, start-up costs, ramp rates, etc.) as well as assumptions on the behavior of system operators, plant operators, or households. In contrast, a regression framework such as the one employed in the present study, does not require knowledge of all these factors because emissions factors are based on observed behavior. In the present paper, the analysis evaluates how the power system responds to actual changes in demand for space cooling and heating based on observed operating data and weather events.
3 Data and Methods 3.1 Data The analysis is based on data on weather, generation, and emissions. Weather data were obtained from the National Oceanic and Atmospheric Administration (NOAA) Monthly Surface Data and consist of monthly cooling degree days and heating degree days for each state. Cooling degree days (CDDs) and heating degree days (HDDs) are the standard measures used in energy analyses for daily space heating and space cooling demand, respectively. For an individual day, cooling degree days are calculated by taking the average of the daily high and low temperatures and subtracting 65. Heating degree days are calculated by subtracting the average of the daily high and low temperatures from 65. For both CDDs and HDDs, any negative values from the above calculation are set equal to zero. For example, a day with a
7
high of 100 and low of 70 would have 0 HDDs and 20 CDDs. A day with a high of 40 and low of 20 would have 35 HDDs and 0 CDDs. Monthly HDDs and CDDs reflect the sum of HDDs and CDDs over all days in the month. Data on generation and emissions were obtained from the Environmental Protection Agency’s (EPA) Continuous Emissions Monitoring System (CEMS). The data include daily generator-level information on the amount of electricity generated, as well as CO2 , SO2 , and NOX emissions. Each generator was linked to its primarily fossil fuel category (coal, oil, or natural gas) using data from the Environmental Protection Agency’s (EPA) eGrid database. More details on this merger, and other data management steps, are provided in the Supporting Information. Both datasets are spatially aggregated such that each observation corresponds to a North American Electric Reliability Corporation (NERC) region and a month. NERC regions are a common unit of analysis in studies of the electricity industry6,14−15 because aggregation limits modeling complications that exist due to trading of electricity within regions (trading is discussed further in section 3.2). A map of NERC regions is displayed in Figure 1. After aggregation, HDDs and CDDs report the population-weighted mean level of CDDs and HDDs among the states that are represented in each NERC region. In order to aggregate the CEMS data, each generator is linked to a NERC region using databases from eGrid and CEMS. I discuss issues related to aggregation further in the methods section. The CEMS only reports data from United States fossil-fuel generators that have a capacity of at least 25 MW and therefore do not reflect generation from hydropower, nuclear energy, renewable sources or small-scale fossil-fueled power plants. As with previous research on emissions factors,6,7 the analysis in this paper is based on the assumption that sources of power that are not included in the data are unlikely to be problematic because they are
8
not substantially responsive to changes in demand. Nuclear, renewables, and run-of-river hydropower are generally not responsive to demand because they are not able to be flexibly dispatched. Hydropower plants with reservoirs are responsive to demand in the short-term, but are more limited over longer periods because the energy available for generation is constrained by the seasonal water flow. Small-scale generators are unlikely to be significant because many are combined heat and power generators, and because they make up only 0.2% to 2.8% of demand across NERC regions.6 Additionally, while some NERC regions include portions of Canada, net generation from Canada comprises less than 1 percent of total generation in the United States,3 and this electricity is normally transmitted over large direct current lines that are at capacity and thus unresponsive to changes in demand. All datasets are merged by NERC region and year. The final dataset consists of a panel that includes information on CDDs, HDDs, generation, and emissions across eight NERC regions for every month from 2006-2013. There are 768 observations. As a final step, because the analysis is focused on demand, gross generation is converted to net transmitted generation. Following Graff Zivin et al., gross generation is converted to net transmitted generation by dividing gross generation by 1.0459 and 1.096. The 1.0459 figure adjusts for on-site consumption and the 1.096 figure adjusts for losses from transmission and distribution.7 Summary statistics are reported in Table 2. The mean generation amount is about 25 billion kWh. The mean amount of CDDs is 138 and the mean HDDs is 341. Forty-nine billion lbs. of CO2 are emitted in the typical month. The average SO2 and NOX emissions 121 million lbs. and 48 million lbs., respectively. Table 3 displays regional difference in CO2 emissions rates. The Midwest (MRO), the mid-Atlantic (RFC), the Southeast (SERC), and the Central Plains (SPP) have relatively high rates due to high use of coal. Texas (TRE), Florida (FRCC), and the West (WECC) have modest
9
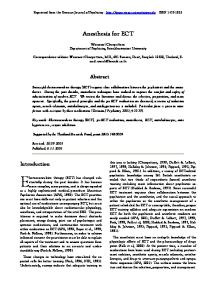
rates because a substantial share of their generation comes from natural gas. The Northeast (NPCC) has the lowest rates due to the amount of natural gas it uses. Only FRCC and NPCC have non-trivial amounts of generation from oil. Figure 2 displays seasonal patterns in the generation mix across NERC regions. Eachshaded region represents the average generation amount from a specific fuel source for the corresponding month. The dark-shaded region represents coal, the light-gray region represents oil, and the medium-gray represents natural gas. All regions display seasonal trends, with relative increases in total generation occurring in the winter and summer months. The extent of the increases varies by region and is most noticeable in the summer months for states with more CDDs and in the winter months for states with more HDDs (see Figure S.1 in the Supporting Information for seasonal trends in CDDs and HDDs in each NERC region). Note that while natural gas is conventionally considered to be the marginal fuel source in most regions, both coal and gas-fired generation are responsive to the seasonal changes in demand in most regions.
3.2 Methods Emissions factors for space cooling and space heating are estimated using a two-stage procedure based on month-to-month changes in generation and emissions. Two-stage regression procedures provide an estimate of the local average treatment effect.16 In general, the local average treatment effect can be interpreted as the effect of an independent variable on the dependent variable, when the change in the independent variable is induced specifically by a third variable (the “instrumental variable”). In the models employed in this paper, the impact of generation on emissions is examined using either CDDs or HDDs as the instrumental variable for generation. As such, the two-stage procedure produces an estimate
10
of the change in emissions caused by a one kWh increase in net transmitted generation, when the increase in generation is induced by cooling demand or heating demand. Intuitively, the two-stage procedure is a framework for exploiting naturally occurring fluctuations in weather to evaluate the manner in which electricity is generated to meet cooling and heating-induced demand, and the procedure produces estimates of emissions factors that are specific the end-uses of space cooling and heating. Separate regressions are performed for each NERC region, and emissions factors for cooling and heating are estimated in separate specifications. The first-stage regression takes the following general form.
∆Generationt = α + γ1 ∆CDDt + γ2 ∆HDDt + ωt + ².
(1)
where ωt represents a vector of dummy variables corresponding to calendar months. For cooling, the second stage regression is based on the following specification.
ˆ ∆Emissionst = α + β1 ∆Generation t + β2 ∆HDDt + ωt + ²,
(2)
ˆ where ∆Generation t is the predicted value from the first-stage. The coefficient of primary interest is β1 , which provides an estimate of the space cooling emissions factor. An analogous second-stage estimate is performed for heating, with the exception being that HDD is replaced by CDD in equation 2. The intercept, α, controls for deterministic trends in emissions levels and the calendar month dummy variables are included to control for seasonal patterns in generation that are correlated with cooling and heating, but may be driven by different end-uses, such as increased lighting needs during the winter months. By focusing on variation that is induced by weather-related events, the emissions factors specifically
11
represent the emissions produced for cooling and heating end-uses. Examining period-to-period changes represents a "first difference" approach, which is superior to a fixed effects estimation in this setting because regressions based on first differencing are less sensitive to serial correlation in unobservables. To further adjust for serial correlation, Newey-West standard errors are calculated based on a two-month lag. The standards errors are not substantially impacted by adjustments in the choice of lag period. Estimates of the overall emissions factor for each region based on monthly variation in electricity generation are also produced, and these estimates are based on a regression model of the following form:
∆Emissionst = α + β3 ∆Generationt + ωt + ².
(3)
The methods applied for estimating overall emissions factors are similar in many regards to the methods employed by Siler-Evans et al. and Graff Zivin et al.6−7 One notable exception is that the data are aggregated temporally to the monthly level, as opposed to hourly. Estimates based on disaggregated hourly data are useful primarily for identifying changes that occur through generators that fluctuate their generation levels at the hourly level. However, estimates based on data aggregated to the monthly level additionally capture a set of generator responses that occur over non-hourly time spans, such as changes brought about by a plant with relatively high start-up or shut-down costs choosing to come on-line for a prolonged period in anticipation of increased demand, or to go off-line for a prolonged period in anticipation of reduced demand. This type of response may be particularly important in the context of cooling and heating demand because weather forecasts allow plant operators to anticipate changes in demand for heating or cooling in advance. For example, when the weather is forecast to be cooler during a summer month, certain plants may shut-down 12
for several days because they do not anticipate that there will be sufficient demand for their product. The use of monthly data captures this response whereas hourly data will not. While some degree of aggregation is appropriate, the precise level of aggregation is somewhat subjective. In order to evaluate the sensitivity of the analysis to different levels of aggregation, estimates based on weekly and bi-weekly aggregations are also presented in the results. As mentioned earlier, the data are spatially aggregated to the NERC level. This approach is common in previous studies, however one weakness with this approach is that it does not account for the potential impact of trading of electricity across NERC regions on emissions factors. Graff Zivin et al. account for trading by aggregating spatially to the interconnection level and simultaneously estimating demand factors for all NERC regions in the Eastern interconnection.7 This approach cannot be implemented in the present study due primarily to weakened statistical power because of the correlations in weather patterns in the Eastern interconnection. However, this issue should not substantially bias the relative comparison of the coefficients so long as trading across NERC regions follows similar patterns during cooling and heating months. Additionally, as with other existing studies that use a regression-based approach to estimate emissions factors, the analysis only considers emissions produced directly in the generation of electricity. Emissions that occur through the extraction and processing of inputs for electricity generation can influence the overall emissions levels associated with electricity generation as well. Perhaps most relevantly, methane leaks from natural gas extraction can influence the emissions associated with natural-gas-fired generation. Incorporating these emissions into the current estimates is difficult at present due to the uncertainty about the extent of methane leakage.17 It is also arguable that evaluations of electricity policies should focus exclusively on emissions produced during the generation process. Other
13
types of policies are more appropriate for emissions at other stages of the life-cycle. For example, more stringent regulations of natural gas development could be used to limit release of methane during extraction. This type of regulation appears to be likely to be forthcoming because commercially-viable technologies to limit the extent of methane leakage during natural gas extraction already exist.18
4 Results Table 4 reports estimates of emissions factors for CO2 . Cross-referencing with Figure 2 is helpful when explaining the results because changes in the primary fuel source used for generation have a strong impact on the emissions rate. Across all regions, heating is associated with an equal or greater emissions factor than cooling. Emissions for cooling are lower in summer because the peak in demand brings the most costly generators online, which tend to be gas-fired and have lower emissions. The difference between cooling and heating emissions factors is most prominent in NPCC. Figure 2 shows that the primary source fuel used to meet the increase in demand during months with high cooling needs is natural gas. In contrast, coal, natural gas, and oil-fired generation all appear to aid substantially in meeting the increase in demand during months with high heating needs. The difference between the cooling and heating emissions factors is lowest in WECC, and this is likely due to both heating and cooling induced demand being met almost exclusively by gas-fired generators, which is reflected in the low emissions factor for both end-uses. Based on a 10 percent level of statistical significance, the space cooling and space heating emissions factor are only significantly different in FRCC, MRO, and NPCC. The first-stage results, which are of lesser direct importance, show that CDDs and HDDs are both strong predictors of electricity usage. Coefficients vary in magnitude across 14
NERC regions because of differences in population, the number of residences with airconditioning, and the number of residences with electric heating. Higher levels of any of the preceding factors will lead to higher first-stage coefficients. Note that while cooling and heating emissions factors are estimated in separate two-stage regressions, both of these regressions involve the same first-stage regression (and the results from this first-stage model are only reported once in the table). The models differ in the second stage, however. Estimates of the emissions factor for cooling control directly for HDDs in the second stage, whereas estimates of the emissions factor for heating control directly for CDDs in the second stage. Overall emissions factors are reported at the bottom of Table 4. These estimates capture the average response to cooling or heating related shocks, as well as to other shocks unrelated to either cooling or heating (e.g. economic shocks). In most regions the overall emissions factor is either similar to the heating or cooling emissions factors or higher. The primary explanation for the lower emissions factors for heating and cooling is that heating and cooling demand tends to occur at periods of relatively greater demand (in comparisons to months with mild temperatures), and therefore is more likely to be supplied by gas-fired intermediate plants that are further out on the dispatch curve and that have lower emissions. In order to investigate the sensitivity of the estimates, I examine how the results change when the level of temporal aggregation changes. Estimates based on weekly aggregation are presented in Table S.1 in the Supporting Information. These estimates are based on specifications that are similar to the ones originally described in equations 1-3 except the vector of calendar month dummy variables is replaced with a vector of calendar week dummy variables. The results are quite similar to those presented in Table 4. FRCC, MRO, and NPCC
15
remain the three regions with significant differences in their emissions factors. Estimates based on bi-monthly aggregation are also similar and are presented in Table S.2 in the Supporting Information. I further evaluate the sensitivity of the analysis by evaluating whether emissions factors change substantially if the sample is limited to more recent years in the data. This robustness check is helpful because more recent years are more likely to be good predictors of future years, especially because natural gas prices have dropped significantly in recent years and the price of natural gas strongly influences the extent to which natural gas is used for generation. Table S.3 in the Supporting Information reports results from observations that occurred from 2010 to 2013. As above, the results are generally similar to those reported in Table 4. On net, the preferred estimates remain those reported in Table 4 because the monthly aggregation is helpful in detecting a broad variety of responses and because the longer sample period allows for more precise estimates. The stability of the estimates, especially in terms of relative comparisons across cooling, heating, and overall emissions factors is reassuring, but it will of course be important for future research to continue to investigate emissions factors due to the dynamic nature of the electric system. Although the CO2 emissions factors are mostly insensitive to the different aggregation levels examined in this paper, it is worth noting that the overall emissions factors reported in Table 4 are generally larger than those in the literature that are based on hourly-level data.6,7,19−20 The likely explanation is that analyses based on hourly data are primarily based on variation from plants that are most likely to change their generation on an hourly basis. These plants are typically gas-fired plants with high ramp rates and low emissions rates. As described earlier, the estimates that are presented in this paper that are based on more aggregated data will capture a broader set of changes in generation patterns, including re-
16
sponses from plants with lower ramp rates and often times higher emissions rates. Estimates for SO2 and NO X are presented in Tables 5 and 6, respectively. Estimates for SO2 and NOX generally have substantially larger standard errors because there is more variation in the emissions rate for these pollutants across generators of similar fuel types due to the use of mitigation technologies that were motivated by the emissions caps on SO2 and NOX . Despite the larger standard errors, there is still clear evidence that heating end-uses are associated with greater emissions rates of both types of pollutants in NPCC. Part of the reason that the SO2 and NOX estimates are noisier and perhaps of more secondary importance is because binding caps have been implemented at times for both of these pollutants in recent years. If a binding cap is present, changes in demand may have zero impact on overall emissions levels.
5 Discussion and Conclusions The design and effectiveness of energy policies that seek to limit energy-related pollutants is complicated by the complexity of the electricity system. Due to variation in the way electricity is generated, the amount of emissions that are eliminated by a reduction in demand depends on the specific manner in which demand is reduced. Electricity generated during the middle of the night in the winter is may be generated in a different manner than electricity generated in the middle of the day in the summer. Most policies target a set or subset of end-uses, and each end-use is likely to be associated with a unique demand pattern and a different emissions factor. This paper provides the first set of emissions factors that are estimated for specific enduses. In particular, emissions factors are estimated for space cooling and space heating, which are two significant residential end-uses, and which have been targeted by policymak17
ers through both appliance standards and building energy codes. These policies appear to be likely to continue to play a major role in U.S. energy policy. The EIA has recently projected that increases in the stringency of energy codes and appliance standards can lead to a 1.5 quadrillion Btu decrease in delivered energy to buildings by 2035. After translating this figure to primary energy, it exceeds the projected savings from the recently announced increase in the stringency of CAFE standards.21 There are substantial differences in the estimated emissions factors for space cooling and heating in the Northeast and Midwest. Given the externalities associated with electricity consumption, biases in emissions factors can lead to substantial difference in the evaluation of policy outcomes in these regions. For example, assuming a social cost of carbon of $36, the carbon-related benefits from a 10 percent reduction in residential electricity consumption that was achieved by reducing electrical space heating would be understated by approximately $50 million dollars per annum if the overall emissions factor in the northeast was used for the analysis as opposed to the space heating emissions factor. In contrast, the difference between the emissions factors is small in the Mid-Atlantic, the West Coast, the Southeast, Texas, and the Central Plains, and the cooling and heating emissions factors in these regions also tend to be close to the estimated overall emissions factor. The substantially different demand profiles between cooling and heating and the lack of a sizable difference in emissions factors suggest that the use of a single regional emissions factor in policy analyses for these areas is more reasonable. Analysts using these emissions factors should be aware of the complexity of different energy policies. For example, investments in insulation may lead to reduced electricity for space heating and also less use of natural gas in natural gas furnaces. The present set of emissions factors are only applicable for changes in electricity generation. If contemporane-
18
ous changes occur in direct consumption of natural gas or fuel oil, they should be evaluated through a separate analysis. Lastly, it should be noted that pollution control is not the only objective in most energy policies, and other factors like economic costs and energy security are considered in the design of policies, as they should be. For example, the result that heating tends to be associated with greater emissions factor than cooling does not imply that policies should preferentially target conservation of heating-related electricity because conservation of heating-related electricity may be less correlated with other policy objectives, such as reducing peak demand. However, optimal policy design requires that policymakers have full information about the impacts of a policy. This paper has improved the information available to policymakers by providing the first set of end-use specific emissions factors for cooling and heating. Future research on emissions factors for other end-uses will further aid in creating more precise policy analyses and recommendations. Continued use of regression-based methodologies, such as the one presented in the present study, can aid in developing a richer set of emissions factors, as well as in evaluating the performance of studies based on alternative methodologies.
Supporting Information Available. This information is available free of charge via the Internet at http://pubs.acs.org/.
19
References (1) Inventory of U.S. Greenhouse Gas Emissions and Sinks: 1990-2012.; EPA 430-R-14-003; United States Environmental Protection Agency: Washington, DC, 2014. (2) Technical Update of the Social Cost of Carbon for Regulatory Impact Analysis Under Executive Order 12866; Interagency Working Group on Social Cost of Carbon, United States Government: Washington, DC, 2007. (3) Weber, C.L., J. Paulina, J. Marriott, and C. Samaras. Life Cycle Assessment and Grid Electricity, Environmental Science & Technology 2010 44, 1895-1901. (4) Jacobsen, G.D., and M.J. Kotchen. Are Building Codes Effective at Saving Energy? Evidence from Residential Billing Data in Florida, Review of Economics and Statistics 2013 95, 34-49. (5) Jacobsen, G. D. Improving Energy Codes. Energy Journal 2014, in press. (6) Siler-Evans, K., I.L. Azevedo, and M.G. Morgan. Marginal Emissions Factors for the U.S. Electricity System, Environmental Science & Technology 2012 46, 4742-4748. (7) Graff Zivin, J., M. J. Kotchen, and E. T. Mansur. Spatial and Temporal Heterogeneity of Marginal Emissions: Implications for Electric Cars and Other Electricity-Shifting Policies. Journal of Economic Behavior and Organization 2014, in press. (8) Cullen, J. A.. Measuring the Environmental Benefits of Wind Generated Electricity, American Economic Journal: Economic Policy 2013 5(4), 107-33. (9) Kaffine, D. T., J. M. Brannin, and J. Lieskovskyx. Emissions savings from wind power generation in Texas, The Energy Journal 2013 34(1), 155-175. (10) Novan, K. Valuing the Wind: Renewable Energy Policies and Air Pollution Avoided. Working Paper, University of California, San Diego, CA, 2012. (11) The U.S. EPA’s Emissions & Generation Resource Integrated Database. United States Environmental Protection Agency: Washington, www.epa.gov/egrid.
DC, 2010;
(12) Kumar, N., P. M. Besuner, S. A. Lefton, D. D. Agan, D. D., Hilleman. Power Plant Cycling Costs. AES No. 12047831-2-1, Prepared for National Renewable Energy Laboratory, Golden, CO, 2012. (13) Broekhoff, D. Guidelines for Quantifying GHG Reductions from Grid-Connected Electricity Projects. Technical report, World Resources Institute: Washington, DC, 2007. (14) The National Energy Modeling System: An Overview; DOE/EIA-0581; U.S. Energy Information Administration: Washington, DC, 2003. (15) Paul, A. and D. Burtraw. The RFF Haiku Electricity Market. Working Paper, Resources for the Future, Washington, DC, 2002. (16) Imbens, G. W. and J. D. Angrist. Identification and Estimation of Local Average Treatment Effects, Econometrica 1994 62(2), 467-475. 20
(17) Miller, S. M. et al. Anthropogenic emissions of methane in the United States, Proceedings of the National Academy of Sciences 2013 110(50), 20018-20022. (18) Harvey, S., V. Gowrishankar, and T. Singer. Leaking Profits. Report, Natural Resources Defense Council, Washington, DC, 2012. (19) Carson, R. T. and K. Novan. The private and social economics of bulk electricity storage. Journal of Environmental Economics and Management 2013 66, 404-423. (20) Holladay, J. S. and J. LaRiviere. How Does Welfare from Non-Pecuniary Policies Vary with Market Prices? Evidence from Fracking, Natural Gas and Emissions from Electricity Generation. Working Paper, University of Tennessee, Knoxville, TN, 2014. (21) Annual Energy Outlook 2012; United States Department of Energy, Energy Information Administration: Washington, DC, 2012. (22) Buildings Energy Databook; Table 2.1.5; United States Department of Energy: Washington, DC, 2013; http://buildingsdatabook.eren.doe.gov.
Figures and Tables for Main Text
Figure 1: North American Electric Reliability Corporation (NERC) Regions. Source: 2010 NERC Electricity Supply and Demand Database.
21
Table 1: Residential Electricity Consumption by EndUse End-Use Space Cooling Lighting Other Refrigeration Electronics Space Heating
Percent 21.19% 20.75% 9.82% 9.27% 8.94% 7.95%
End-Use Ventilation Water Heating Computers Wet Cleaning Cooking
Percent 5.96% 5.96% 4.19% 3.64% 2.32%
Notes: The data source is the U.S. DOE.22
Table 2: Summary Statistics of Generation, CDDs, HDDs, and Emissions - 2006-2013 Variable Generation (Million MWh) Cooling Degree Days (CDD) Heating Degree Days (HDD) CO2 Emissions (Billion lbs) SO2 Emissions (Million lbs) NOX Emissions (Million lbs) Calendar Month Year
Mean 24.84 138.42 340.93 49.05 121.68 48.93 -
St. Dev. 17.07 174.28 383.62 36.22 157.38 44.89 -
Min. 6.92 0.00 0.00 8.23 1.04 1.84 1 2006
Max. 76.75 750.00 1717.59 156.87 768.57 231.69 12 2013
Notes: Data sources are the National Oceanic and Atmospheric Administration Monthly Surface Data and the Environmental Protection Agency’s Continuous Emissions Monitoring System. The generation measure is corrected for on-site consumption and transmission and distribution losses such that it represents net transmitted generation. The unit of observation is a NERC region and a month. There are 768 observations.
Table 3: CO2 Emissions Rate and Fuel Sources Used for Generation by Region NERC Region FRCC MRO NPCC RFC SERC SPP TRE WECC
CO2 Rate (lbs/kWh) 1.69 2.40 1.44 2.13 2.04 2.10 1.79 1.77
Coal Share
Oil Share
nGas Share
33.7% 94.6% 21.3% 89.0% 78.3% 74.2% 48.8% 53.8%
4.6% 0.0% 1.9% 0.2% 0.0% 0.0% 0.2% 0.0%
61.8% 5.4% 76.8% 10.8% 21.7% 25.8% 51.0% 46.2%
Notes: CO2 rate refers to the overall rate of carbon emissions across all fossil-fuel based generation. The third through fifth column report the share of fossil-fuel generation from generators with the corresponding primary fuel source.
22
(2.7) TRE
23 Dec
Nov
Oct
Sep
Aug
Jul
Jun
May
0
0
Million MWh 10 20 30
Million MWh 10 20
40
30
(2.4) RFC
Apr
Mar
Feb
Jan
Dec
Nov
Oct
Sep
Aug
Jul
Jun
May
Apr
Mar
Feb
Jan
(2.5) SERC
Million MWh 40 60
20
80
80
Aug
Jul
Jun
May
Apr
Mar
Feb
Jan
Dec
Nov
Oct
Sep
Aug
Jul
Jun
May
Apr
Mar
Feb
Jan
Dec
Nov
Oct
Sep
Aug
Jul
Jun
May
Apr
Mar
Feb
Jan
Oct Nov Dec
Oct Nov Dec
Sep
Million MWh 5 10 15
Million MWh 20 40 60
20
(2.3) NPCC
Sep
Aug
Jul
Jun
May
0
0
0
(2.2) MRO
Apr
Mar
Feb
Jan
Dec
Nov
Oct
Sep
Aug
Jul
Jun
May
Apr
Mar
Feb
Jan
Dec
Nov
Oct
Sep
Aug
Jul
Jun
May
Apr
Mar
Feb
Jan
(2.1) FRCC
(2.6) SPP
(2.8) WECC
Figure 2: Generation Source by Month for each NERC Region. The dark-shaded region represents coal, the light-gray region represents oil, and the medium-gray represents natural gas. 0
0
0
5
Million MWh 5 10
Million MWh 5 10
Million MWh 10 15
15
15
20
Table 4: Estimates of CO2 Emissions Factors (lbs. per kWh) Instrumental Variable Results Space Cooling Emissions Factor R-Squared Space Heating Emissions Factor R-Squared p-value (βCOOL = βH E AT ) First Stage CDD / 10 HDD / 10 F-Stat Ordinary Least Squares Overall Emissions Factor R-Squared
FRCC
MRO
NPCC
RFC
SERC
SPP
TRE
WECC
1.69 (0.08) 0.980
1.74 (0.08) 0.992
1.54 (0.04) 0.988
1.90 (0.05) 0.994
1.73 (0.06) 0.994
1.52 (0.07) 0.987
1.36 (0.09) 0.975
1.32 (0.05) 0.986
1.81 (0.07) 0.978
2.06 (0.09) 0.996
1.85 (0.17) 0.983
1.99 (0.06) 0.995
1.84 (0.06) 0.994
1.60 (0.15) 0.988
1.43 (0.11) 0.975
1.25 (0.18) 0.986
0.073
0.016
0.061
0.188
0.143
0.668
0.596
0.649
0.14 (0.01) 0.15 (0.01) 136.16
0.12 (0.02) 0.02 (0.00) 70.70
0.23 (0.02) 0.03 (0.01) 338.39
0.58 (0.04) 0.12 (0.02) 118.93
0.60 (0.04) 0.30 (0.03) 169.18
0.12 (0.01) 0.04 (0.01) 310.64
0.20 (0.02) 0.14 (0.01) 204.83
0.44 (0.04) 0.10 (0.02) 54.20
1.66 (0.07) 0.979
2.06 (0.06) 0.995
1.54 (0.04) 0.987
1.97 (0.04) 0.995
1.79 (0.04) 0.994
1.61 (0.06) 0.988
1.42 (0.07) 0.975
1.34 (0.05) 0.986
Notes: The space cooling emissions factor is estimated by two-stage least squares (2SLS) using CDD as an instrument for generation. The space heating emissions factor is estimated by two-stage least squares (2SLS) using HDD as an instrument for generation. The overall emissions factor is estimated using ordinary least squares. Models are estimated separately for each NERC region. The unit of observation is a NERC region and a month. Each regression is based on 95 observations. Newey-West standard errors based on a two-month lag are reported in parentheses.
24
Table 5: Estimates of SO2 Emissions Factors (lbs. per MWh) Instrumental Variable Results Space Cooling Emissions Factor R-Squared Space Heating Emissions Factor R-Squared p-value (βCOOL = βH E AT ) First Stage CDD / 10 HDD / 10 F-Stat Ordinary Least Squares Overall Emissions Factor R-Squared
FRCC
MRO
NPCC
RFC
SERC
SPP
TRE
WECC
3.63 (0.60) 0.695
3.94 (0.75) 0.906
1.81 (0.53) 0.755
7.28 (1.24) 0.853
4.79 (0.77) 0.884
1.84 (0.53) 0.816
0.20 (0.50) 0.706
0.21 (0.21) 0.732
4.19 (0.47) 0.698
4.23 (1.13) 0.904
5.33 (1.67) 0.708
9.61 (1.61) 0.858
4.67 (0.69) 0.884
2.13 (1.10) 0.818
0.61 (0.49) 0.715
0.71 (0.38) 0.744
0.207
0.809
0.029
0.191
0.888
0.812
0.465
0.210
0.14 (0.01) 0.15 (0.01) 136.16
0.12 (0.02) 0.02 (0.00) 70.70
0.23 (0.02) 0.03 (0.01) 338.39
0.58 (0.04) 0.12 (0.02) 118.93
0.60 (0.04) 0.30 (0.03) 169.18
0.12 (0.01) 0.04 (0.01) 310.64
0.20 (0.02) 0.14 (0.01) 204.83
0.44 (0.04) 0.10 (0.02) 54.20
4.12 (0.50) 0.694
3.66 (0.43) 0.906
2.37 (0.50) 0.732
8.33 (0.99) 0.853
4.82 (0.41) 0.884
2.23 (0.47) 0.817
0.77 (0.32) 0.713
0.45 (0.15) 0.738
Notes: The space cooling emissions factor is estimated by two-stage least squares (2SLS) using CDD as an instrument for generation. The space heating emissions factor is estimated by two-stage least squares (2SLS) using HDD as an instrument for generation. The overall emissions factor is estimated using ordinary least squares. Models are estimated separately for each NERC region. The unit of observation is a NERC region and a month. Each regression is based on 95 observations. Newey-West standard errors based on a two-month lag are reported in parentheses.
25
Table 6: Estimates of NOX Emissions Factors (lbs. per MWh) Instrumental Variable Results Space Cooling Emissions Factor R-Squared Space Heating Emissions Factor R-Squared p-value (βCOOL = βH E AT ) First Stage CDD / 10 HDD / 10 F-Stat Ordinary Least Squares Overall Emissions Factor R-Squared
FRCC
MRO
NPCC
RFC
SERC
SPP
TRE
WECC
1.99 (0.31) 0.740
1.66 (0.25) 0.899
1.11 (0.10) 0.886
2.54 (0.64) 0.483
2.21 (0.58) 0.463
1.88 (0.26) 0.933
0.64 (0.16) 0.841
0.69 (0.18) 0.852
1.98 (0.20) 0.740
2.32 (0.53) 0.897
1.67 (0.37) 0.860
1.32 (1.43) 0.463
1.46 (0.45) 0.462
2.47 (0.45) 0.930
0.94 (0.18) 0.825
0.92 (0.51) 0.854
0.965
0.218
0.100
0.519
0.341
0.288
0.279
0.634
0.14 (0.01) 0.15 (0.01) 136.16
0.12 (0.02) 0.02 (0.00) 70.70
0.23 (0.02) 0.03 (0.01) 338.39
0.58 (0.04) 0.12 (0.02) 118.93
0.60 (0.04) 0.30 (0.03) 169.18
0.12 (0.01) 0.04 (0.01) 310.64
0.20 (0.02) 0.14 (0.01) 204.83
0.44 (0.04) 0.10 (0.02) 54.20
1.96 (0.23) 0.740
1.85 (0.22) 0.898
1.13 (0.09) 0.879
3.10 (0.65) 0.483
1.86 (0.32) 0.458
1.88 (0.18) 0.932
0.64 (0.09) 0.833
0.82 (0.14) 0.853
Notes: The space cooling emissions factor is estimated by two-stage least squares (2SLS) using CDD as an instrument for generation. The space heating emissions factor is estimated by two-stage least squares (2SLS) using HDD as an instrument for generation. The overall emissions factor is estimated using ordinary least squares. Models are estimated separately for each NERC region. The unit of observation is a NERC region and a month. Each regression is based on 95 observations. Newey-West standard errors based on a two-month lag are reported in parentheses.
26