Epitomized Summarization of Wireless Capsule Endoscopic Videos for Efficient Visualization Xinqi Chu1,5 , Chee Khun Poh1 , Liyuan Li1 , Kap Luk Chan2 , Shuicheng Yan3 , Weijia Shen1 , That Mon Htwe1 , Jiang Liu1 , Joo Hwee Lim1 , Eng Hui Ong4 , and Khek Yu Ho4 1
4
Institute for Infocomm Research, Singapore {xchu,ckpoh,lyli}@i2r.a-star.edu.sg 2 Nanyang Technological University, Singapore 3 National University of Singapore, Singapore Dept of Gastroenterology & Hepatology, National University Hospital, Singapore 5 University of Illinois at Urbana-Champaign, USA
Abstract. A video recording of an examination by Wireless Capsule Endoscopy (WCE) may typically contain more than 55,000 video frames, which makes the manual visual screening by an experienced gastroenterologist a highly time-consuming task. In this paper, we propose a novel method of epitomized summarization of WCE videos for efficient visualization to a gastroenterologist. For each short sequence of a WCE video, an epitomized frame is generated. New constraints are introduced into the epitome formulation to achieve the necessary visual quality for manual examination, and an EM algorithm for learning the epitome is derived. First, the local context weights are introduced to generate the epitomized frame. The epitomized frame preserves the appearance of all the input patches from the frames of the short sequence. Furthermore, by introducing spatial distributions for semantic interpretation of image patches in our epitome formulation, we show that it also provides a framework to facilitate the semantic description of visual features to generate organized visual summarization of WCE video, where the patches in different positions correspond to different semantic information. Our experiments on real WCE videos show that, using epitomized summarization, the number of frames have to be examined by the gastroenterologist can be reduced to less than one-tenth of the original frames in the video.
1
Introduction
In the early beginning of this century, Wireless Capsule Endoscopy (WCE) was introduced for the examination of the gastrointestinal tract, especially the small intestine where the conventional endoscopy is unable to reach [5]. Wireless capsule endoscopy is a non-invasive imaging technique. It has now changed the way doctors and clinicians performing the examination. The examination is no longer a real-time process as in traditional endoscopy. After the data recording (in the form of a video) is done by the capsule going through the entire gastrointestinal T. Jiang et al. (Eds.): MICCAI 2010, Part II, LNCS 6362, pp. 522–529, 2010. c Springer-Verlag Berlin Heidelberg 2010 �
Epitomized Summarization of Wireless Capsule Endoscopic Videos
523
tract, clinicians have to sit down in front of a computer to review a video containing possibly more than 55,000 frames, and select the frames he or she considers important. This process is very time consuming, requiring full concentration of the gastroenterologists throughout. Existing computational methods on WCE image processing focus on disease detection, e.g. bleeding detection [6, 7, 8, 10, 9, 11] so that gastroenterologists do not need to go through the entire video sequence. However, in actual clinical practice, the gastroenterologist would always like to confirm the detection results generated by the software and not taking any risk of missing something in the WCE examination. This motivates us to explore computational methods that can reduce the time spent in the examination by gastroenterologist. To our knowledge, up to now, the only relevant work to address this problem is by Iakovidis et. al [1]. They proposed an unsupervised summarization method of the WCE video by selecting the most representative images from the video. First, the frames in the whole video are clustered based on symmetric non-negative matrix factorization initialized by the fuzzy c-means algorithm. Then, one or a few representative frames are selected from each cluster. It can reduce the number of frames to be examined down to about 10% compared to the original video. However, such key frame extraction technique would inevitably miss some information in the 90% thrown away frames, even though they are similar to the representative frames in global appearance. In this paper, we propose a novel method of epitomized summarization of the WCE video for efficient visual examination by gastroenterologist. The epitome model can generate a condensed summary of the original video. To ensure the necessary visual quality of the generated epitome for clinical examination, we introduce the constraint for local context preservation. We further introduce the spatial distributions for various semantic interpretations of the local features. Hence, we show that the epitome model can be used to generate semantically organized summarization which is helpful to let the doctor to naturally focus on the important visual information. The most significant benefits of the proposed method are that it produces a highly condensed summarization (less than 10% of original video volume) with almost no loss of visual information and provides a framework to flexibly organize the visual information in the summarization. The rest of the paper is organized as follows. Section 2 describes the epitomized summarization model, i.e. the general formulation, the introduced constraints, and the derived learning algorithm. Section 3 presents the experimental results and quantitative evaluations on real data from the hospital. The conclusions are given in Section 4.
2
Epitomized Summarization
Epitome modeling The epitome model seeks an optimally condensed appearance representation under which all the patches in the input image can be explained from the epitome [4]. It does not take into account the visual quality of the epitome. The
524
X. Chu et al.
patches in the epitome may be distorted and artifacts may be introduced in order to explain different input patches. Also, important features with large local variances conveying higher degree of saliency of the local context may be smoothed out in the epitome. These adversary effects render certain areas in the epitome not recognizable to human, as shown in Fig. 1. In addition, the patches from the images could be placed anywhere in the epitome due to the flat prior of mapping. As a result, the epitome is too cluttered for visual examination by human. We introduce the constraints for local context preservation and semantic organization to generate the epitomized summarization of high visual quality for visualization. To generate the epitomized summarization of a short sequence, we extend the image epitome [3] to learn the epitome from a set of N input image frames {In }N n=1 . The learning algorithm compiles a large number of patches drawn from these training images. Similar to [2, 3], the epitome model is formulated as a specified generative model. Let {Znk }P k=1 be a set of P patches from the image In . Each patch Znk contains pixels from a subset of image coordinates Snk in In . For each patch Znk , the generative model uses a set of hidden mapping Tnk from the epitome e to the coordinates i ∈ Snk in In . Given the epitome e = (μ,φ) and mapping Tnk , a patch is generated by copying the corresponding pixels from the epitome mean and variance map, � N (zi,k,n ; μTnk (i) , φTnk (i) ) (1) p(Znk |Tnk , e) = i∈Snk
where coordinate i is defined on the input image. Under this generative model, it is assumed that each patch from every image is generated independently. The joint distribution is: N p({{Znk , Tnk }P k=1 }n=1 , e) = p(e)
N � P � n=1 k=1
p(Tnk )wnk
�
N (zi,k,n ; μTnk (i) , φTnk (i) )
i∈Snk
(2) where p(e) = const, wnk is introduced for local context preservation, and Gaussian-like spatial distributions for p(Tnk ) are used for semantic organization of visual features in the epitome. Local context preservation In many cases, distinctive local contexts contain significant local variation and often occupy small parts in the WCE images. To preserve the visual quality of distinctive local contexts in the epitomized summarization, a patch weight is introduced which favors the patch containing rich local context, i.e. having large 2 ), where f () is an local variance. The patch weight is defined as wnk = f (σZ nk increasing function of the variance. In this paper, a sigmoid function is used � �−1 2 wnk = 1 + exp{−38(σZ − 0.1)} + 0.003 (3) nk The effect of patch weight on the learning of the epitome from WCE images is shown in Fig. 1. Since the smooth parts of the normal tissues are abundant, more
Epitomized Summarization of Wireless Capsule Endoscopic Videos
525
Fig. 1. The epitomes learnt from a sequence of 10 consecutive image frames. The left 10 images are the original frames with size of 288×288 pixels. The right two images are the enlarged epitome images. The epitome size is 200×200 pixels. The first epitome is generated by existing epitome formulation, and the second is the epitomized summarization generated by proposed method. The first epitome is too cluttered for human interpretation. In the second epitome, one can find the fine details in the regions of normal tissues from all the original frames.
details of rich context from all the 10 frames are learnt and placed in the region for normal tissues in the epitomized summarization. Semantic Organization A number of techniques for WCE image classification have been developed in the past decade. Even though the accuracy of the classification is not perfect, but if the semantic information of the classification can be integrated in the WCE summarization, it will be helpful for doctors to interpret the WCE videos. In this work, we trained a Neural Network (NN) to classify each patch as one of three categories: Normal tissues, Non-informative contents (i.e. bubbles, fluids, and feces), and Suspected tissues (i.e. bleeding, tumor, lesion etc.). In a short sequence, if there are suspected tissues, we would like to place the related patches in the central region of the epitome summarization. The patches of normal tissues and non-informative contents are placed gradually further away from the central area in the epitome. In this way, if there are suspected tissues, it is easy to catch the attention of the gastroenterologist. This arrangement of patches in the summarized epitome according to the semantic attributes is naturally helpful to the gastroenterologist. To implement the semantically organized epitome, we use three spatial distributions for the patches of the three semantic categories, as shown in Figure 2. For an input patch Snk from one image frame of the short sequence, let Tnk (i) be a mapping from the epitome e to the image coordinate i, and T0 be the mapping to the center of the epitome. The prior of the mapping is defined as ⎧
�Tnk (i)−T0 �2 1 ⎪ , if Snk ∈ Suspected tissues ⎪ 2 ⎨ CS exp − σS
�Tnk (i)−T0 �2 1 p(Tnk ) = (4) , if Snk ∈ Normal tissues 2 ⎪ CN exp − σN ⎪ ⎩ 1/|e|, if Snk ∈ Non-informative contents where σS < σN , |e| is the size of the epitome, and CS and CN are normalization constants.
526
X. Chu et al.
−3
x 10 2
Category 1
1.8 1.6 1.4 1.2
Category 2
1
Category 3
0.8 0.6 0.4 0.2 0 100 90 80 70 60 50 40 30 20 10 0
0
10
20
30
40
50
60
70
80
90
100
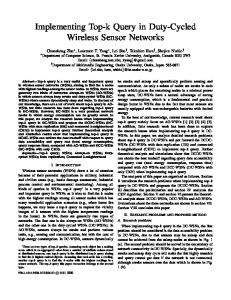
Fig. 2. The spatial distributions of the priors for patches of different semantic categories. The center one is for Suspected tissues, the surrounding one is for Normal tissues, and the flat one is for Non-informative contents.
EM learning The epitomized summarization is generated by learning a generative model. Similar to [3], the variational inference is used to derive a new EM algorithm for the epitome formulation (2). The epitome’s parameters and mapping distributions are estimated by optimizing the log likelihood of the observed patches using the approximate posterior to compute the lower bound on the log likelihood as in [3], we have the following updating equations: In the E-step, the posterior distribution over the hidden mappings Tnk is set to: � q(Tnk ) ∼ p(Tnk )wnk N (zi,n,k ; μ ˆTnk (i) , φˆTnk (i) ) (5) i∈Snk
ˆj and In the M-step, from ∂B/∂μj = 0 and ∂B/∂φj = 0, the epitome mean μ variance φˆj are updated as: �N �P � � zi,n,k 1 �N �M znm + q(Tnk ) n=1 m=1 n=1 k=1 i∈Snk Tnk (i)=j N 2φˆj μ ˆj = �N �P � � q(Tnk ) M+ ˆj n=1 k=1 i∈Snk Tnk (i)=j 2φ (6) �P
�N φˆj =
�
n=1
�
k=1 i∈Snk �N �P � n=1
k=1
Tnk ,Tnk (i)=j
i∈Snk
q(Tnk )(zi,n,k − μ ˆj )2
�
Tnk ,Tnk (i)=j
(7) q(Tnk )
When the EM learning is complete, the epitomized summarization, i.e. the condensed representation of the short sequence, is generated with minimal loss of information.
3
Results
To illustrate and evaluate the performance of epitomized summarization of WCE videos, experiments were conducted on real WCE data from the hospital. In these experiments, two kinds of epitomized summarization were generated and evaluated. The difference between them is the computing of the prior distribution
Epitomized Summarization of Wireless Capsule Endoscopic Videos
527
Fig. 3. Three more examples of learned epitomized summarization. From top to bottom, the examples show the cases of containing bleeding, bubbles, and substantial changes between consecutive frames. From the examples of bleedings, one can find the visual features of bleedings are concentrated and enhanced in the central regions in the semantically organized epitomes.
p(Tnk ). For the normal epitomized summarization, we randomly select a frame from the short sequence to initialize the epitome. That is equivalent to initialize the prior distribution p(Tnk ) with an image frame. So that learnt epitome summarization looks like the frames in the sequence, but not the same as any one of them. For the second type of epitomized summarization, the distributions for semantic descriptions given by (4) are used to generate the semantically organized epitome. When reviewing such epitomes, the doctors may naturally pay more attentions to the suspected tissues appearing in the central region and less attention to the non-informative contents appearing around the margins of the epitome image. Three more examples of normal epitomized summarization (NES) and semantically organized epitome summarization (SOES) are shown in Figure 3. For each row in the figures, the 10 images on the left (in two rows of −3
3.1
x 10
0.022
25.55
0.0215
25.5
0.021
25.45
3.05 3 2.95
0.0205
25.4
0.02
25.35
0.0195
25.3
0.019
25.25
2.9 2.85
5
10
15
20
25
0.0185
5
10
15
20
25
5
10
15
20
25
Fig. 4. The curves of the criteria over the length of the sequence N , where the left one is for ASSD, the middle one is for M SSD, and the right one is for P SN R
528
X. Chu et al.
five columns) are the consecutive frames of the short sequence, and right-most two columns are the learnt NES and SOES. In these examples, the image size is 288×288 pixels, the epitome size is 200×200 pixels, and the patch size for epitome learning is 8×8 pixels. These examples show the visual quality of the epitomized summarization for the cases of bleedings, normal tissues, non-informative contents, and large motion between consecutive frames, etc. To quantitatively evaluate the visual quality of epitomized summarization, three criteria are used. First, for each patch Znk in the images of the sequence, we can find an epitome patch ei which has the smallest difference with the image patch. The loss of the patch can be characterized as the normalized SSD (sum of squared difference): 1 �Znk − ei �22 ei ∈e |ei |
SSDnk = min
(8)
where |ei | is the size of the patch. Based on this, three statistics can be computed as N P 1 �� SSDnk ASSD = N P n=1
(9)
k=1
M SSD = max{SSDnk }k=1:P,n=1:N ∀n,k
M AXI P SN R = 20 log10 √ ASSD
(10) (11)
where ASSD is the average of SSDs for all patches of the image frames from the sequence, M SSD is the maximal SSD for all the patches of the images in the sequence which characterizes the maximum loss, and P SN R is the peak signal-to-noise ratio. We randomly select 50 sequences from the WCE videos of 7 patients, among them, half of the sequences contains various cases of bleedings. Each sequence maximally contains 30 consecutive frames, so that totally 1500 frames are used in the testing. Let N be the length of the short sequences for summarization. Obviously, the larger the N is, the larger the reduction rate (RR = N : 1) is, but the loss of visual information will also increase (i.e. the ASSD will increase and P SN R will decrease). The loss of visual information with respect to the sequence length are evaluated. The curves of ASSD, M SSD and P SN R for N being 5, 10, 15, 20 and 25 are shown in Figure 4. It can be seen that there is no significant change of visual information loss even for N = 25. When N = 15 is used, i.e. at the point of RR = 15 : 1, the criteria values are: ASSD = 0.00297, M SSD = 0.0200, and P SN R = 25.33, which means the visual quality is acceptable for human examination [12]. The evaluation results indicate that, using epitomized summarization, it is possible to reduce the number of images down to less than 10% of the original videos with almost no loss of visual information for human examination.
Epitomized Summarization of Wireless Capsule Endoscopic Videos
4
529
Conclusion
We have proposed a novel approach of epitomized summarization of WCE videos to reduce the time spent on manual review of the recording by gastroenterologist. By introducing the constraints for local context preservation and semantic organization into the existing epitome framework, we show that the epitome technique can not only generate a highly condensed summarization with almost no loss of visual information, but also generated semantically organized visual summarization to naturally capture doctor’s focus on relevant information. Quantitative evaluations have shown that it can reduce the frame number down to less than 10% with almost no loss of information. In our future work, we plan to extend the semantically organized epitome for WCE image registration [13].
References [1] Iakovidis, D.K., Tsevas, S., Maroulis, D., Polydorou, A.: Unsupervised summarisation of capsule endoscopy video. In: 4th International IEEE Conference Intelligent Systems (2008) [2] Cheung, V., Frey, B., Jojic, N.: Video epitomes. In: Proc. IEEE CVPR, pp. 42–49 (2005) [3] Jojic, N., Frey, B., Kannan, A.: Epitomic analysis of appearance and shape. In: Proc. IEEE ICCV, pp. 34–41 (2003) [4] Simakov, D., Caspi, Y., Shechtman, E., Irani, M.: Summarizing visual data using bidirectional similarity. In: Proc. IEEE CVPR, pp. 1–8 (2008) [5] Iddan, G., Meron, G., Glukhovsky, A., Swain, P.: Wireless capsule endoscopy. Nature 405(6785), 417–418 (2000) [6] Mackiewicz, M., Berens, J., Fisher, M., Bell, D.: Colour and texture based gastrointestinal tissue discrimination. In: Proc. IEEE Int’l Conf. on Acoustics, Speech and Signal Processing - Proceedings 2, ICASSP, pp. 11597–11600 (2006) [7] Berens, J., Mackiewicz, M., Bell, D.: Stomach, intestine and colon tissue discriminators for wireless capsule endoscopy images. In: Proceedings of SPIE, Progress in Biomedical Optics and Imaging, vol. 5747, pp. (I): 283–290 (2005) [8] Lee, J., Oh, J., Shah, S.K., Yuan, X., Tang, S.J.: Automatic classification of digestive organs in wireless capsule endoscopy videos. In: Proc. of the ACM, Symposium on Applied Computing, pp. 1041–1045 (2007) [9] Bourbakis, N.: Detecting abnormal patterns in WCE images. In: Proc. 5th IEEE Symposium on Bioinformatics and Bioengineering, BIBE, pp. 232–238 (2005) [10] Hwang, S., Oh, J., Cox, J., Tang, S.J., Tibbals, H.F.: Blood detection in wireless capsule endoscopy using expectation maximization clustering. In: Proceedings of SPIE, Progress in Biomedical Optics and Imaging, vol. 6144(I) (2006) [11] Kodogiannis, V.S., Boulougoura, M.: Neural network-based approach for the classification of wireless-capsule endoscopic images. In: Proc. of the Int’l Joint Conference on Neural Networks, vol. 4, pp. 2423–2428 (2005) [12] Wikipedia, Peak Signal to Noise Ratio, http://en.wikipedia.org/wiki/Peak signal-to-noise ratio [13] Seshamani, S., Rajan, P., Kumar, R., Girgis, H., Dassopoulos, T., Mullin, G., Hager, G.: A Meta Registration Framework for Lesion Matching. In: Yang, G.Z., Hawkes, D., Rueckert, D., Noble, A., Taylor, C. (eds.) MICCAI 2009. LNCS, vol. 5761, pp. 582–589. Springer, Heidelberg (2009)