Epidemics and percolation in small-world networks 1
2
Cristopher Moore1,2 and M. E. J. Newman1
Santa Fe Institute, 1399 Hyde Park Road, Santa Fe, New Mexico 87501 Departments of Computer Science and Physics, University of New Mexico, Albuquerque, New Mexico 87131 We study some simple models of disease transmission on small-world networks, in which either the probability of infection by a disease or the probability of its transmission is varied, or both. The resulting models display epidemic behavior when the infection or transmission probability rises above the threshold for site or bond percolation on the network, and we give exact solutions for the position of this threshold in a variety of cases. We confirm our analytic results by numerical simulation.
I. INTRODUCTION
They solved this model for the one-dimensional smallworld graph, and the solution was later generalized to higher dimensions [9] and to finite-sized lattices [10]. Infection with 100% efficiency is not a particularly realistic model however, even for spectacularly virulent diseases like Ebola fever, so Newman and Watts also suggested using a site percolation model for disease spreading in which some fraction p of the population are considered susceptible to the disease, and an initial outbreak can spread only as far as the limits of the connected cluster of susceptible individuals in which it first strikes. An epidemic can occur if the system is at or above its percolation threshold where the size of the largest cluster becomes comparable with the size of the entire population. Newman and Watts gave an approximate solution for the fraction pc of susceptible individuals at this epidemic point, as a function of the density of shortcuts on the lattice. In this paper we derive an exact solution, and also look at the case in which transmission between individuals takes place with less than 100% efficiency, which can be modeled as a bond percolation process.
It has long been recognized that the structure of social networks plays an important role in the dynamics of disease propagation. Networks showing the “small-world” effect [1,2], where the number of “degrees of separation” between any two members of a given population is small by comparison with the size of the population itself, show much faster disease propagation than, for instance, simple diffusion models on regular lattices. Milgram [3] was one of the first to point out the existence of small-world effects in real populations. He performed experiments which suggested that there are only about six intermediate acquaintances separating any two people on the planet, which in turn suggests that a highly infectious disease could spread to all six billion people on the planet in only about six incubation periods of the disease. Early models of this phenomenon were based on random graphs [4,5]. However, random graphs lack some of the crucial properties of real social networks. In particular, social networks show “clustering,” in which the probability of two people knowing one another is greatly increased if they have a common acquaintance [6]. In a random graph, by contrast, the probability of there being a connection between any two people is uniform, regardless of which two you choose. Watts and Strogatz [6] have recently suggested a new “small-world model” which has this clustering property, and has only a small average number of degrees of separation between any two individuals. In this paper we use a variant of the Watts–Strogatz model [7] to investigate disease propagation. In this variant, the population lives on a low-dimensional lattice (usually a one-dimensional one) where each site is connected to a small number of neighboring sites. A low density of “shortcuts” is then added between randomly chosen pairs of sites, producing much shorter typical separations, while preserving the clustering property of the regular lattice. Newman and Watts [8] gave a simple differential equation model for disease propagation on an infinite smallworld graph in which communication of the disease takes place with 100% efficiency—all acquaintances of an infected person become infected at the next time-step.
II. SITE PERCOLATION
Two simple parameters of interest in epidemiology are susceptibility, the probability that an individual exposed to a disease will contract it, and transmissibility, the probability that contact between an infected individual and a healthy but susceptible one will result in the latter contracting the disease. In this paper, we assume that a disease begins with a single infected individual. Individuals are represented by the sites of a small-world model and the disease spreads along the bonds, which represent contacts between individuals. We denote the sites as being occupied or not depending on whether an individual is susceptible to the disease, and the bonds as being occupied or not depending on whether a contact will transmit the disease to a susceptible individual. If the distribution of occupied sites or bonds is random, then the problem of when an epidemic takes place becomes equivalent to a standard percolation problem on the small-world graph: what fraction pc of sites or bonds must be occupied before a “giant component” of connected sites forms whose size 1
can be reached by traveling along a single shortcut. Then we add all local clusters which can be reached from those new ones by traveling along a single shortcut, and so forth until the connected cluster is complete. Let us define a vector v at each step in this process, whose components vi are equal to the probability that a local cluster of size i has just been added to the overall connected cluster. We wish to calculate the value v0 of this vector in terms of its value v at the previous step. At or below the percolation threshold the vi are small and so the vi0 will depend linearly on the vi according to a transition matrix M thus: X Mij vj , (4) vi0 = j
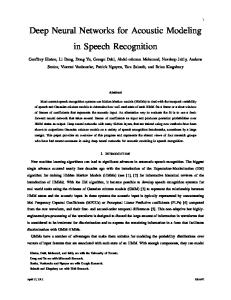
FIG. 1. A small-world graph with L = 24, k = 1, and four shortcuts. The colored sites represented susceptible individuals. The susceptibility is p = 34 in this example.
where Mij = Ni (1 − (1 − ψ)ij ).
scales extensively with the total number L of sites [11]? We will start with the site percolation case, in which every contact of a healthy but susceptible person with an infected person results in transmission, but less than 100% of the individuals are susceptible. The fraction p of occupied sites is precisely the susceptibility defined above. Consider a one-dimensional small-world graph as in Fig. 1. L sites are arranged on a one-dimensional lattice with periodic boundary conditions and bonds connect all pairs of sites which are separated by a distance of k or less. (For simplicity we have chosen k = 1 in the figure.) Shortcuts are now added between randomly chosen pairs of sites. It is standard to define the parameter φ to be the average number of shortcuts per bond on the underlying lattice. The probability that two randomly chosen sites have a shortcut between them is then �kφL � 2kφ 2 (1) ' ψ =1− 1− 2 L L
Here Ni is the number of local clusters of size i as before, and 1 − (1 − ψ)ij is the probability of a shortcut from a local cluster of size i to one of size j, since there are ij possible pairs of sites by which these can be connected. Note that M is not a stochastic matrix, i.e., it is not normalized so that its rows sum to unity. Now consider the largest eigenvalue λ of M. If λ < 1, iterating Eq. (4) makes v tend to zero, so that the rate at which new local clusters are added falls off exponentially, and the connected clusters are finite with an exponential size distribution. Conversely, if λ > 1, v grows until the size of the cluster becomes limited by the size of the whole system. The percolation threshold occurs at the point λ = 1. For finite L finding the largest eigenvalue of M is difficult. However, if φ is held constant, ψ tends to zero as L → ∞, so for large L we can approximate M as Mij = ijψNi .
j
of M where we have set vi0 = λvi . Thus the eigenvectors P have the form vi = Cλ−1 iψNi where C = j jvj is a constant. Eliminating C then gives X j 2 Nj . (8) λ=ψ
(2)
For general k we have Ni = (1 − p)2k p(1 − (1 − p)k )i−1 L = (1 − q)2 pq i−1 L,
(6)
This matrix is the outer product of two vectors, with the result that Eq. (4) can be simplified to X jvj , (7) λvi = iψNi
for large L. A connected cluster on the small-world graph consists of a number of local clusters—occupied sites which are connected together by the near-neighbor bonds on the underlying one-dimensional lattice—which are themselves connected together by shortcuts. For k = 1, the average number of local clusters of length i is Ni = (1 − p)2 pi L.
(5)
j
For k = 1, this gives
(3)
λ = ψLp
where q = 1 − (1 − p)k . Now we build a connected cluster out of these local clusters as follows. We start with one particular local cluster, and first add to it all other local clusters which
1+p 1+p = 2φp . 1−p 1−p
(9)
Setting λ = 1 yields the value of φ at the percolation threshold pc : 2
φ=
�
1 − pc , 2pc (1 + pc )
(10)
Qi+1,j = and
and solving for pc gives p 4φ2 + 12φ + 1 − 2φ − 1 . pc = 4φ
Qi+1 = p(2 − p) Qi + p(1 − p)
(11)
Qij + p2
X
(15)
Qjj0 .
j+j 0 =i
(16) P
i If we define functions H(z) = i Qi z and Pgenerating i j H(z, w) = i,j Qij z w , this gives us � � H(z, w) = z(1 − p)2 H(w) + H(w, 1) + zp(1 − p) H(w, z), (17) H(z) = zp(2 − p)H(z) + zp(1 − p)H(z, 1) (18) + zp2 H(z, z).
k
2 − (1 − p) 1+q = 2kφp , 1−q (1 − p)k
(12)
or, at the threshold φ=
X
for i = 0 for i ≥ 1,
j
For general k, we have λ = ψLp
� � P (1 − p)2 Qj + k Qjk p(1 − p) Qji
(1 − pc )k . 2kpc (2 − (1 − pc )k )
(13)
Since any pair of adjacent sites must belong to some cluster or clusters (possibly of size one), the probabilities Q Pi and Qij must sum to unity according to P i Qi + i,j Qij = 1, or equivalently H(1)+H(1, 1) = 1. Finally, the density of clusters of size i is equal to the probability that a randomly chosen site is the rightmost site of such a cluster, in which case neither of the two bonds to its right are occupied. Taken together, these results imply that the generating function for clusters, P G(z) = i Ni z i , must satisfy � � (19) G(z) = (1 − p)2 H(z) + H(z, 1) .
The threshold density pc is then a root of a polynomial of order k + 1. III. BOND PERCOLATION
An alternative model of disease transmission is one in which all individuals are susceptible, but transmission takes place with less than 100% efficiency. This is equivalent to bond percolation on a small-world graph—an epidemic sets in when a sufficient fraction pc of the bonds on the graph are occupied to cause the formation of a giant component whose size scales extensively with the size of the graph. In this model the fraction p of occupied bonds is the transmissibility of the disease. For k = 1, the percolation threshold pc for bond percolation is the same as for site percolation for the following reason. On the one hand, a local cluster of i sites now consists of i − 1 occupied bonds with two unoccupied ones at either end, so that the number of local clusters of i sites is Ni = (1 − p) p 2
i−1
,
Solving Eqs. (17) and (18) for H(z) and H(z, 1) then gives ��� � G(z) = z(1 − p)4 1 − 2pz + p3 (1 − z)z + p2 z 2 � 1 − 4pz + p5 (2 − 3z)z 2 − p6 (1 − z)z 2 + p4 z 2 (1 + 3z) + p2 z(4 + 3z) �� − p3 z 1 + 5z + z 2 ,
(20)
the first few terms of which give
(14)
N1 /L = (1 − p)4 , N2 /L = 2p (1 − p)6 , N3 /L = p2 (1 − p)6 (6 − 8p + 3p2 ).
which has one less factor of p than in the site percolation case. On the other hand, the probability of a shortcut between two random sites now has an extra factor of p in it—it is equal to ψp instead of just ψ. The two factors of p cancel and we end up with the same expression for the eigenvalue of M as before, Eq. (9), and the same threshold density, Eq. (11). For k > 1, calculating Ni is considerably more difficult. We will solve the case k = 2. Let Qi denote the probability that a given site n and the site n − 1 to its left are part of the same local cluster of size i, when only bonds to the left of site n are taken into account. Similarly, let Qij be the probability that n and n − 1 are part of two separate local clusters of size i and j respectively, again when only bonds to the left of n are considered. Then, by considering site n + 1 which has possible connections to both n and n − 1, we can show that
Again replacing ψ with ψp, Eq. (8) becomes �2 �� � X d 2 i Ni = 2kφp z G(z) , λ = ψp dz z=1 i
(21) (22) (23)
(24)
which, setting k = 2, implies that the percolation threshold pc is given by φ=
(1 − pc )3 (1 − pc + p2c ) . 4pc (1 + 3p2c − 3p3c − 2p4c + 5p5c − 2p6c )
(25)
In theory it is possible to extend the same method to larger values of k, but the calculation rapidly becomes tedious and so we will, for the moment at least, move on to other questions. 3
IV. SITE AND BOND PERCOLATION
1.0
Ni = (1 − psite pbond)
2
pisite
pi−1 bond .
percolation threshold pc
The most general disease propagation model of this type is one in which both the susceptibility and the transmissibility take arbitrary values, i.e., the case in which sites and bonds are occupied with probabilities psite and pbond respectively. For k = 1, a local cluster of size i then consists of i susceptible individuals with i − 1 occupied bonds between them, so that (26)
Replacing ψ with ψpbond in Eq. (8) gives λ = ψ pbond
X j
j 2 Nj = 2φp
1+p , 1−p
0.8 0.6 0.4 0.2 0.0 −4 10
(27)
10
−3
10
−2
10
−1
10
−3
10
−2
10
−1
10
0
shortcut density φ
where p = psite pbond . In other words, the position of the percolation transition is given by precisely the same expression as before except that p is now the product of the site and bond probabilities. The critical value of this product is then given by Eq. (11). The case of k > 1 we leave as an open problem for the interested (and courageous) reader.
FIG. 2. The points are numerical results for the percolation threshold as a function of shortcut density φ for systems of size L = 106 . Left panel: site percolation with k = 1 (circles), 2 (squares), and 5 (triangles). Right panel: bond percolation with k = 1 (circles) and 2 (squares). Each point is averaged over 1000 runs and the resulting statistical errors are smaller than the points. The solid lines are the analytic expressions for the same quantities, Eqs. (11), (13), and (25). The slight systematic tendency of the numerical results to overestimate the value of pc is a finite-size effect which decreases both with increasing system size and with increasing φ [13].
V. NUMERICAL CALCULATIONS
We have performed extensive computer simulations of percolation and disease spreading on small-world networks, both as a check on our analytic results, and to investigate further the behavior of the models. First, we have measured the position of the percolation threshold for both site and bond percolation for comparison with our analytic results. A naive algorithm for doing this fills in either the sites or the bonds of the lattice one by one in some random order and calculates at each step the size of either the average or the largest cluster of connected sites. The position of the percolation threshold can then be estimated from the point at which the derivative of this size with respect to the number of occupied sites or bonds takes its maximum value. Since there are O(L) sites or bonds on the network in total and finding the clusters takes time O(L), such an algorithm runs in time O(L2 ). A more efficient way to perform the calculation is, rather than recreating all clusters at each step in the algorithm, to calculate the new clusters from the ones at the previous step. By using a tree-like data structure to store the clusters [12], one can in this way reduce the time needed to find the value of pc to O(L log L). In Fig. 2 we show numerical results for pc from calculations of the largest cluster size using this method for systems of one million sites with various values of k, for both bond and site percolation. As the figure shows, the results agree well with our analytic expressions for the same quantities over several orders of magnitude in φ. Direct confirmation that the percolation point in these models does indeed correspond to the threshold at which
epidemics first appear can also be obtained by numerical simulation. In Fig. 3 we show results for the number of new cases of a disease appearing as a function of time in simulations of the site-percolation model. (Very similar results are found in simulations of the bond-percolation model.) In these simulations we took k = 5 and a value of φ = 0.01 for the shortcut density, which implies, following Eq. (13), that epidemics should appear if the susceptibility within the population exceeds pc = 0.401. The curves in the figure are (from the bottom upwards) p = 0.40, 0.45, 0.50, 0.55, and 0.60, and, as we can see, the number of new cases of the disease for p = 0.40 shows only a small peak of activity (barely visible along the lower axis of the graph) before the disease fizzles out. Once we get above the percolation threshold (the upper four curves) a large number of cases appear, as expected, indicating the onset of epidemic behavior. In the simulations depicted, epidemic disease outbreaks typically affected between 50% and 100% of the susceptible individuals, compared with about 5% in the sub-critical case. There is also a significant tendency for epidemics to spread more quickly (and in the case of self-limiting diseases presumably also to die out sooner) in populations which have a higher susceptibility to the disease. This arises because in more susceptible populations there are more paths for the infection to take from an infected individual to an un-
4
these models, confirming both the position of the percolation threshold and the fact that epidemics take place above this threshold only. Finally, we point out that the method used here can in principle give an exact result for the site or bond percolation threshold on a small-world graph with any underlying lattice for which we can calculate the density of local clusters as a function of their size. If, for instance, one could enumerate lattice animals on lattices of two or more dimensions, then the exact percolation threshold for the corresponding small-world model would follow immediately.
percentage infected
number of new cases appearing
30000
20000
60 40 20 0 0
50
100 150 time t
200
10000
0 0
50
100
150
ACKNOWLEDGMENTS
200
time t
We thank Duncan Watts for helpful conversations. This work was supported in part by the Santa Fe Institute and DARPA under grant number ONR N0001495-1-0975.
FIG. 3. The number of new cases of a disease appearing as a function of time in simulations of the site-percolation model with L = 106 , k = 5, and φ = 0.01. The top four curves are for p = 0.60, 0.55, 0.50, and 0.45, all of which are above the predicted percolation threshold of pc = 0.401 and show evidence of the occurrence of substantial epidemics. A fifth curve, for p = 0.40, is plotted but is virtually invisible next to the horizontal axis because even fractionally below the percolation threshold no epidemic behavior takes place. Each curve is averaged over 1000 repetitions of the simulation. Inset: the total percentage of the population infected as a function of time in the same simulations.
[1] M. Kocken, The Small World. Ablex, Norwood, NJ (1989). [2] D. J. Watts, Small Worlds. Princeton University Press, Princeton (1999). [3] S. Milgram, “The small world problem,” Psychology Today2, 60–67 (1967). [4] L. Sattenspiel and C. P. Simon, “The spread and persistence of infectious diseases in structured populations,” Mathematical Biosciences 90, 367–383 (1988). [5] M. Kretschmar and M. Morris, “Measures of concurrency in networks and the spread of infectious disease,” Mathematical Biosciences 133, 165–195 (1996). [6] D. J. Watts and S. H. Strogatz, “Collective dynamics of ‘small-world’ networks,” Nature 393, 440–442 (1998). [7] M. E. J. Newman and D. J. Watts, “Renormalization group analysis of the small-world network model,” Phys. Lett. A 263, 341–346 (1999). [8] M. E. J. Newman and D. J. Watts, “Scaling and percolation in the small-world network model,” Phys. Rev. E 60, 7332–7342 (1999). [9] C. Moukarzel, “Spreading and shortest paths in systems with sparse long-range connections,” Phys. Rev. E 60, 6263–6266 (1999). [10] M. E. J. Newman, C. Moore, and D. J. Watts, “Mean-field solution of the small-world network model,” cond-mat/9909165. [11] Technically this point is not a percolation transition, since it is not possible to create a system-spanning (i.e., percolating) cluster on a small-world graph. To be strictly correct, we should refer to the transition as “the point at which a giant component first forms.” This is something of a mouthful however, so we will bend the
infected one. The amount of time an epidemic takes to spread throughout the population is given by the average radius of (i.e., path length within) connected clusters of susceptible individuals, a quantity which has been studied in Ref. [8]. In the inset of Fig. 3 we show the overall (i.e., integrated) percentage of the population affected by the disease as a function of time in the same simulations. As the figure shows, this quantity takes a sigmoidal form similar to that seen also in random-graph models [4,5], simple small-world disease models [8], and indeed in real-world data. VI. CONCLUSIONS
We have derived exact analytic expressions for the percolation threshold on one-dimensional small-world graphs under both site and bond percolation. These results provide simple models for the onset of epidemic behavior in diseases for which either the susceptibility or the transmissibility is less than 100%. We have also looked briefly at the case of simultaneous site and bond percolation, in which both susceptibility and transmissibility can take arbitrary values. We have performed extensive numerical simulations of disease outbreaks in
5
rules a little and continue to talk about “percolation” in this paper. [12] G. T. Barkema and M. E. J. Newman, “New Monte Carlo algorithms for classical spin systems,” in Monte Carlo Methods in Chemical Physics, D. Ferguson, J. I. Siepmann, and D. G. Truhlar (eds.), Wiley, New York (1999). [13] We have also experimented with finite-size scaling as a method for calculating pc . Such calculations are however prone to inaccuracy because, as pointed in Ref. [8], the correlation length scaling exponent ν, which governs the behavior of pc as system size is varied, depends on the effective dimension of the graph, which itself changes with system size. Thus the exponent can at best only be considered approximately constant in a finite-size scaling calculation. Rather than introduce unknown errors into the value of pc as a result of this approximation, we have opted in the present work to quote direct measurements of pc on large systems as our best estimate of the percolation threshold.
6