The 18th Annual IEEE International Symposium on Personal, Indoor and Mobile Radio Communications (PIMRC’07)
ENERGY AND SPECTRUM EFFICIENT TRANSMISSION MODES FOR THE 3GPP-LTE UPLINK Hanguang Wu and Thomas Haustein Nokia Siemens Networks, COO RTP PT Radio System Technology St.-Martin-Str. 76, 81617 Munich, Germany A BSTRACT In this paper we report on PAPR reduction techniques using DFT precoding at the user equipment transmitter as discussed in standardization for 3GPP-Long-Term-Evolution (LTE) uplink. We propose to combine DFT precoding and frequency dependent scheduling, a so called a virtual multiuser DFT precoding technique, to achieve high spectral efficiency in moderate and high SNR condition. This technique enables flexible and efficient utilization of frequency resources. It also enables multiple service for users with different quality of service and error protection requirements. For cell edge users with low SNR, we show that DFT precoding with filtering similar to single carrier transmission with appropriate pulse shaping is a reasonable option to increase the cell edge throughput. I.
I NTRODUCTION
To satisfy the increasing demand for more bandwidth and higher data rate in communication systems, common solutions are to use more bandwidth, higher order modulation and multiple antenna techniques. In a cellular environment and especially at large transmission bandwidth the channel between the antennas at the transmitter and receiver becomes increasingly frequency selective. A common technique is to use multi-carrier transmission, e.g., OFDM, short for Orthogonal Frequency Division Multiplexing. This technique transforms a frequency selective channel into a group of frequency flat channels which can effectively combat the large time dispersions due to multipath propagation. Moreover, the introduction of a cyclic prefix at the transmitter reduces the complexity to only Fast Fourier Transform (FFT) processing and one tap scalar equalization per subcarrier at the receiver [1]. OFDM has been extended to an multiple access scheme, known as OFDMA, to accommodate simultaneous users in the system. An important advantage of OFDMA is that frequency depending scheduling can be easily applied to the system by mapping the user signal onto the resources with good transmission quality. In practice, in order not to lose too much spectral efficiency, OFDM symbols are usually enlarged such that the guard interval overhead is kept below 5%. As a result, many adjacent sub-carriers will experience similar channel condition, i.e., SNR (signal to noise ratio). In order to reduce signalling overhead, these sub-carriers are usually grouped together and allocated to one user during a predefined number of consecutive OFDM symbols, which is called a resource block (RB), and we assign a common modulation and coding scheme (MCS) to it. Despite the advantages of OFDM and OFDMA, one big disadvantage is that their waveforms have high PAPR (peak-to-average-power ratio) which is more or less independent of MCS. This is problematic for uplink transmission where the terminal power is usually limited. Due to the high PAPR value, the mean transmit power will be greatly limited by the linear range of power amplifiers. The required backoff reduces the average transmitted power significantly and hence reduces the link budget in the uplink. This is very crucial for cell edge users due to their large path loss. Though various PAPR reduction techniques can be applied to OFDM waveform which have been addressed in [2] and the references therein, 3GPP-LTE agreed on using single carrier (SC-FDMA) transmission with cyclic prefix c 1-4244-1144-0/07/$25.00�2007 IEEE
in the uplink where frequency domain generation of the signal by a DFT precoding followed by an IFFT structure was assumed [3]. This structure also allows having the same one-tap equalizer in the frequency domain. It can be interpreted as DFT precoding additionally inserted in the OFDM transmitter and PAPR is significantly decreased, hence it is also known as a PAPR reduction technique for an OFDM waveform. Nevertheless, we will show later that this structure proposed by 3GPP-LTE has limitations in frequency dependent scheduling to achieve high spectral efficiency in case that a good link budget and many RBs for a single user are available. In this paper, we discuss the DFT precoding technique and study the energy and spectral efficiency in the uplink for LTE system. We propose to combine DFT precoding and frequency dependent scheduling to achieve higher spectral efficiency in moderate and high SNR condition. Moreover, we find that the quality of transmission can be improved to an even larger extent for cell edge users if frequency domain filtering or pulse shaping is applied after DFT precoding. The paper is organized as follows: Section II discusses the energy and spectral efficiency transmission mode. Section III reviews the PAPR problem in a multicarrier system. Section IV describes the PAPR reduction by DFT precoding and its combination with frequency dependent scheduling. Simulation results for spectral efficiency are presented in Section V. II.
E NERGY AND SPECTRAL EFFICIENCY
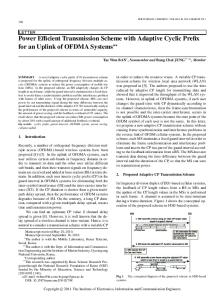
We start with an ideal communication system in the uplink where an infinite number of frequency resources are available for all users. For simplicity, first it is assumed that each user encounters a frequency flat channel. With a given link budget, theoretically, each user can use a certain number of frequency resources and distribute the transmit power evenly among them. The relationship between the number of sub-carriers occupied by the user and the effective SNR per sub-carrier is then given by the solid lines in Figure 1. Each solid line represents a given link budget and it can extend to infinite number of sub-carriers which are not shown here. However, in practice, the available frequency resources for a single user are usually limited because the radio channel is a shared medium. Hence users are only allowed to use up to a certain number of them. In the example shown in Figure 1, the solid lines stop, e.g., at 30 sub-carriers due to the so called resource control in the system. Moreover, the transmit power is usually limited by the linearity of amplifiers and battery volume which constrains the transmit power of the terminal to a certain upper level, e.g., 200mW. On the other hand, it should be regulated and limited keeping in mind the automatic gain control (AGC) at the receiver, which reacts on the time domain signal and will cause near far problems. As a result, the effective SNR per sub-carrier will be constrained to a certain value in a practical system such that the received signals from cell edge users will not degrade by near far effects, even if some users could benefit from their better link budget. For data transmission, the appropriate MCS can be used depending on the channel quality in order to meet the target bit error rate (BER). As an example, the SNR values required to support different MCSs are indicated by the dashed lines in Figure 1, on top of which the alphabet size M of modulation and code
The 18th Annual IEEE International Symposium on Personal, Indoor and Mobile Radio Communications (PIMRC’07)
M= 2 R=1/3 35
4 1/2
4 2/3
16 1/2
16 2/3
16 5/6
64 2/3
64 64 5/6 9/10
Resource Control Limit ↓ 40⋅bits/TTI
25
Power Control Limit ↓
Number of sub−carriers
30
2 4 1/21/3
Energy Efficient Spectrum Efficient Transmission Transmission
20
30⋅bits/TTI
15
10
5 5.4⋅bits/TTI 0
5
10
15
20
25
Effective SNR (dB) per sub−carrier
Figure 1: Energy efficient transmission and spectrally efficiency transmission strategy in a communication system
rate R are depicted where unless otherwise stated, 2,4,16 and 64 represent the modulation scheme BPSK, QPSK, 16QAM and 64QAM, respectively. If a user always chooses the highest order MCS that can be supported, its throughput can be determined by multiplying the number of sub-carriers with the spectral efficiency of the MCS used. In our example, a user can employ 64QAM and code rate 9/10 at an effective SNR of 20dB with one sub-carrier whose throughput amounts to 6 (bits/symbol) × 9/10 × 1 (symbol/sub-carrier) × 1 (sub-carrier/TTI)=5.4 (bits/TTI), where TTI stands for transmit time interval. Alternatively, it can distribute the transmit power in 15 subcarriers while employing 16QAM with a code rate 1/2 which adds up to 4 (bits/symbol) × 1/2 × 1 (symbol/sub-carrier) × 15 (subcarriers/TTI)=30 (bits/TTI) or it can distribute the power in 30 subcarriers with each using a lower order modulation QPSK and a code rate 2/3 and then the throughput goes up to 2 (bits/symbol) × 2/3 × 1 (symbol/sub-carrier) × 30 (sub-carriers/TTI)=40 (bits/TTI). That means with lower order modulation schemes like BPSK and QPSK less power is needed in order to obtain the same throughput compared to using the higher order modulation schemes 16QAM and 64QAM. But the price to be paid is the larger number of sub-carriers needed, i.e., spectral efficiency is reduced. Therefore, the transmission strategy can be divided into two regions, namely the energy efficient transmission region and spectrum efficient transmission region, where the former employs BPSK and QPSK, the latter 16QAM and 64QAM. In the case of a high SNR condition meaning a good link budget for the user, it can operate on either higher order MCSs or lower order MCSs depending on the given constraints of the system. However, in the case of a low or bad SNR condition, only lower MCSs can be supported for signal transmission. This corresponds to the lower left corner region in Figure 1. This situation is typical for cell edge users in mobile cellular systems where on the one hand signal strength is usually quite weak due to the large path loss resulting from the large distance from their serving base stations, on the other hand the desired signal is more likely to be distorted by their neighboring co-channel users. Basically, there are two possibilities to improve the transmission quality of the cell edge users. One way is to choose the operation point towards higher effective SNR per sub-carrier according to Figure 1 which means that the terminal should concentrate all the available power in less sub-carriers for transmission. The other way is to let the transmitter operate on another curve towards the higher SNR direction which means to increase the link budget, e.g., to increase the mean transmit power using PAPR reduction techniques. In the case of a more realistic frequency selective channel, the
relationship between the number of sub-carriers and effective SNR per sub-carrier is no longer as easy as that for frequency flat channel because now it depends on which frequency resources used by the user. An optimal bit loading strategy results in the water-filling solution in the frequency domain. But it is computationally complex in practice. Computation reduction algorithms can be found in [4, 5, 6]. A simple but very spectrally inefficient strategy is to select a common MCS for the whole occupied bandwidth according to its worst SNR. A better strategy is to divide the occupied frequency resources into blocks with similar SNR and then choose MCSs independently for each block according to its worst SNR value. This can be easily applied to a multicarrier system, e.g., an OFDMA system by assigning higher order MCS to the blocks which experience higher channel gain while allocating lower order MCS to the blocks encountering lower or bad channel quality. III.
PAPR IN A M ULTICARRIER SYSTEM
In this section, we briefly review the PAPR problem in a multicarrier system. For simplicity, we explain the concept for an OFDM system but it is also suitable for other multicarrier systems. A. PAPR of an OFDM signal Let us denote the data block of length N as a vector X = [X0 , X1 , ..., XN −1 ] where N is the number of sub-carriers. The duration of a symbol Xn in X is equal to T . In an OFDM system, each symbol in X modulates one of a set of sub-carriers, i.e., {fn , n = 0, 1, ..., N − 1}. The sub-carriers are spaced in such a way that they are orthogonal to each other. In practice, this can be easily realized by performing inverse discrete Fourier transform (IDFT) for the data block X, i.e., by choosing fn = n∆f where ∆f = N1T . The complex envelope of the transmitted OFDM signal is then given by N −1 1 � x(t) = √ Xn ej2πfn t , 0 ≤ t < N T, (1) N n=0 The PAPR of the transmitted OFDM signal in (1) can be expressed as max0≤t
(dB)
(4)
The 18th Annual IEEE International Symposium on Personal, Indoor and Mobile Radio Communications (PIMRC’07) 11
Data burst source Length=N
DFT Length=N
Map DC to center
RRC filter in Frequency Domain
10 9
CP
Cyclic Shift F/2+2
2048 IFFT
PAPR (dB)
8
Cyclic shift to desired RBs
7
OFDMA,BPSK DFT,BPSK
6
DFT+Filter,BPSK OFDMA,QPSK
5
DFT,QPSK 4
F=round(2048/N) Inner OFDM transmitter
DFT+Filter,QPSK OFDMA,16QAM
3
DFT,16QAM DFT+Filter,16QAM
2
OFDMA,64QAM 1
Figure 2: Structure of the frequency domain realization of a SC transmitter where Pmean is mean input power of the transmitted signal. In practice, Pmean is not likely to be changed after the transmission of the pilots for channel estimation starts, therefore, it is usually calculated based on a long term average of the input power which may consist of many OFDM symbols.
0
20
40
60
80 100 Number of sub−carriers
120
140
160
DFT,64QAM 180 DFT+Filter,64QAM
Figure 3: PAPR at 99% CDF versus number of sub-carriers for OFDMA, DFT precoding , DFT precoding with filtering with modulation schemes bitwise rotated BPSK, QPSK, 16QAM and 64QAM. Note that BPSK in I or Q will have a higher PAPR than QPSK. 8
IBO ≥ PAPRt
(5)
where CDF(PAPRt ) = 0.99. IV.
PAPR REDUCTION BY DFT PRECODING
As stated in Section II the link budget of the cell edge users can be improved by increasing the transmit mean power. This can be accomplished by PAPR reduction in the waveforms so that IBO can be reduced and the mean power can be increased. Motivated by the fact that single carrier transmission has a lower PAPR due to its inherent structure especially at lower order modulation. It is shown in [8] that frequency domain realization of a single carrier transmitter corresponds to an OFDM transmitter with additionally a DFT precoding stage and optionally a root raised cosine (RRC) filtering stage as depicted in Figure 2. The detailed mapping of the procedures and explanation of each stage can be found in [8] which is omitted here for brevity. In the sequel, the waveforms generated by such structures will be referred to as DFT precoding or DFT precoding with filtering depending on the existence of the RRC filter. In the following, we will compare the PAPR values in different aspects for three waveforms: OFDMA, DFT precoding and DFT precoding with filtering. A. PAPR versus number of sub-carriers Unless otherwise stated, a block of modulated symbols of multiples of size 12, is fed into each transmitter per OFDM symbol. For the roll-off factor of the RRC filter we adopt α = 0.7 and the symbols are mapped onto allocated RBs occupying as many sub-carriers as 1.25 times the number of symbols [8]. For OFDMA and DFT precoding, the number of modulated symbols and the number of used sub-carriers are the same. With OFDM each symbol is mapped exactly on one sub-carrier while with DFT precoding each DFT output is mapped to one sub-carrier, therefore all modulated symbols are distributed over all sub-carriers. Figure 3 and Figure 4 depict the PAPR values in dB at 99% CDF and 50% CDF versus number of carriers for different modulation schemes and different waveforms, respectively. It can be seen that the PAPR of OFDMA and DFT precoding increases as the number of carriers increases for all the modulation schemes: bitwise rotated BPSK (it is labeled as BPSK
7
6 PAPR (dB)
C. PAPR and IBO Amplifiers working in the non-linear domain will cause significant signal distortions and lead to both in-band and out-of-band interference, which should be avoided for data transmission. In order to limit the probability of causing an amplifier working in the nonlinear domain, IBO should be large enough so that the probability of the signal peak power exceeding IP1dB is less than a predefined probability, e.g. 1%, which can be expressed as
OFDMA,BPSK 5
DFT,BPSK DFT+Filter,BPSK OFDMA,QPSK
4
DFT,QPSK DFT+Filter,QPSK
3
OFDMA,16QAM DFT,16QAM
2
DFT+Filter,16QAM OFDMA,64QAM
1
0
20
40
60
80 100 Number of sub−carriers
120
140
160
DFT,64QAM 180 DFT+Filter,64QAM
Figure 4: PAPR at 50% CDF versus number of sub-carriers for OFDMA, DFT precoding , DFT precoding with filtering with modulation schemes bitwise rotated BPSK, QPSK, 16QAM and 64QAM throughout the paper for brevity), QPSK, 16QAM and 64QAM. While for DFT precoding with filtering which is essentially a classic SC-FDMA transmitter, PAPR almost remains constant. As the modulation order increases, PAPR also increases for DFT precoding and DFT precoding with filtering. In the case of OFDMA, PAPR values are almost the same for QPSK, 16QAM and 64QAM, except bitwise rotated BPSK is a bit smaller. In Figure 4 we can see that the waveforms of DFT precoding with filtering can have a higher PAPR@50%CDF than those without filtering for 64QAM. In any other cases, DFT precoding with filtering results in minimum PAPR, while without filtering PAPR is in the middle and maximum in the case of OFDMA. B. PAPR for mixed modulation Classically, when using a Single Carrier waveform with DFT precoding and IFFT the precoded symbols are somehow spread over all allocated RBs and the MCS cannot be chosen according to the SNR seen in each RB as known from OFDM. Note that throughout this paper we consider only localized mapping and no distributed mapping like interleaved SC-FDMA (IFDMA), since we are interested in frequency adaptive MCS choice instead of frequency diversity. We revise the structure of DFT precoding as shown in Figure 5 which makes frequency adaptive MCS possible, hence allowing frequency dependent scheduling. The proposed structure consists of multiple DFTs with which different modulation schemes can be individually precoded and mapped onto the desired RBs depending on the channel quality. This structure has mainly two advantages compared to the conventional structure of SC-FDMA with DFT precoding. First it can make use of the available resources flexibly when the total number of RBs is not in the set of DFT size, where usually DFT size consist of a limited number of radixes only. Second, it enables multiple service for users with different quality of service and error protection requirements. Table 1 shows the PAPR for mixed modulation in 2 RBs with OFDMA, DFT precoding with filtering and without filtering at 99% CDF, respectively. It can be seen that the
The 18th Annual IEEE International Symposium on Personal, Indoor and Mobile Radio Communications (PIMRC’07)
Localized mapping CP insertion
IFFT RRC filter
DFT
Localized mapping
Figure 5: Transmitter structure with individual DFT precoding PAPR is almost the same, around 9.2dB with OFDMA irrespective the modulation scheme used. On the contrary, for DFT precoding with and without filtering, the PAPR strongly depends on the modulation scheme. For better illustration, in the sequel we choose the Table 1: PAPR in dB for mixed modulation with OFDMA, individual DFT precoding with and without filtering at 99% CDF Mod. RB1 2 2 2 2 4 4 4 4 16 16 16 16 64 64 64 64
Mod. RB2 2 4 16 64 2 4 16 64 2 4 16 64 2 4 16 64
OFDMA 9.1192 9.1994 9.2173 9.2836 9.1904 9.2037 9.2643 9.2163 9.2474 9.2101 9.2876 9.3126 9.2772 9.2182 9.305 9.2864
DFT precoding with filtering 4.7419 5.4227 6.5308 7.0008 5.4257 6.0034 6.8086 7.2099 6.5284 6.8094 7.774 7.9934 7.0026 7.2174 8.0017 8.1985
DFT precoding without filtering 6.5993 7.1869 7.5054 7.587 7.1234 7.6163 7.8644 7.975 7.4923 7.9384 8.1938 8.2084 7.5672 7.9848 8.2305 8.2921
PAPR@99%CDF of an OFDMA waveform with common modulation scheme 64QAM for 2 RBs as a reference, which has the highest PAPR among other modulation schemes and corresponds to a system with fixed IBO setting of IBO ≥ PAPR64QAM,99%CDF . The PAPR gain with other waveforms is then defined as the difference between reference PAPR and PAPR of the desired waveform, i.e., PAPRg (dB) = PAPROFDMA,64QAM (dB) − PAPRd (dB)
(6)
Figure 6 shows the PAPR gains versus sum rate of 2 RBs for different 8 Indivi. OFDMA Indivi. DFT Common DFT Indivi. DFT+Filter Common DFT+Filter
7
PAPR gain (dB)
6 5 4 3 2 1 0
1
1.5
2
2.5 3 3.5 4 4.5 Sum rate of 2RBs (bits/modulated symbol)
5
5.5
6
C. Tradeoff between PAPR reduction and individual MCS selection As stated before, spectral efficiency can be increased by increasing the mean transmit power, e.g., reducing PAPR hence reducing IBO, or by applying block based individual MCS selection rather than common MCS in the case of frequency selective channel. However, the discussion in previous subsection indicates that the gain obtained by these two methods can not be maximized at the same time. Therefore, to which extent that spectral efficiency can be increased will depend on the tradeoff between PAPR reduction and frequency selectivity of the channel, and additionally depend on spectral expansion loss if filtering is applied. V.
S PECTRAL EFFICIENCY
In this section, we compare the achievable spectral efficiency of common MCS and individual MCS per RB for the above mentioned multiple access schemes. To make a fair comparison, it is necessary to discuss the MCS selection criterions for different waveforms . A. MCS selection In an OFDMA system, in order to meet the target BER the highest order MCS can be supported on the allocated RBs depends on not only the average SNR, but also the code length, SNR distribution of the belonging RBs, etc. It would be too optimistic to decide MCS according to the average SNR. Alternatively we can safely select proper MCS according to the worst effective SNR of the belonging RBs to satisfy the target BER though it is a bit conservative. In the case of SC-FDMA, with DFT precoding the information of each transmitted symbol is spread out over the entire bandwidth. This means that the worst sub-channel would not wipe out complete symbols because the information of each symbol can be recovered from other sub-carriers. It was shown in [9] that if frequency domain Zero Forcing equalization is assumed, cyclic prefix based SC transmission has the same performance as OFDM with equal gain (EG) power allocation regarding the BER performance. The EG power allocation pre-equalizes the gains of sub-carriers so that all gains are equal. This means that the information of each transmitted symbol sees the average SNR of the entire bandwidth of the user. Therefore, the highest order MCS can be supported on the allocated RBs depends on the average SNR of all belonging RBs. B. Instantaneous spectral efficiency First, we investigate the instantaneous spectral efficiency of different multiple access schemes by choosing static channel models. Both a quasi frequency flat channel and a strongly frequency selective channel are considered. The left part of Figure 7 shows the quasi frequency flat channel used for numerical evaluation. It spans over 24 sub-carriers and the channel power gain for each sub-carrier is represented by a point marked with ” ∗ ”. Note that the channel average SNR is 0dB and the maximum difference for each sub-carrier is less than 0.5dB. For other average SNR values, the same pat5 0 −5 −10
0
5
10 15 Index of Subcarriers
20
25
SNR⋅|H(f)|2 (dB)
Modulated symbols
RRC filter
DFT
SNR⋅|H(f)|2 (dB)
Modulated symbols
10 0 −10
loss with filtering is not included here.
waveforms. It can be observed that the PAPR gains tend to go down as the sum rate increases for DFT precoding both with and without filtering. The PAPR gains for using common DFT precoding and MCS for the two blocks are also shown as reference. It can be seen that given the same sum rate the waveform with mixed modulation by individual DFT precoding has higher PAPR than common DFT precoding and MCS, but it is still smaller than that of OFDMA.
4
3
2
1
0 −10
0
5 Spectral Efficiency (bits/s/Hz)
Figure 6: PAPR gain in dB versus sum rate of 2 RBs. Note that spectral expansion
Spectral Efficiency (bits/s/Hz)
5
−5
0
5 10 Average SNR(dB)
15
20
25
4
3
5
10 15 Index of Subcarriers
20
25
OFDMA,common MCS Common DFT+MCS Common DFT+Filter+MCS OFDMA,indivi. MCS Indivi. DFT+MCS Indivi. DFT+Filter+MCS
2
1
0 −10
−5
0
5
10 15 Average SNR(dB)
20
25
30
35
Figure 7: Instantaneous spectral efficiency with common and individual MCS selection for OFDMA and DFT precoding with and without filtering in frequency flat channel (left) and in frequency selective channel (right). Same legend applies to both figures.
The 18th Annual IEEE International Symposium on Personal, Indoor and Mobile Radio Communications (PIMRC’07)
4.5
3.5 3
0.5 OFDMA,common MCS Common DFT+MCS Common DFT+Filter+MCS OFDMA,indivi. MCS Indivi. DFT Indivi. DFT+Filter+MCS
0.45
Mean Spectral Efficiency(bits/s/Hz)
Mean Spectral Efficiency(bits/s/Hz)
4
2.5 2 1.5 1
0.3 0.25 0.2 0.15 0.1
0.5 0 −10
0.4 0.35
0.05
−5
0
5
10 15 Average SNR(dB)
20
25
30
0 −10
−5
0
5
Average SNR(dB)
Figure 8: Left: Mean spectral efficiency obtained by OFDMA and DFT precoding with and without filtering in SCME ”urban-macro” scenario. Both common MCS and individual MCS are considered. Right: Cell edge user detail of the left figure tern of channel gains is used and it will be appropriately scaled in the simulation. In our experiment, worst SNR is chosen as a criterion for MCS selection for OFDMA while average SNR for DFT precoding techniques. For common MCS, MCS is decided according to the worst/average SNR value of the 24 sub-carrier. For individual MCS, the sub-carriers are divided into two blocks where one block RB1 starts from the 1st sub-carrier to the 12nd subcarrier and the other block RB2 occupies from the 13th sub-carrier to the 24th sub-carrier. MCS is then decided independently for each block according to its worst/average SNR. In the left part of Figure 7, obviously each block nearly has the same worst/average SNR, i.e., SNRmin/avg,RB1 ≈ SNRmin/avg,RB2 . Hence the worst/average SNR of all the resource blocks SNRmin/avg,RB1 +RB2 ≈ SNRmin/avg,RB1 ≈ SNRmin/avg,RB2 , which implies that individual MCS can hardly bring any gain over common MCS. This can be easily demonstrated by inspecting the spectral efficiency for OFDMA in the left part of Figure 7. For DFT precoding with and without filtering, individual MCS requires independent precoding for each block which results in smaller PAPR gain over OFDMA than common precoding and MCS. Therefore, individual MCS has lower spectral efficiency than common MCS for these two schemes. In low SNR condition up to 5dB, common DFT precoding with filtering using common MCS achieves the highest spectral efficiency among all schemes, while in moderate and high SNR condition, common DFT precoding using common MCS without filtering often achieves the highest spectral efficiency and the difference to that of individual DFT precoding and MCS is very small. Similar results are also observed in the case of strongly frequency selective channel, where the maximum SNR difference for different sub-carriers is more than 10dB, as depicted in the right part of Figure 7. However, OFDMA systems results in great spectral efficiency degradation since the worst SNR of the sub-channels limits other sub-carriers to select higher MCSs even they encounter good channel qualities. C. Mean spectral efficiency In this subsection, we use similar parameter settings defined in 3GPP-LTE uplink for numerical evaluation of the achievable mean spectral efficiency obtained by the above mentioned waveforms. We assume in this context a RB consists of 12 sub-carriers and 12 OFDM long blocks with sub-carrier spacing of 15kHz, or equivalently 144symbols/180kHz. The uplink TTI is chosen to be 1ms. Spectral efficiency is then given by Cs =
K 1 � Mod(RBk )bits · 144/(1ms · 180kHz), K
(7)
k=1
where K denotes the number of RBs. Figure 8 shows the mean spectral efficiency with 2 RBs obtained by different waveforms and MCS selections for different average SNRs, where the spectral efficiency is averaged over 10000 channel snapshots in urban-macro scenario defined in the SCME (Spatial Channel Model-Extended)
channel model [10]. Simulation results with 3 RBs are similar which are not shown here. We can see that for an SNR level of above 7dB, common DFT precoding and MCS always achieve the highest mean spectral efficiency. However, the loss in spectral efficiency with individual DFT precoding and MCS compared to common DFT precoding and MCS is smaller than 0.2 bits/s/Hz. Its improvement over OFDMA with common MCS is about 55% at SNR of 10dB and 29% at SNR of 20dB. For the cell edge users with low SNR up to 7dB, common DFT precoding with filtering using common MCS seems to be a reasonable choice because it can achieve much higher spectral efficiency than other waveform and MCS selection schemes. For example (see the right part of Figure8), at SNR of −4dB, 0.39bits/s/Hz can be expected by this scheme which is more than 10 times the spectral efficiency obtained by OFDMA with common MCS, i.e., 0.036bits/s/Hz. Therefore, in order to achieve higher spectral efficiency common DFT precoding and MCS is recommended if good link budget is available. In case that this scheme can not be applied due to its previous mentioned inherent limitations, individual DFT precoding and MCS is an attractive option. For cell edge users with low SNR condition, common DFT precoding with filtering using common MCS is preferred. VI.
C ONCLUSION
In this paper, we discussed PAPR reduction by DFT precoding technique and studied the energy and spectral efficiency in the uplink for 3GPP-LTE. We propose to combine DFT precoding and frequency dependent scheduling and it shows to achieve high spectral efficiency in moderate and high SNR condition. For cell edge users with relatively low SNR, we show DFT precoding with filtering is a reasonable option to increase the cell edge throughput. Other metrics like cubic metric [11] which are commonly discussed to evaluate PAPR reduction were not considered here. Nevertheless, the main results will hold in principle. R EFERENCES [1] M. Debbah. Short introduction to OFDM. bah/paper/ofdmtutorial.pdf, 2004.
www.eurecom.fr/ deb-
[2] S. H. Han and J. H. Lee. An overview of Peak-to-Average power ratio reduction techniques for multicarrier transmission. IEEE Wireless Commun., 12(2):56– 65, April 2005. [3] 3GPP TR 25.814. 3GPP TSG RAN physical layer aspect for UTRA, v7.1.0. [4] A. Giovanidis, T. Haustein, E. Jorswieck, and D. Kim. Maximization of the single user rate in OFDMA assuming equal power on allocated subcarriers. In IEEE VTC’07-Spring. Dublin, Ireland, April 2007. [5] A. Giovanidis, T. Haustein, Y. Hadisusanto, A. Sezgin, and D. Kim. Multiuser scheduling using equal power in allocated subcarriers for OFDM uplink. In 40th annual Asilomar Conference on Signals, Systems and Computers. Monterey, USA, Nov 2006. [6] W. Yu and J. M. Cioffi. Constant-power waterfilling: performance bound and low-complexity implementation. IEEE Trans. on Commun., 54(1):23–28, Jan 2006. [7] C. Tellambura. Computation of the continuous-time PAR of an OFDM signal with BPSK subcarriers. IEEE Commun. Lett., 5(5):185–187, May 2001. [8] V. Jungnickel, T. Hindelang, T. Haustein, and W. Zirwas. SC-FDMA waveform design, performance, power dynamics and evoluation to MIMO. In IEEE International Conference on Portable Information Devices. Orlando,Florida, March 2007. [9] N. Wang and S. Blostein. Comparison of cp-based single carrier and OFDMA with power allocation. IEEE Trans. on Commun., 53(3):391–394, March 2005. [10] D. S. Baum, J. Hansen, G. Del Galdo, M. Milojevic, J. Salo, and P.Ky¨osti. An interim channel model for beyond-3G systems: extending the 3GPP spatial channel model (SCM). In IEEE VTC’05-Spring. Stockholm, Sweden, May-June 2005 [11] 3GPP TS 25.101. 3GPP TSG RAN user equipment radio transmiission and reception (FDD) (Release 6).