Emergence of cooperation in adaptive social networks with behavioral diversity Sven Van Segbroeck†§ , Francisco C. Santos‡§ , Tom Lenaerts§ , and Jorge M. Pacheco¶ † COMO, Vrije Universiteit Brussel, Brussels, Belgium ‡ CoDE-IRIDIA, Universit´e Libre de Bruxelles, Brussels, Belgium § MLG, Universit´e Libre de Bruxelles, Brussels, Belgium ¶ ATP-Group, CFTC & DF, University of Lisbon, Lisbon, Portugal
Abstract. Whether by nature or nurture, humans often respond differently when facing the same situation. Yet, the role of behavioral differences between individuals when immersed in their social network remains largely ignored in most problems of natural and social sciences. Here, we investigate how diversity in the way individuals assess their adverse social partners affects the evolution of cooperation. We resort to evolutionary game theory (EGT) to describe the dynamics of populations in which individuals interact according to an adaptive social network and may respond differently to unwanted social interactions. We show that increasing the number of ways of responding to adverse ties in the population always promotes cooperation. As such, adaptive social dynamics and behavioral differences benefit the entire community even though myopic individuals still act in their own interest. As defectors are wiped out, surviving cooperators maintain the full diversity of behavioral types, providing the means to establish cooperation as a robust evolutionary strategy. Key words: Evolutionary game theory, cooperation, collective behavior, complex networks
1
Introduction
Cooperative behavior constitutes the hallmark of human society [8]. We tend to help others, even if providing such help is costly. However, often it is advantageous to accept all help offered by others without ever giving anything in return, creating the famous paradox of cooperation. The framework of EGT [7] conveniently formulates the problem by representing interactions between individuals in terms of simple games, like the two-person prisoner’s dilemma [13], where each individual has the choice to either cooperate or defect. Individuals receive a certain payoff upon interaction, whose value depends on their own action and on that of their partner. The payoff they accumulate after interacting with all their contacts measures their fitness and represents their social success. Those that do well will be imitated and their behavior spreads in the population.
2
Van Segbroeck et al.
Often one considers a black and white world with only unconditional cooperators (C’s) and unconditional defectors (D’s). The fate of each strategy is determined by the payoff values characterizing the game being played. Mutual cooperation leads to a reward R for both individuals, mutual defection to a punishment P . A C interacting with D receives a suckers payoff S, whereas the D gets a temptation to defect T . The fingerprint of the prisoner’s dilemma is associated with the payoff ranking T > R > P > S: joint cooperation is threatened by the temptation to defect towards a cooperator and by the fear of being betrayed by cooperating against a defector. In infinite, well-mixed populations evolution will always drive C’s to extinction [4,2]. This scenario drastically changes when one takes the specific structure of modern networks of interaction and cooperation into account [10,16]. It has, for instance, been shown that heterogeneity in the role and position of individuals in social networks promotes strong levels of cooperation [14,16,17]. This effect even enhances when one recognizes that interaction networks are dynamic entities [6], whose structure co-evolves with the individual behavior [15,12,18]. Up to now, however, the C’s and D’s that continuously reshape their interaction network exhibit no differences in the way they manage their contacts. This situation contrasts with our everyday experience, where we recognize a continuous behavioral spectrum: Two C’s (D’s) may react differently when confronted with the same unfavorable situation. Their context in the social web will usually reflect a singular melting pot of influences, from culture, environment, family, acquaintances and friends, which together trigger a wide range of responses among individuals in the population [1]. In this work, we study how variability in the spectrum of possible reactions to adverse ties influences cooperation among humans along the links of the social web.
2
The Model
Consider a population described in terms of a network with constant number of nodes N . Every node represents an individual, every edge an interaction between the two individuals it connects. The number of edges changes in time as individuals continuously seek new interactions while abandoning old ones. The lifetime of each interaction depends on the behavior of both individuals involved, coupling the network dynamics with the behavioral (strategy) dynamics. Irrespective of one’s game strategy (C or D), interacting with a C always leads to a higher payoff than interacting with a D (S < R and P < T ). Individuals will therefore be satisfied about their connections with C’s and would like to maintain these as long as possible. Connections with D’s, on the other hand, can be considered as adverse and will be broken at different rates, determined by the individuals’ linking strategy. We introduce behavioral diversity by considering M (usually many) different linking strategies, and study the entangled co-evolution of game strategy and linking strategy with the self-organization of the population structure.
Behavioral diversity and cooperation
3
Let us denote the combined game and linking strategies as Si , with i ∈ {1, . . . , 2M }. We assume for simplicity that all individuals seek new interactions with same propensity α, independent of their game or linking strategy. New links are therefore formed at rate α2 . Links connecting Si individuals with Sj individ−1 −1 (γji ) is the average time Si uals disappear at rate κij = 12 (γij + γji ), where γij (Sj ) individuals would attribute to links with Sj (Si ) individuals. The value γij reflects whether Si individuals are satisfied or dissatisfied with their links with Sj individuals. When satisfied, γij is taken as the minimum value γ among all γij . When dissatisfied, on the other hand, γij is given by the linking strategy of Si individuals and satisfies γij ≥ γ. The corresponding linking dynamics of the network can be described by a set of ordinary differential equations [11,12]: L˙ ij = α2 (Nij − Lij ) − κij Lij ,
(1)
where Lij (respectively, Nij ) is the number (respectively, maximum number) of edges connecting Si individuals with Sj individuals. These differential equations lead to a stationary distributions of links given by L∗ij = Nij φij , where φij = α2 (α2 +κij )−1 denotes the fraction of active links between Si and Sj individuals. Strategies spread in the population according to a mutation-selection process defined by the pairwise comparison rule [20,22]. At every strategy update, an individual A is drawn randomly from the population. With probability µ, he adopts a strategy selected randomly from all 2M available strategies. With probability 1 − µ, fitness determines whether he adopts the strategy of a randomly selected individual B, i.e., A imitates B with probability pAB = (1+eβ(fA −fB ) )−1 , where fX denotes the payoff accumulated by player X after playing a one-shot game round with each neighbor in his network of contacts. The value β (≥ 0) controls the intensity of selection. The limit β → ∞ leads to imitation dynamics in which the individual with the lower payoff always adopts the strategy of the one with the higher payoff. When β � 1, the process becomes equivalent to the weak-selection limit of the frequency dependent Moran process [9]. When the time scale for network updating (τa ) is much faster than that for strategy updating (τe ), the steady state of the linking dynamics determines the configuration of an individual’s neighborhood every time he updates his strategy. In this limit, the fitness of an Si individual is given by [12]: X fi = aij φij (Nj − δij ), (2) j
where A = [aij ]i,j=1,...,2M is the game payoff matrix and Nj the number of Sj individuals. This is mathematically equivalent to the fitness of an Si individual playing a game specified by the rescaled payoff matrix B = [bij ]i,j=1,...,2M = [aij φij ]i,j=1,...,2M
(3)
in a finite, well-mixed population (complete network). This allows us to compute analytically the probability (fixation probability) ρij that an individual with strategy Si takes over a population of N − 1 individuals with strategy Sj ,
4
Van Segbroeck et al.
assuming that meanwhile no additional strategies appear because of mutations. Following [22], ρij =
Erf (ξ1 ) − Erf (ξ0 ) Erf (ξN ) − Erf (ξ0 )
(4)
q Rx 2 with Erf (x) = √2π 0 dye−y , ξk = βµ (ku + v), 2u = bii − bij − bji + bjj and 2v = bjj + bij N − bjj N − bii . Computer simulations show that results obtained under the fast linking assumption (τa � τe ) remain valid for a much wider range of time scales than one would expect from theoretical considerations [12]. As we address the role of behavioral diversity in this work, we will typically consider more than two possible strategies (M > 1), which precludes an analytical description of the stochastic evolutionary dynamics for arbitrary mutation rates. By assuming that mutations occur only rarely, we can analytically describe the system in a compact form [5,3]. The evolutionary dynamics does no longer proceed in the entire 2M -dimensional strategy space, but only along its boundaries, where there are never more than two different strategies present simultaneously. Indeed, as long as no mutations occur, stochastic update dynamics always drives the population to a homogeneous state (monomorphic population), i.e., a state in which only individuals of one particular strategy survive. Assuming a monomorphic population, a specific new strategy will show up with probability 2Mµ−1 and to the extent that µ is sufficiently small, this mutant will go extinct or will fixate before any new mutation occurs. We can approximate this system by a Markov Chain with only 2M states, each state corresponding to a certain homogeneous state of the population. The probability that the appearance of a random mutant in a state with otherwise only Si individuals moves the population to a state with only Sj individuals defines the transition probability between the corresponding states of the Markov Chain. These probabilities define the transition matrix Λ of P the Markov Chain, which is given by ρ 2M Λ = [Λij ]i,j=1,...,2M , where Λii = 1− 2M1−1 k=1,k6=i ρki and Λij = 2Mji−1 (j 6= i). The normalized left eigenvector of the unit eigenvalue of Λ defines the stationary distribution, i.e., the fraction of time the population spends in each of the available strategies. The stationary distributions obtained using this small-mutation approach also hold for larger mutation rates, as also shown in [3].
3
Results
The most simple configuration is the one in which there are only two different linking strategies (M = 2): Individuals break up adverse connections either at a slow rate γS , or at a fast rate γF . In combination with the game strategy we obtain a total of four different strategies: slow C’s (SC’s) and D’s (SD’s), whose adverse interactions last long, and fast C’s (FC’s) and D’s (FD’s), whose adverse interactions are short lived. Following Equation (3), we obtain the payoff
Behavioral diversity and cooperation
M=2 FC
b)
7.2% cooperation 7.5 ρ N
0.0% ρ 3 8.
Increasing diversity
92.8%
56.6%
38%
C9 C6 C4 C2 C1 C8 C3 C7 C5
D0
D4
SC 4.8 ρ N
59.8% cooperation
D2 D3
SD
M = 10
1.6% D9
D8
D5
D6
D7
2.1%
D1
C0
3.2%
unstable states
19.0 ρN
N
5.6%
FD
stable states
a)
5
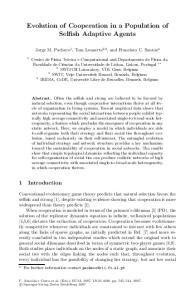
Fig. 1. Transition probabilities and stationary distributions for a population with M = 2 (a) and M = 10 (b) different linking strategies. In the limit of rare mutations, the dynamics reduces to transitions between homogeneous states of the population [5,3]. The arrows indicate those transitions for which the fixation probability is greater than neutral fixation, ρN = N1 . The explicit values were obtained analytically with the pairwise comparison rule [22]. a) Adaptive network dynamics allows C’s, in the form of SC or FC, to remain in the population for 7.2% of the time. D’s dominate because of the flow from FD to SD, either directly or by using the alternative route via SC. b) When M increases to 10, the population spends already 59.8% of the time in a cooperative state. Numbering C’s and D’s according to their type, C0 (D0 ) being the slowest cooperator (defector), we see that increasing M splits the “outflow” of fast defectors among a wide range of different possibilities. As a result, cooperation emerges, since only few types of defectors are evolutionarily stable, whereas the vast majority of cooperative types work as “flow sinks”. (N =100, β=0.01, T =2.1, R=2, S=0.9, P =1, α=0.4, δ=0.3)
matrix: SC SC RφS FC RφS SD T φS F D T φS
FC RφS RφS T φM T φM
SD SφS SφM P φS P φM
FD SφS SφM , P φM P φF
(5)
where φx = α2 (α2 + κx )−1 , with κS = γS , κM = 21 (γS + γF ) and κF = γF . Adopting the small-mutation approach discussed in the previous section, the complex co-evolutionary dynamics reduces to one associated with a Markov Chain with only 4 (2M ) states. The Markov Chain’s transitions that are favored by natural selection, i.e., those that are larger than ρN = N1 (the fixation probability associated with neutral evolution), characterize the main driving forces of the evolutionary dynamics. These transitions are shown in Figure 1 for a region where D’s dominate. The exact values are obtained by computing the probability that a mutant (with strategy located at the end of each arrow) fixates in
Van Segbroeck et al.
a)
1.0
1.0
!!!!!!!!!!!!!!! !!!! !! ! " " " " " " " " " " " " " " " " " ! " " " " ! ####### " #####
0.8 0.6 Cooperation
Cooperation
0.8
0.6
0.4
" !
0.2
0.2
#
#
"$$
0.0
0.0
# ### ## ##
"
0.4
#
#
$$
$
$$$ $$$
$$$$$$$
0
T=2.15
T=2.05 T=2.10
# $ 0
$$$$$$
10
10
20
20
30
Types
30
Types
T=2.20 40
40
50
50
b) Stationary distribution
6
0.08
0.08
0.06
0.06
Cooperators
0.04
0.04
Defectors 0.02
0.02
0.00 0.2 0.00
1 2 3 4 5 6 7 8 9 10 11 12 13 14 15 16 17 18 19 20 21 22 23 24 25 26 27 28 29 30 31 32 33 34 35 36 37 38 39 40 41 42 43 44 45 46 47 48 49 50
γ
0.8
(linking strategy)
Fig. 2. Cooperation and behavioral diversity. a) The population spends more time in a cooperative state (of any type) when the number of possible types (M ) increases, irrespective of the temptation to defect T in the prisoner’s dilemma. (N =100, β=0.1, α=0.4, δ=0.3, R=2, P =1, S=3−T ) b) While the majority of cooperator types is equally represented, only the slower types of defectors manage to survive. The defector population exhibits behavioral differences, which inhibits the dominance of slowest defector type, providing an escape hatch for cooperation to thrive (M =50, T =2.1, R=2, P =1, S=0.9).
a monomorphic population of individuals adopting the strategy located at the start of the arrow. We see that SD’s are clearly the winners of the evolutionary race. FD’s, on the other hand, are rendered disadvantageous with respect to any other strategy. When a FC manages to fixate, we end up in a rather stable scenario. In addition, SC’s acquire a transient character, providing an alternative route from FD to SD. In this specific case, it is, however, mainly the direct transition from FD’s into SD’s that hinders C’s survivability. As we will show below, the viability of C’s relies on the extent to which the transition FD → SD is inhibited compared to transitions into FC’s. We do now extend the analysis to an arbitrary number of linking strategies M , with rates for breaking adverse ties taken uniformly in the interval [0.5 − δ, 0.5 + δ]. This leads to a trivial generalization of payoff matrix (5). Figure 2a shows that cooperation blooms when the number of linking strategies M increases. In the following, we investigate the mechanism responsible for this remarkable performance of C’s? A first hint is provided in Figure 2b, where the fraction of time spent in each state of the population is shown for the case in which there are M = 50 possible types (linking strategies). Figure 2b shows that all types of C’s are present in the population, whereas the D’s who survive are only of the slowest types. Importantly, however, with increasing number of available types, the difference between the values of the rates associated with contiguous types is reduced, which provides a means for D’s other than the slowest to survive in the population. These are precisely the D’s who provide an escape hatch for C’s to survive (cf. Figure 1a), since many of them will be disadvantageous with respect to C’s. Indeed, Figure 2b shows that increasing the number of
Behavioral diversity and cooperation
7
possible types, D’s with break-up rates higher than the minimum γ are now able to survive. Although these individuals do not dominate, they effectively promote the appearance of fast C’s, since the transition D→C between these types is favored by natural selection. On the other hand, because all C-types are neutral with respect to each other, they end up fairly equally distributed in the population, unlike D’s for whom natural selection favors the slower types (cf. Figure 2b). Figure 1b also shows that, with increasing number of types, the number of C-types which are favored increases more than the corresponding number of D-types. As a result, all but the slowest D’s are disadvantageous with respect to (most of the) C’s. Increasing the number of types efficiently inhibits the transition from the fastest to the slowest D’s, paving the way for cooperation to thrive, an effect which remains valid irrespective of the model parameters, inasmuch as T and S are such that cooperators manage to survive. Mathematically, a large number of different types allows individuals to engage in a wider range of games and the complex set of different interactions allows the appearance of D’s from which C’s can profit.
4
Discussion
In social systems, individuals often behave differently when dealing with their social contacts. The present model shows that such diversity provides a perfect breeding ground for cooperation. Having individuals that think and behave differently creates a multi-dilemma environment [12,15] in which cooperation easily prevails, without any need for reputation, punishment or any other community enforcing mechanism. Together with other recent results that underline the importance of different forms behavioral diversity in the evolution of cooperation [17,19,21], this work supports the idea that diversity deserves to be considered as a fundamental mechanism towards the emergence of cooperative behavior. In addition, given the strong multi-cultural nature and inherent diversity in modern societies, the current prevailing minority-friendly policies may have resulted from the evolutionary advantages shown here. Finally, diversity in the way individuals organize their contacts may be important in other problems than the emergence of cooperative behavior. From spreading of infections diseases, in which individuals may react differently to a risk of infection from their neighbors, to spreading of computer viruses, where individual diversity in the resistance to pernicious attacks is common, the new mathematical framework presented in this article can be a valuable tool in the study of a broad spectrum of problems.
References 1. N. Buchan, R. Croson, and R. Dawes. Swift neighbors and persistent strangers: a cross-cultural investigation of trust and reciprocity in social exchange. Am. J. Soc., 108:168, 2002.
8
Van Segbroeck et al.
2. H. Gintis. Game Theory Evolving. Princeton University Press, Princeton, 2000. 3. C. Hauert, A. Traulsen, H. Brandt, M.A. Nowak, and K. Sigmund. Via freedom to coercion: The emergence of costly punishment. Science, 316(5833):1905, 2007. 4. J. Hofbauer and K. Sigmund. Evolutionary Games and Population Dynamics. Cambridge University Press, Cambridge, 1998. 5. L.A. Imhof, D. Fudenberg, and M.A. Nowak. Evolutionary cycles of cooperation and defection. P. Natl. Acad. Sci. U.S.A., 102(31):10797, 2005. 6. G. Kossinets and D.J. Watts. Empirical analysis of an evolving social network. Science, 311(5757):88, 2006. 7. J. Maynard Smith. Evolution and the Theory of Games. Cambridge University Press, Cambridge, 1982. 8. M. A. Nowak. Five rules for the evolution of cooperation. Science, 314:1560–1563, 2006. 9. M. A. Nowak, A. Sasaki, C. Taylor, and D. Fudenberg. Emergence of cooperation and evolutionary stability in finite populations. Nature, 428:646, 2004. 10. H. Ohtsuki, C. Hauert, E. Lieberman, and M. A. Nowak. A simple rule for the evolution of cooperation on graphs. Nature, 441:502–505, 2006. 11. J.M. Pacheco, A. Traulsen, and M.A. Nowak. Active linking in evolutionary games. J. Theor. Biol., 243:437, 2006. 12. J.M. Pacheco, A. Traulsen, and M.A. Nowak. Coevolution of strategy and structure in complex networks with dynamical linking. Phys. Rev. Lett., 97:258103, 2006. 13. A. Rapoport and A. M. Chammah. Prisoner’s Dilemma. Univ. of Michigan Press, Ann Arbor, 1965. 14. F.C. Santos and J.M. Pacheco. Scale-free networks provide a unifying framework for the emergence of cooperation. Phys. Rev. Lett., 95:098104, 2005. 15. F.C. Santos, J.M. Pacheco, and T. Lenaerts. Cooperation prevails when individuals adjust their social ties. PLoS Comput. Biol., 2(10):e140, 2006. 16. F.C. Santos, J.M. Pacheco, and T. Lenaerts. Evolutionary dynamics of social dilemmas in structured heterogeneous populations. P. Natl. Acad. Sci. U.S.A., 103(9):3490, 2006. 17. F.C. Santos, M.D. Santos, and J.M. Pacheco. Social diversity promotes the emergence of cooperation in public goods games. Nature, 454:213, 2008. 18. S. Van Segbroeck, F.C. Santos, A. Nowe, J.M. Pacheco, and T. Lenaerts. The evolution of prompt reaction to adverse ties. BMC Evol. Biol., 8(287), 2008. 19. G. Szab´ o and G. F´ ath. Evolutionary games on graphs. Phys. Rep., 446(4-6):97, 2007. 20. G. Szab´ o and C. T˝ oke. Evolutionary Prisoner’s Dilemma game on a square lattice. Phys. Rev. E, 58:69, 1998. 21. A. Szolnoki, M. Perc, and G. Szab´ o. Diversity of reproduction rate supports cooperation in the prisoner’s dilemma game on complex networks. Eur. Phys. J. B, 61:505, 2008. 22. A. Traulsen, M.A. Nowak, and J.M. Pacheco. Stochastic dynamics of invasion and fixation. Phys. Rev. E, 74:011909, 2006.