COMPANY UPDATE
Thailand
Electricity Generating (EGCO.BK/EGCO TB)*
ค่ อยๆสะสมกำลังกำรผลิตใหม่ ๆ
Outperform‧Maintained Price as of 1 Dec 2017
215.00
12M target price (Bt/shr)
260.00
Unchanged/Revised up(down)(%) Upside/downside (%)
n.a. 20.9
Key messages
จากการไม่มีกาลังการผลิตใหม่ๆในปี 2561 การเติบโตกาไรของ บริ ษทั จึงไม่น่าตื่นเต้นมากนักที่ 3.5% เทียบกับปี 2561 ที่ 13.4% อย่างไรก็ตามกาลังการผลิตใหม่ในปี 61 มีขนาดรวมที่ค่อนข้าง ใหญ่จะทาให้การเติบโตของกาไรน่าสนใจมากขึ้นที่ 7.3% และ เราคาดว่าการเติบโตของกาไรจะต่อเนื่องไปปี 2562 จากการ เดินเครื่ องของโรงไฟฟ้ าใหม่เต็มปี นอกจากนี้เรามองถึง มูลค่าเพิ่มที่จะได้รับกาหบริ ษทั ประสบความสาเร็ จในการพัฒนา โครงการโรงไฟฟ้ าถ่านหิ นที่เวียดนาม เราขยับไปใช้ราคา ณ ปลายปี 2561 ได้ราคาเป้ าหมายที่ 260 บาท โดยวิธีคิดลดกระแส เงินสด และเรายังคงคาแนะนา ซื้ อ โดยราคาปิ ดล่าราสุ ดมี upside ที่ 21% Trading data Mkt cap (Btbn/US$mn) Outstanding shares (mn) Foreign ownership (mn) 3M avg. daily trading (mn) 52-week trading range (Bt) Performance (% ) Absolute Relative
113.2/3188 526 167.0 0.6 194-237 3M 6M 12M -6.9 1.9 8.3 -11.2 -5.9 -3.5
Quarterly EPS Bt 2015 2016 2017
Q1 2.91 4.92 5.63
Q2 2.65 3.89 6.71
Q3 (0.29) 5.40 6.68
Q4 2.93 1.59 n.a.
Share price chart 240
15
230
10
220
5
210
0
200
(5)
190 Dec-16
Feb-17
Apr-17
Share Price
Source: SET
Voranart Meethavorn 66.2658.8888 Ext.8856
[email protected]
Jul-17
Sep-17
(10) Nov-17
Event งานประชุมนักวิเคราะห์และเข้าเยีย่ มชมโรงไฟฟ้ าพลังงานไซยะบุรีที่ประเทศลาว lmpact โรงไฟฟ้ำนำ้ เทิน1 ได้รับสัญญำซื้อขำยไฟฟ้ำแล้ว โรงไฟฟ้ าน้ าเทิน1ได้เซ็นสัญญาซื้อขายไฟฟ้ าระยะยาว 27ปี กับการไฟฟ้ าฝ่ ายผลิตที่กาลังการผลิต 514MW และการไฟฟ้ าลาวที่ 130MW ในวันที่ 27 กันยายน 2560 ทั้งนี้โรงการคาดว่าจะเดินเครื่ องเชิ งพาณิ ชย์ใน 2Q65 และผูท้ ี่หุ้นในโครงการได้แก่ EGCO 25% PSG 60% และ EDL-Gen 15% ความสาเร็ จในการลงทุน ครั้งนี้ตรงกับเป้ าหมายของบริ ษทั และความคาดหวังของเราที่บริ ษทั มุ่งขยายธุ รกิจไปใน ASEAN โดยเน้น ประเทศที่ธุรกิจอยูแ่ ล้ว และเป็ นการเพิ่มศักยภาพการขยายธุ รกิจในประเทศลาวในอนาคตทั้งนี้ เราได้รวม มูลค่าของโครงการดังกล่าวในการประเมินมูลค่าของเราแล้ว กำลังกำรผลิตจะเพิม่ อีก 708MW ในอีก 5 ข้ ำงหน้ ำ ณ สิ้ นเดือนตุลาคม บริ ษทั มีกาลังการผลิตที่เดินเครื่ องแล้วที่ 4.6GW และอีก 708MW คาดว่าจะทยอยเข้ามา ในช่วงปี 2562-65 (2562 ที่ 547MW และ 2565ที่ 161MW)จากการไม่มีกาลังการผลิตใหม่ๆในปี 2561การ เติบโตกาไรของบริ ษทั จึงไม่น่าตื่นเต้นมากนักที่3.5% เทียบกับปี 2561 ที่13.4%อย่างไรก็ตามกาลังการผลิต ใหม่ในปี 61 มีขนาดรวมที่ค่อนข้างใหญ่จะทาให้การเติบโตของกาไรน่ าสนใจมากขึ้นที่7.3%และเราคาดว่า การเติบโตของกาไรจะต่อเนื่ องไปปี 2562จากการเดินเครื่ องของโรงไฟฟ้ าใหม่เต็มปี นอกจากนี้ บริ ษทั กับ พันธมิตร คือ EGAT international (EGATi) และ Kyushu Electric Power อยูร่ ะหว่างการศึกษาและพัฒนา โครางการกวางจิ 1ซึ่งเป็ นโรงไฟฟ้ าถ่านหิ นที่ประเทศเวียดนามขนาดประมาณ 1.2GW เรามองว่าการลงทุน นี้ จะสร้างมูลค่าเพิ่มให้แก่บริ ษทั ได้เมื่อโครงการได้รับสัญญาซื้ อขายไฟฟ้ า แต่น่าจะต้องใช้เวลาสักระยะ หนึ่งในการดาเนินการ โครงกำรไซยะบุรี สี สันของปี 2561 เราได้เยีย่ มชมโครงการพลังงานน้ าไซยะบุรีเมื่อวานศุกร์ ที่ผ่านมา ทั้งนี้ งานก่อสร้างเดินหน้าได้ดว้ ยดี และ โครงการจะสามารถเริ่ มเดินเครื่ องเชิงพาณิ ชย์ได้ตามเป้ าในเดือนตุลาคม 2561 ทั้งนี้ บางส่ วนของ โครงการจะสามารถผลิตไฟฟ้ าได้ก่อนวัน ซึ่ งทางโครงการสามารถขายไฟฟ้ าที่ผลิตได้ให้แก่ EGAT ได้ โครงการนี้ เป็ นโรงไฟฟ้ าพลังงานน้ าแบบ run of river โครงการแรกในลุ่มน้ าโขงตอนล่าง เรามองว่า ความสาเร็ จของการพัฒนาโครงการนี้ จะเป็ นแรงผลักดันให้เกิดการพัฒนาโครงการอื่นๆที่มีศกั ยภาพใน ลุ่มน้ าโขงตอนล่างต่อไป Valuation & Action เราขยับไปใช้ราคา ณ ปลายปี 2561ได้ราคาเป้ าหมายที่260บาท โดยวิธีคิดลดกระแสเงินสด และเรายังคง คาแนะนา ซื้ อ โดยราคาปิ ดล่าราสุดมี upsideที่ 21% และเทรดที่ PERปี 61ในระดับต่าที่ 10.6x เปรี ยบเทียบ กับค่าเฉลี่ยกลุ่มที่ 21.0xนอกจากนี้เรามองว่าความหลากหลายของฐานการลงทุนในหลายประเทศ จะช่วง สร้างโอการของการลงทุนใหม่ๆให้แก่บริ ษทั ต่อไปในอนาคต Risks โครงการหยุดเดินเครื่ องโดยไม่ได้วางแผนล่วงหน้า และความล่าช้าของการก่อสร้างโรงไฟฟ้ าในอนาคต
Price performance relative to SET
Key financials and valuations Revenue (Btmn) Net Profit (Btmn) Normalized Profit (Btmn) EPS (Bt) DPS (Bt) EPS Growth (%) P/E(X) P/B (X) EV/EBITDA (X) Net Debt to Equity (%) Dividend Yield (%) Return on Average Equity (%)
Dec - 15A Dec - 16A 15,914 22,794 4,319 8,321 6,967 9,157 8.20 15.81 6.25 6.50 (43.7) 92.6 18.4 12.6 1.0 1.3 18.8 13.2 100.9 110.6 4.1 3.3 5.6 10.1
Dec - 17F Dec - 18F Dec - 19F 33,373 37,393 37,591 10,357 10,714 11,498 10,357 10,714 11,498 19.67 20.35 21.84 7.00 7.50 8.00 24.5 3.5 7.3 10.9 10.6 9.8 1.3 1.2 1.1 11.1 10.2 9.5 108.5 89.9 73.9 3.3 3.5 3.7 12.1 11.6 11.5
Source: Company data, KGI Research
December 4, 2017
*The Company may be issuer of Derivative Warrants on these securities. http://research.kgi.com; Bloomberg: KGIT
Please see back page for disclaimer
1
Thailand
Electricity Generating
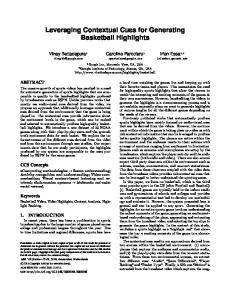
Figure 1: XPCL construction view
Figure 2: XPCL construction view
Source: Company data, KGI Research
Source: Company data, KGI Research
Figure 3: Mekong Mainstream Dams Map
Source: MRC, International River, KGI Research
December 4, 2017
*The Company may be issuer of Derivative Warrants on these securities. http://research.kgi.com; Bloomberg: KGIT
Please see back page for disclaimer
2
Thailand
Electricity Generating
Figure 4: EGCO’s portfolio สีสนั
Fuel used
Location
COD/SCOD
EGCO portion
Contracted capacity
Effective capacity
Natural Gas
Saraburi
May 07 & Mar 08
50.0%
1,468.0
734.0
Coal
Rayong
Oct 06 & Feb 07
50.0%
1,346.5
673.3
EGCO COGEN
Natural Gas
Rayong
Jan-03
80.0%
112.2
89.7
ROI-ETGREEN
Rice Husk
Roi-Et
May-03
70.3%
8.8
6.2
GEC-GCC
Natural Gas
Saraburi
Sep-98
50.0%
108.6
54.3
GEC-NKCC
Natural Gas
Saraburi
Oct-00
50.0%
121.3
60.7
GEC-SCC
Natural Gas
Samutprakarn
Aug-99
50.0%
114.5
57.2
GEC-GYG
Parawood
Yala
Nov-06
50.0%
20.2
10.1
NED
Solar
Lopburi
Dec-11
66.0%
63.0
41.6
SPP2
Solar
Saraburi
May-12
100.0%
8.0
8.0
SPP3
Solar
Srisaket
Feb-12
100.0%
8.0
8.0
SPP4
Solar
Srisaket/Ubon-Ratchatani
Jan-12
100.0%
6.0
6.0
SPP5
Solar
Roi-Et
Jun-12
100.0%
8.0
8.0
GPS(Phase 1-4)
Solar
Nakhon Sawan/Chai Nat/Petchaboon
Mar 12 & Feb 13
60.0%
26.0
15.6
TWF
Wind
Chaiyaphum
Jul-13
90.0%
6.9
6.2
Solarco
Solar
Nakornpathom/Suphanburi
Dec-13
49.0%
57.0
27.9
Power plants Operating project Domestic GEC-GPG (KK2) BLCP
GIDEC KN4 CWF
Waste
Songkla
Dec-14
50.0%
6.5
3.3
Natural Gas
Nakorn Sri Thammarat
Jun-16
100.0%
930.0
930.0
Wind
Chaiyaphum
Dec 16
90.0%
80.0
72.0
TJ Cogen
Natural Gas
Pathumthani
Jun 17
100.0%
102.0
102.0
TPCogen
Natural Gas
Ratchaburi
Oct 17
100.0%
113.0
113.0
SK Cogen
Natural Gas
Ratchaburi
Oct 17
100.0%
107.0
107.0
Oversea NTPC (NT2)
Hydro
Laos PDR
Apr-10
35.0%
1,070.0
374.5
QPL
Coal
Quezon, Philippines
May-00
100.0%
460.0
460.0
MPPCL #1&2
Coal
Luzon, Philippines
Jun 98 & Dec 98
49.0%
640.0
313.6
Geo Thermal
West Java, Indonesia
Jun 00 & Mar 09
20.0%
227.0
45.4
Wind
New South Wales, Australia
Nov-14
100.0%
113.0
113.0
Geo Thermal
West Java, Indonesia
1994, 1997, 2000, 2007
20.0%
637.0
SEG BRWF Salak and Darajat
Total operating project capacity Future project XPCL
127.4 4,568
Hydro
Laos PDR
Oct 19
12.5%
1,280.0
160.0
SBPL
Coal
Quezon, Philippines
Oct 19
49.0%
455.0
223.0
MPPCL #3
Coal
Luzon, Philippines
2Q19
49.0%
335.0
164.2
Hydro
Laos PDR
2022
25.0%
644.0
161.0
NT1
Total future project capacity
708
Source: Company data, KGI Research
December 4, 2017
*The Company may be issuer of Derivative Warrants on these securities. http://research.kgi.com; Bloomberg: KGIT
Please see back page for disclaimer
3
Thailand
Electricity Generating
Figure 4: Company profile
Figure 5: Earnings to grow in 2017-19
The Electricity Generating Public Company Limited (EGCO) was
Profit growth, percent (LHS); Core profit, btbn (RHS)
the first independent power producer in Thailand. The company has
40.0
14.0
invested in power production, power distribution and power-related
30.0
12.0
business in Thailand and ASEAN. EGCO’s portfolio consists of
20.0
various
power
power,
and
plant
types,
renewable
namely
energy.
gas-fired,
To
achieve
coal-fired,
sustainable
hydro growth,
EGCO continues researching new Greenfield and Brownfield projects
10.0 8.0
10.0
6.0
0.0
4.0
(10.0)
2.0
(20.0)
0.0
both in Thailand and ASEAN.
2015A
2016A Core profit
2017F
Source: Company data
Source: Company data, KGI Research
Figure 6: New capacity to be added until 2022
Figure 7: Expansion program
2018F 2019F Core profit growth
Power capacity, GW 5.5
2018
2017
2019
...
2022
5.0
4.5
TJCogen (106MWe)
XPCL (160MWe)
TPCogen (113MWe)
SBPL (223MWe)
SKCogen (107MWe)
MPPCL#3 (49MWe)
NT1 (163MWe)
4.0 3.5 3.0
2016A
2017F
2018F
2019F
2020F
2021F
2022F
Source: Company data, KGI Research
Source: Company data, KGI Research
Figure 8: Offer dividend yield 3-4%
Figure 9: Company’s yield band
Dividend per share, baht (LHS); Dividend yield, percent (RHS)
Yield band, percent
9.0
5.0
8.0
4.0
7.0
3.0
6.0
2.0
5.0
1.0
4.0
7.0 +2.0 sd = 5.8%
+1.0 sd = 5.0%
5.0
Average = 4.2% -1.0 sd = 3.3%
3.0
-2.0 sd = 2.5%
0.0 2014A
2015A
2016A
2017F
Dividend per share
2018F
1.0 2012
2019F
2013
2014
2015
2016
2017F
2018F
Dividend yield
Source: Company data, KGI Research
Source: Company data, KGI Research
Figure 10: Company’s PER
Figure 11:Company’s PBV
PER, times
PBV, times
18.0
1.7
15.0
+2.0 sd = 1.4x
+2.0 sd = 13.7x
1.4
+1.0 sd = 12.2x
+1.0 sd = 1.3x
12.0 Average = 10.6x -1.0 sd = 9.1x -2.0 sd = 7.6x
9.0 6.0 3.0 2012
1.1 Average = 1.1x -1.0 sd = 0.9x
0.8
-2.0 sd = 0.8x 2013
Source: KGI Research
December 4, 2017
2014
2015
2016
2017F
2018F
0.5 2012
2013
2014
2015
2016
2017F
2018F
Source: KGI Research
*The Company may be issuer of Derivative Warrants on these securities. http://research.kgi.com; Bloomberg: KGIT
Please see back page for disclaimer
4
Thailand
Electricity Generating
Quarterly Income Statement Income Statement (Bt mn) Revenue Cost of Goods Sold Gross Profit Operating Expenses Other incomes Operating Profit Depreciation of fixed assets Operating EBITDA Non-Operating Income Interest Income Other Non-op Income Non-Operating Expenses Interest Expenses Other Non-op Expenses Equity Income/(Loss) Pre-tax Profit Current Taxation Minorities Extraordinary items Net Profit Normalized Profit EPS (Bt) Normalized EPS (Bt) Margins Gross profit margin Operating EBIT margin Operating EBITDA margin Net profit margin Growth Revenue growth Operating EBIT growth Operating EBITDA growth Net profit growth Normalized profit growth
Mar-14A
Jun-14A
Sep-14A
Dec-14A
Mar-15A
Jun-15A
Sep-15A
Dec-15A
Mar-16A
Jun-16A
Sep-16A
Dec-16A
Mar-17A
Jun-17A
Sep-17A
4,201 (2,617) 1,584 (622) 0 961 (515) 1,899 389 422 (33) (271) (271) 0 1,349 2,429 88 (32) 0 2,485 2,518 4.72 4.78
4,365 (2,609) 1,756 (753) 0 1,003 (520) 1,998 509 475 34 (575) (575) 0 2,004 2,941 (475) (40) 44 2,471 2,392 4.69 4.54
4,212 (2,499) 1,713 (668) 0 1,045 (532) 2,041 619 465 154 (721) (721) 0 1,490 2,433 (218) (43) 41 2,213 2,018 4.20 3.83
4,120 (2,502) 1,618 (901) 0 717 (567) 1,771 (225) 487 (712) (526) (526) 0 617 583 (147) (24) 0 413 1,125 0.78 2.14
3,479 (2,494) 986 (594) 0 391 (494) 1,273 644 387 256 (648) (648) 0 1,269 1,655 (120) (3) 0 1,533 1,276 2.91 2.42
4,226 (2,531) 1,695 (436) 0 1,258 (600) 2,174 (656) 590 (1,246) (684) (684) 0 1,988 1,906 (238) (43) 47 1,397 2,597 2.65 4.93
4,205 (2,497) 1,709 (701) 0 1,008 (597) 2,128 (1,574) 522 (2,097) (778) (778) 0 1,625 281 (430) (26) 24 (151) 1,921 (0.29) 3.65
4,004 (2,413) 1,591 (1,128) 0 464 (568) 1,439 1,200 393 806 (304) (787) 483 1,067 2,426 38 (16) 44 1,541 1,173 2.93 2.23
4,124 (2,734) 1,389 (704) 130 815 (558) 1,779 993 406 587 (861) (861) 0 1,890 2,837 (228) (19) 0 2,590 2,003 4.92 3.80
4,456 (2,591) 1,865 (852) (202) 811 (642) 2,041 339 587 (248) (792) (792) 0 2,041 2,399 (325) (27) 0 2,048 2,296 3.89 4.36
7,427 (5,053) 2,374 (556) (85) 1,734 (557) 2,725 498 434 64 (991) (991) 0 1,874 3,115 (259) (11) 0 2,845 2,781 5.40 5.28
6,788 (4,462) 2,326 (940) 1,939 3,325 (623) 2,400 (2,051) (1,322) (729) (531) (1,040) 509 1,571 2,314 (228) (4) 0 839 2,077 1.59 3.94
6,286 (4,680) 1,605 (570) (264) 772 (668) 1,936 1,683 497 1,186 (972) (972) 0 1,707 3,189 (218) (8) 0 2,963 1,777 5.63 3.38
7,151 (4,947) 2,204 (595) (276) 1,333 (668) 2,594 1,055 593 462 (982) (982) 0 2,429 3,835 (297) (8) 0 3,530 3,068 6.71 5.83
7,928 (5,399) 2,530 (610) (334) 1,586 (709) 2,889 1,094 594 500 (1,047) (1,047) 0 2,152 3,785 (258) (10) 0 3,517 3,017 6.68 5.73
37.7 22.9 45.2 59.2
40.2 23.0 45.8 56.6
40.7 24.8 48.5 52.5
39.3 17.4 43.0 10.0
28.3 11.3 36.6 44.1
40.1 29.8 51.5 33.1
40.6 24.0 50.6 (3.6)
39.7 11.6 35.9 38.5
33.7 19.8 43.2 62.8
41.9 18.2 45.8 45.9
32.0 23.3 36.7 38.3
34.3 49.0 35.4 12.4
25.5 12.3 30.8 47.1
30.8 18.6 36.3 49.4
31.9 20.0 36.4 44.4
3.9 4.4 5.2 (0.6) (5.0)
(3.5) 4.1 2.1 (10.4) (15.7)
(2.2) (31.4) (13.3) (81.3) (44.3)
(15.6) (45.4) (28.1) 271.4 13.5
21.5 221.5 70.9 (8.8) 103.5
(0.5) (19.9) (2.1) N/A (26.0)
(4.8) (54.0) (32.4) N/A (39.0)
3.0 75.8 23.6 68.1 70.8
8.1 (0.4) 14.7 (20.9) 14.6
66.7 113.7 33.5 38.9 21.1
(8.6) 91.8 (11.9) (70.5) (25.3)
(7.4) (76.8) (19.3) 253.3 (14.4)
13.8 72.6 33.9 19.1 72.6
10.9 19.0 11.4 (0.4) (1.7)
(24.7) 413.3 (22.4) 969.5 8,690.9
Source: KGI Research
Peer comparison – Key valuation stats Rating
Target price (Bt)
Current price (Bt)
Upside (%)
16 core EPS (Bt)
17F core EPS (Bt)
18F core EPS (Bt)
17F EPS gr. (%)
26.00 32.00 3.20 260.00 88.00 50.00 66.00 8.50
26.00 27.50 3.98 215.00 85.75 57.00 56.00 7.60
0.0 16.4 (19.6) 20.9 2.6 (12.3) 17.9 11.8
0.69 1.37 0.04 17.39 5.98 1.80 3.82 0.58
0.62 1.96 0.04 19.67 5.82 2.04 4.73 0.41
0.90 2.03 0.08 20.35 5.76 2.75 5.02 0.45
(9.9) 43.2 18.8 13.1 (2.7) 13.3 23.7 (29.5)
46.3 3.9 85.0 3.5 (1.0) 35.0 6.1 9.7
42.1 14.1 95.6 10.9 14.7 27.9 11.8 18.7 29.5
28.8 13.5 51.7 10.6 14.9 20.7 11.2 17.0 21.0
2.7 1.8 1.0 1.3 2.1 2.1 1.2 2.5 1.9
2.4 1.7 0.9 1.2 2.1 2.0 1.1 2.3 1.7
1.0 2.8 1.5 3.3 6.7 2.3 4.6 2.1 3.0
1.4 3.0 1.6 3.5 6.7 3.1 4.9 2.3 3.3
6.4 13.1 1.0 12.1 14.5 7.6 10.1 13.5 9.8
8.5 12.6 1.8 11.6 13.9 9.8 10.2 13.6 10.2
20.00 4.90 22.00
21.80 4.14 15.10
(8.3) 18.4 45.7
0.70 0.09 0.50
1.06 0.13 0.75
1.23 0.24 1.10
50.5 46.2 50.6
16.2 86.6 45.4
20.6 32.0 20.0 24.2
17.7 17.2 13.8 16.2
3.0 2.9 2.3 2.7
2.8 2.7 1.9 2.5
2.4 1.6 2.0 2.0
2.8 2.9 2.9 2.9
14.6 9.1 11.3 11.6
15.6 15.6 13.9 15.0
Conventional BGRIM N BPP* OP CKP* U EGCO* OP GLOW* N GPSC* N RATCH* OP WHAUP N Sector Renewable BCPG* N GUNKUL* OP TPCH OP Sector Rating Neutral
18F EPS 17F PER 18F PER 17F PBV 18F PBV 17F Div 18F Div 17F ROAE 18F ROAE gr. (%) (x) (x) (X) (X) Yield (%) Yield (%) (%) (%)
Source: KGI Research
December 4, 2017
*The Company may be issuer of Derivative Warrants on these securities. http://research.kgi.com; Bloomberg: KGIT
Please see back page for disclaimer
5
Thailand
Electricity Generating
Balance Sheet As of 31 Dec (Bt mn) Total Assets Current Assets Cash & ST Investments Inventories Accounts Receivable Others Non-current Assets LT Investments Net fixed Assets Others Total Liabilities Current Liabilities Accounts Payable ST Borrowings Others Long-term Liabilities Long-term Debts Others Shareholders' Equity Common Stock Capital Surplus Retained Earnings Preferred Stock
Profit & Loss 2015 179,812 19,403 10,888 0 2,468 6,048 97,825 9,610 72,527 15,687 102,062 15,919 628 858 14,433 86,144 78,314 7,830 77,750 526 8,601 58,513 0
2016 197,254 19,998 9,301 0 2,178 8,518 91,306 12,347 62,420 16,539 114,657 13,393 1,967 0 11,426 101,264 92,691 8,573 82,598 526 8,601 63,411 0
2017F 199,203 17,119 7,414 0 3,189 6,516 77,079 (6,975) 68,093 15,960 113,909 6,358 2,002 0 4,356 107,551 98,372 9,179 85,294 526 8,601 70,083 0
2018F 197,690 18,778 7,998 0 3,574 7,206 69,180 (10,356) 64,195 15,341 105,474 11,096 2,244 0 8,852 94,378 84,960 9,418 92,216 526 8,601 76,849 0
2019F 195,681 18,751 7,785 0 3,594 7,372 58,934 (16,008) 60,297 14,645 96,011 11,033 2,255 0 8,777 84,979 75,549 9,430 99,670 526 8,601 84,135 0
Source: KGI Research
Source: KGI Research
December 4, 2017
2015 15,914 (9,934) 5,980 (2,859) 2,153 5,274 (2,259) 10,198 (2,280) 0 (2,280) (3,381) (2,898) (483) 5,948 5,561 (750) (87) 0 4,319 6,967 8.20 13.23
2016 22,794 (14,840) 7,954 (3,051) 2,113 7,016 (2,380) 15,486 (327) 0 (327) (4,193) (3,684) (509) 7,376 9,872 (1,040) (60) 0 8,321 9,157 15.81 17.39
2015 6,303 4,319 2,259 7,383 (7,658) (7,302) (19,511) 944 (1,315) (999) 2,546 0 8,777 (6,231) 1,547
2016 9,159 8,321 2,380 5,592 (7,134) (17,046) 7,727 (21,840) (2,933) (7,887) 3,696 0 11,214 (7,518) (4,191)
2017F 33,373 (24,168) 9,205 (4,107) 2,107 7,205 (3,898) 18,600 0 0 0 (3,536) (3,536) 0 7,485 11,154 (666) (143) 0 10,357 10,357 19.67 19.67
2018F 37,393 (27,584) 9,809 (4,354) 2,325 7,781 (3,898) 19,297 0 0 0 (3,863) (3,863) 0 7,608 11,526 (666) (156) 0 10,714 10,714 20.35 20.35
2019F 37,591 (27,714) 9,877 (4,493) 2,216 7,601 (3,898) 19,755 0 0 0 (3,560) (3,560) 0 8,242 12,283 (630) (168) 0 11,498 11,498 21.84 21.84
Source: KGI Research
Key Ratios Year to 31 Dec Growth (% YoY) Sales OP EBITDA NP Normalized Profit EPS Normalized EPS Profitability (%) Gross Margin Operating Margin EBITDA Margin Net Profit Margin ROAA ROAE Stability Gross Debt/Equity (%) Net Debt/Equity (%) Interest Coverage (x) Interest & ST Debt Coverage (x) Cash Flow Interest Coverage (x) Cash Flow/Interest & ST Debt (x) Current Ratio (x) Quick Ratio (x) Net Debt (Bt mn) Per Share Data (Bt) EPS Normalized EPS CFPS BVPS SPS EBITDA/Share DPS Activity Asset Turnover (x) Days Receivables Days Inventory Days Payable Cash Cycle Key driver Effective capacity (MW)
Year to 31 Dec (Bt mn) Revenue Cost of Goods Sold Gross Profit Operating Expenses Other Incomes Operating Profit Depreciation of fixed assets Operating EBITDA Non-Operating Income Interest Income Other Non-op Income Non-Operating Expenses Interest Expenses Other Non-op Expenses Equity Income/(Loss) Pre-tax Profit Current Taxation Minorities Extraordinary items Net Profit Normalized Profit EPS(Bt) Normalized EPS(Bt)
Cash Flow 2015
2016
2017F
2018F
2019F
(5.8) (14.7) (19.1) (43.7) (13.5) (43.7) (13.5)
43.2 38.1 51.8 92.6 31.4 92.6 31.4
46.4 9.9 20.1 24.5 13.1 24.5 13.1
12.0 7.9 3.7 3.5 3.5 3.5 3.5
0.5 (2.3) 2.4 7.3 7.3 7.3 7.3
37.6 29.9 64.1 27.1 2.4 5.6
34.9 28.8 67.9 36.5 4.2 10.1
27.6 21.6 55.7 31.0 5.2 12.1
26.2 20.8 51.6 28.7 5.4 11.6
26.3 20.3 52.6 30.6 5.9 11.5
1.3 1.0 2.7 2.1 2.2 1.7 1.2 1.2 78,441
1.4 1.1 3.6 3.6 2.5 2.5 1.5 1.5 91,363
1.3 1.1 4.2 4.2 (0.7) (0.7) 2.7 2.7 92,573
1.1 0.9 4.0 4.0 1.2 1.2 1.7 1.7 82,874
1.0 0.7 4.5 4.5 1.4 1.4 1.7 1.7 73,675
8.2 13.2 12.0 147.7 30.2 19.4 6.3
15.8 17.4 17.4 156.9 43.3 29.4 6.5
19.7 19.7 (4.9) 162.0 63.4 35.3 7.0
20.4 20.4 9.0 175.2 71.0 36.7 7.5
21.8 21.8 9.7 189.3 71.4 37.5 8.0
0.1 56.6 0.0 23.1 33.5
0.1 34.9 0.0 48.4 (13.5)
0.2 34.9 0.0 30.2 4.6
0.2 34.9 0.0 29.7 5.2
0.2 34.9 0.0 29.7 5.2
3,797
4,119
4,670
4,670
5,217
Year to 31 Dec (Bt mn) Operating Cash Flow Net Profit Depreciation & Amortization Change in Working Capital Others Investment Cash Flow Net CAPEX Change in LT Investment Change in Other Assets Free Cash Flow Financing Cash Flow Change in Share Capital Net Change in Debt Change in Other LT Liab. Net Cash Flow
2017F 2018F 2019F (2,588) 4,716 5,123 10,357 10,714 11,498 3,898 3,898 3,898 (9,501) (2,443) (2,199) (7,342) (7,453) (8,074) 9,069 8,981 8,590 (9,572) 0 0 4,010 1,723 1,526 14,630 7,257 7,064 6,481 13,697 13,713 (8,363) (12,908) (13,455) 0 0 0 (555) (9,115) (9,412) (7,807) (3,793) (4,043) (1,882) 789 258
Source: KGI Research
Rates of Return on Invested Capital Year 2015 2016 2017F 2018F 2019F Year 2015 2016 2017F 2018F 2019F Year 2015 2016 2017F 2018F 2019F
+ COGS Revenue 48.2% 54.7% 60.7% 63.3% 63.4% 1/ Working Capital + Revenue 0.5 0.2 -0.3 -0.1 -0.1 x Operating Margin 6.1% 12.2% 9.0% 8.4% 8.4%
1-
Depreciation Revenue 14.2% 10.4% 11.7% 10.4% 10.4% Net PPE Revenue 4.6 2.7 2.0 1.7 1.6 Capital Turnover 0.1 0.1 0.2 0.2 0.2
+
+
x
Operating Exp. = Operating Revenue Margin 31.5% 6.1% 22.7% 12.2% 18.6% 9.0% 17.9% 8.4% 17.8% 8.4% Other Assets = Capital Revenue Turnover 6.7 0.1 5.9 0.1 3.9 0.2 3.6 0.2 3.6 0.2 = After-tax Return Cash Tax Rate on Inv. Capital 14.9% 0.1% 11.0% 0.2% 6.0% 0.1% 5.8% 0.1% 5.1% 0.1%
Source: KGI Research
*The Company may be issuer of Derivative Warrants on these securities. http://research.kgi.com; Bloomberg: KGIT
Please see back page for disclaimer
6
Thailand
Electricity Generating
Electricity Generating – Recommendation & target price history Date 20-Apr-17 09-Aug-17
250 240
Rating Outperform Outperform
Target 242.00 250.00
Price 218.00 223.00
230
220 210 200 190 180 Dec-16
Dec-16
Jan-17
Mar-17
Mar-17
Apr-17
Share price
May-17
Jun-17
Target price lowered
Jul-17
Aug-17
Sep-17
Oct-17
Nov-17
Target price raised
Source: KGI Research
KGI Locations
ChinaShanghai
Room 1907-1909, Tower A, No. 100 Zunyi Road, Shanghai, PRC 200051
Shenzhen
Room 24D1, 24/F, A Unit, Zhen Ye Building,2014 Bao’annan Road, Shenzhen, PRC 518008
TaiwanTaipei
700 Mingshui Road, Taipei, Taiwan Telephone886.2.2181.8888 ‧
Hong Kong
Facsimile886.2.8501.1691
41/F CentralPlaza, 18 Harbour Road, Wanchai, Hong Kong Telephone 852.2878.6888
ThailandBangkok
Facsimile 852.2878.6800
8th - 11th floors, AsiaCentreBuilding 173 South Sathorn Road, Bangkok10120, Thailand Telephone 66.2658.8888
KGI's Ratings
Facsimile 66.2658.8014
Rating
Definition
Outperform (OP)
The stock's excess return* over the next twelve months is ranked in the top 40% of KGI's coverage universe in the related market (e.g. Taiwan).
Neutral (N)
The stock's excess return* over the next twelve months is ranked in the range between the top 40% and the bottom 40% of KGI's coverage universe in the related market (e.g. Taiwan).1.3
Under perform (U)
The stock's excess return* over the next twelve months is ranked in the bottom 40% of KGI's coverage universe in the related market (e.g. Taiwan).
Not Rated (NR)
The stock is not rated by KGI Securities.
Restricted (R)
KGI policy and/or applicable law regulations preclude certain types ofcommunications, including an investment recommendation, during the course of KGI's engagement in an investment banking transaction and in certain other circumstances.
Excess return = 12M target price/current priceNote
Disclaimer
December 4, 2017
KGI Securities no event shall profits, arising to buy or sell
When an analyst publishes a new report on a covered stock, we rank the stock's excess return with those of other stocks in KGI's coverage universe in the related market. We will assign a rating based on its ranking. If an analyst does not publish a new report on a covered stock, its rating will not be changed automatically. (Thailand) Plc. (“The Company”) disclaims all warranties with regards to all information contained herein. In the Company be liable for any direct, indirect or any damages whatsoever resulting from loss of income or by utilization and reliance on the information herein. All information hereunder does not constitute a solicitation any securities but constitutes our sole judgment as of this date and are subject to change without notice.
*The Company may be issuer of Derivative Warrants on these securities. http://research.kgi.com; Bloomberg: KGIT
Please see back page for disclaimer
7