World Academy of Science, Engineering and Technology 12 2005
Effects of Hidden Unit Sizes and Autoregressive Features in Mental Task Classification Ramaswamy Palaniappan, and Nai-Jen Huan Electroencephalogram (EEG) signals recorded at the scalp during particular mental tasks have been used by some of the research groups [3-8]. Some others have utilised single-trial visual evoked potential signals where the subjects gaze at a screen full of alphabets or menus. Syncronisation and desynchronisation of µ-rhythm extracted during sensory motor tasks is another method for BCI design [9-11]. Reviews of some of these technologies and developments in this area are given by Vaughan et al [1], Wolpaw et al [2] and Mason and Birch [6]. In this paper, we adopted classification of EEG signals extracted during mental tasks for our BCI design. The advantage of this method over the other existing BCIs is that it does not require any in-between interface but the choice of mental tasks, feature extraction methods and classifiers could affect the performance greatly. Therefore, our objective in this paper is to study the performance of a bi-state BCI design across different mental task combinations, 3 different AR feature extraction methods and 2 sets of hidden units (HU); one higher and one lower. The EEG signals were recorded during 5 different mental tasks from 4 healthy subjects. These mental tasks were: geometrical figure rotation, mathematical multiplication, mental letter composing, visual counting and a baselineresting task. The 3 different feature extraction methods were
Abstract—Classification of electroencephalogram (EEG) signals
extracted during mental tasks is a technique that is actively pursued for Brain Computer Interfaces (BCI) designs. In this paper, we compared the classification performances of univariateautoregressive (AR) and multivariate autoregressive (MAR) models for representing EEG signals that were extracted during different mental tasks. Multilayer Perceptron (MLP) neural network (NN) trained by the backpropagation (BP) algorithm was used to classify these features into the different categories representing the mental tasks. Classification performances were also compared across different mental task combinations and 2 sets of hidden units (HU): 2 to 10 HU in steps of 2 and 20 to 100 HU in steps of 20. Five different mental tasks from 4 subjects were used in the experimental study and combinations of 2 different mental tasks were studied for each subject. Three different feature extraction methods with 6th order were used to extract features from these EEG signals: AR coefficients computed with Burg’s algorithm (ARBG), AR coefficients computed with stepwise least square algorithm (ARLS) and MAR coefficients computed with stepwise least square algorithm. The best results were obtained with 20 to 100 HU using ARBG. It is concluded that i) it is important to choose the suitable mental tasks for different individuals for a successful BCI design, ii) higher HU are more suitable and iii) ARBG is the most suitable feature extraction method.
Keywords—Autoregressive, Brain-Computer Electroencephalogram, Neural Network.
O
Interface,
•
6th order autoregressive (AR) coefficients computed with Burg’s algorithm (ARBG)
•
6th order autoregressive (AR) coefficients computed with stepwise Least Squares algorithm (ARLS)
•
6th order multivariate autoregressive (MAR) coefficients computed with stepwise Least Squares algorithm
I. INTRODUCTION
VER the last ten years, the volume and pace of Brain Computer Interface (BCI) research have grown tremendously [1, 2]. In 1995 there were no more than six active BCI research groups, and in the year 2000, there were more than 20 [2]. BCI designs are very useful for completely paralysed individuals to communicate with their external surroundings using their brain thoughts. These individuals could have become completely paralysed after being involved in an accident or due to some diseases. BCI designs are also suitable for use in simple hands off menu selection on the screen. There are a few non-invasive methods for obtaining these brain signals to be utilised in a BCI design.
These features were then used by a MLP-BP NN with single hidden layer which consisted of •
2 to 10 HU in steps of 2, or
•
20 to 100 HU in steps of 20
to classify different combinations of 2 mental tasks. Two mental tasks were chosen because the output of the studied BCI design is bi-state. The output of this BCI design could be used with some translation schemes like Morse Code [7] or to control the movement of a cursor to select a target on a computer screen, which would provide a communication channel for paralysed individuals to communicate with others.
R.Palaniappan is with the Dept. of Computer Science, University of Essex, Colchester, CO4 3SQ, United Kingdom (phone: +44-(0)1206872773, e-mail:
[email protected];
[email protected]) N. Huan is with the Faculty of Information Science and Technology, Multimedia University, Malaysia (e-mail:
[email protected]).
171
World Academy of Science, Engineering and Technology 12 2005
which the drawing was removed and the subjects were asked to visualise the object being rotated about an axis. The EEG signals were recorded during the mental rotation period. d) Mental letter composing task. The subjects were asked to mentally compose a letter to a friend or a relative without vocalising. Since the task was repeated several times the subjects were told to continue with the letter from where they left off. e) Visual counting task. The subjects were asked to imagine a blackboard and to visualise numbers being written on the board sequentially, with the previous number being erased before the next number was written. The subjects were instructed not to verbalise the numbers but to visualise them. They were also told to resume counting from the previous task rather than starting over each time. Keirn and Aunon [5] specifically chose these tasks since they involve hemispheric brainwave asymmetry (except for the baseline task). For example, it was shown by Osaka [13] that arithmetic tasks exhibit a higher power spectrum in the right hemisphere whereas visual tasks do so in the left hemisphere. As such, Keirn and Aunon [5] and later Anderson et al [3] proposed that these tasks are suitable for braincomputer interfacing.
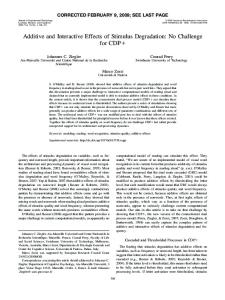
II. METHODOLOGY A. Data The EEG data used in this study were collected by Keirn and Aunon [5]. The subjects were seated in an Industrial Acoustics Company sound controlled booth with dim lighting and noise-less fan (for ventilation). An Electro-Cap elastic electrode cap was used to record EEG signals from positions C3, C4, P3, P4, O1 and O2 (shown in Figure 1), defined by the 10-20 system [12] of electrode placement. The impedances of all electrodes were kept below 5 KΩ. Measurements were made with reference to electrically linked mastoids, A1 and A2. The electrodes were connected through a bank of amplifiers (Grass7P511), whose band-pass analog filters were set at 0.1 to 100 Hz. The data were sampled at 250 Hz with a Lab Master 12-bit A/D converter mounted on a computer. Before each recording session, the system was calibrated with a known voltage. Signals were recorded for 10s during each task and each task was repeated for 10 sessions where the sessions were held on different weeks. The EEG signal for each mental task was segmented into 20 segments with length 0.5 s, so each EEG segment was 125 samples in length.
C3 A1
B. Feature Extraction In this paper, we have used 3 different AR feature extraction methods to extract features from the EEG signals and then classifying the features using 2 sets of different number of HU in the MLP-BP NN architecture. In the first method, AR coefficients were computed using Burg’s method [14-16]. In the second method, AR parameters were estimated by using stepwise Least Square algorithm with data from a single channel used at a time and in the third method, the multivariate AR coefficients were estimated using stepwise Least Square algorithm with data from 6 channels used all at once. The following discussion details the 3 different feature extraction processes.
C4 EEG
P3 O1
P4
A2
O2
Fig. 1 Electrode placement
In this paper, EEG signals from 4 subjects performing 5 different mental tasks were used1. In the original dataset, there were 7 subjects participating in the study but we chose only 4 subjects here as the other 3 had fewer than 10 sessions or some errors in the recording. These mental tasks were: a) Baseline task. The subjects were asked to relax and think of nothing in particular. This task was used as a control and as a baseline measure of the EEG signals. b) Math task. The subjects were given nontrivial multiplication problems, such as 42 times 18 and were asked to solve them without vocalising or making any other physical movements. The tasks were non-repeating and designed so that an immediate answer was not apparent. The subjects verified at the end of the task whether or not he/she arrived at the solution and no subject completed the task before the end of the 10 s recording session. c) Geometric figure rotation task. The subjects were given 30 s to study a particular three-dimensional block object, after 1 The data is available http://www.cs.colostate.edu/eeg/index.html#Data.
online
1) 6th order AR coefficients with Burg’s algorithm A real valued, zero mean, stationary, nondeterministic, autoregressive process of order p is given by p
x ( n ) = − ∑ a k x ( n − k ) + e( n ) , k =1
(1)
where p is the model order, x(n) is the signal at the sampled point n, ak are the real valued AR coefficients and e(n) represents the error term independent of past samples. The term autoregressive implies that the process x(n) is seen to be regressed upon previous samples of itself. The error term is assumed to be a zero mean noise with finite variance, σ p2 . In applications, the values of ak and σ p2 have to be estimated from finite samples of data x(1), x(2), x(3), … ,x(N). In this paper, we used Burg’s method [14-16] to estimate the AR coefficients. The method is more accurate as compared to other methods like Levinson-Durbin as it uses the data point directly. Furthermore, Burg algorithm uses
at
172
World Academy of Science, Engineering and Technology 12 2005
more data points by minimising both forward error and backward error. Order 6 was used for the AR process because other researchers [3, 5] have suggested the use of order 6 for AR process for mental task classification. Therefore, we had 6 AR coefficients for each channel, giving a total of 36 features for each EEG segment from a mental task.
this study. Both the hidden and output layer used hyperbolic tangent function as activation function. The inputs were normalised from -1 to 1 using the minimum and maximum value of each feature as this would improve the NN training. As mentioned earlier, for experiments involving ARBG and ARLS, the number of inputs was 36 while for MAR, it was 216. Weights and biases were initialised according to the Nguyen-Widrow algorithm. This algorithm chooses values in order to distribute the active region of each neuron in the unit evenly across the unit's input space. Advantages of this initialisation over purely random weights and biases are faster training and the use of more or all the available hidden units. BP algorithm with adaptive learning rate and momentum stabilisation was used to train the MLP NN. This training algorithm was chosen after some preliminary experiments. The output units were set at 2 so that the NN could classify into either of the 2 categories representing the mental task. There were 2 experiments conducted with different number of HU:
2) 6th order AR coefficients with stepwise least square algorithm An m-variate AR(p) model for a stationary time series of state vectors vv ∈ ℜ m , observed at equally spaced instants v, is defined by p
v v = w + ∑ Ai vv −i + ε v , ε v = noise(C ) , i =1
where
the
m-dimensional
vectors
(2)
ε v = noise(C ) are
uncorrelated random vectors with mean zero and covariance matrix C ∈ ℜ mxm , and the matrices A1, A2, ..., Ap ∈ ℜ mxm are the coefficient matrices of the AR model [19]. The parameter vector w ∈ ℜ m is a vector of intercept terms that is included to allow for a nonzero mean of the time series,
= (I-A1-...-Ap)-1w,
• 2 to 10 in steps of 2, and • 20 to 100 in steps of 20 In other words, one experiment was conducted with 2, 4, 6, 8, 10 HU and the other with 20, 40, 60, 80, 100 HU. A total of 200 EEG patterns (20 segments for EEG each signal x 10 sessions) were used for each subject for each mental task in all the experiments. Therefore, for each experiment, there were 400 EEG patterns from 2 mental tasks, where half of the patterns were used in training and the remaining half in testing. A modified 10 fold cross validation technique was used to increase the reliability of the results. In this method, the entire data for an experiment (i.e. 400 EEG patterns) were split into 10 parts. Training and testing were conducted for 5 times where for each time, we used 5 randomly selected parts for training and the rest 5 different parts for testing. So for each HU size, the MLP-BP training and testing were repeated for 5 times. Overall, the training and testing were repeated for 6000 times (10 HU sizes x 10 mental task combinations x 3 features extraction methods x 5 cross-validation repetitions x 4 subjects). Training was conducted until the mean square error (between desired and target) fell below 0.0001 or reached a maximum iteration limit of 1000. The mean square error denotes the error limit to stop NN training. The desired target output was set to 1.0 for the particular category representing the mental task of the EEG pattern being trained, while for the other category, it was set to 0. Figure 3 shows the overall flow of the methodology.
(3)
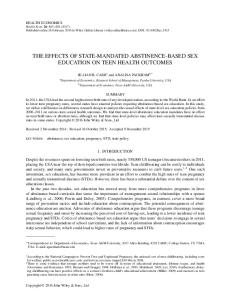
where < • > denoted an expected value. If the coefficient matrices A1, A2, ..., Ap and the intercept vector w of an AR model are estimated with the method of ∧ least squares, the residual covariance matrix C of the estimated model is a fairly reliable estimator of the noise covariance matrix C. The least squares estimates of AR parameters are obtained by casting an AR model in the form of an ordinary regression model and estimating the parameters of regression model with the method of least squares. The least squares modeling criterion is widely used in connection with the AR model because it is particularly suitable for solving the related optimization problem [17]. Numerically, the least squares problem for the ordinary regression model can be solved with standard methods that involve the factorization of a data matrix. However, in this study, stepwise least squares algorithm by Neumaier and Schneider [18] was used to estimate the parameter due to its computational efficiency and stability. Mathematical details of this method are given in Appendix B. Although the m-variate AR(p) model is generally used with multi-channels, in this paper, we have used only a single channel at a time in the computation of parameters instead of multi-channel and unexpectedly obtained good results. The model order was fixed at 6 to ensure a fair comparison with the above-mentioned method. Therefore, we had a total of 6 AR coefficients for each channel, giving a total of 36 features for each EEG segment from a mental task. C. MLP-BP NN In this paper, MLP NN with single hidden layer trained by the BP algorithm [19] was used to classify different combinations of 2 mental tasks represented by the different EEG features. Figure 2 shows the architecture of the MLP-BP NN used in
173
World Academy of Science, Engineering and Technology 12 2005
TABLE II MLP-BP NN CLASSIFICATION RESULTS FOR SUBJECT 2
Categories representing the mental task
EEG features
Ouput layer (2 nodes)
Hidden layer (10 to 100 units) Input layer
Fig. 2 MLP-BP NN architecture
Mental Task EEG signals (6 channels)
Feature extraction: ARBG ARLS MAR
Cross validation MLPBP NN classification: Different HU sizes Different AR methods
TABLE III MLP-BP NN CLASSIFICATION RESULTS FOR SUBJECT 3
Fig. 3 Flow of Methodology
III. RESULTS Table I shows the MLP-BP NN classification results using ARBG, ARLS and MAR methods with 2 to 10 HU in steps of 2 and 20 to 100 HU in steps of 20 for subject 1. Tables 2, 3 and 4 show similar results for subjects 2, 3 and 4, respectively. The classification performances are shown in terms of percentage. Only the averaged classification percentages using the modified 10 fold cross validation techniques from either 2 to 10 HU in steps of 2 and 20 to 100 HU in steps of 20 are shown instead of their individual classification percentages. This is to save space. The additional row, ‘average’ shows the average of these averages over the 10 different mental task combinations. The term coefficient variation (CV) represents standard deviation divided by the mean. TABLE I MLP-BP NN CLASSIFICATION RESULTS FOR SUBJECT 1
TABLE IV MLP-BP NN CLASSIFICATION RESULTS FOR SUBJECT 4
174
World Academy of Science, Engineering and Technology 12 2005
IV. DISCUSSION
APPENDIX
Overall, it could been from Tables 1-4 that 20-100 HU gave significantly better results as compared to 2-10 HU for all the feature extraction methods using Student t-test (p<0.00001) from all 4 subjects for all 3 feature extraction methods. This is also the case when comparing the averaged and best classification performances. When comparing best classification performance for each mental task combination, MAR method never gave the best performance for any of the subjects. In this regard, ARBG method gave the best classification performance more number of times as compared to ARLS for all the subjects. For subject 1, only ARBG method gave the best classification performance for all the mental task combinations. However, the classification performances between ARBG and ARLS were closer to each other as compared to MAR, which are most likely due to the similarity of the uni-variate AR modeling for ARBG and ARLS. Classification performances using MAR method also varied hugely between different mental task combinations as compared to ARBG and ARLS, which is shown by the CV values in the tables. As far as the best mental task combinations are concerned, it varied for different subjects. For subject 1, the mental task that gave the best performance was baseline-rotation (83.08%), while it was letter-count (75.24%), rotation-count (80.28%) and baseline-maths (84.66%) for subjects 2, 3 and 4. It is also interesting to note that for subject 3, the best mental task combination was rotation-count for all the feature extraction methods.
Suppose an m-dimensional time series of N+p state vector vv (v=1-p, ..., N) is available, the time series consisting of p pre-sample state vector v1-p, ..., v0 and N state vectors v1, v2, ..., vN that form what we call the effective sample. The parameters A1, A2, ..., Ap, w and C of an AR(p) model of fixed order are to be estimated. The following description of multivariate AR is extracted from [18]. An AR(p) model can be cast in the form of a regression model
vv = Bu n + ε v , ε v = noise(C), v= 1, 2, ..., N
(A.1)
with parameter matrix (A.2)
B = (w A1 A2 ... Ap) and with predictors ⎛ 1 ⎞ ⎜ ⎟ ⎜ vv −1 ⎟ , uv = ⎜ : ⎟ ⎜ ⎟ ⎜v ⎟ ⎝ v− p ⎠
(A.3)
of dimension np = mp + 1. Casting an AR model in the form of a regression model is an approximation in that in a regression model, the predictors uv are assumed to be constant, whereas the state vectors vv of an AR process are a realization of a stochastic process. The approximation of casting an AR model into the form of a regression model amounts to treating the first predictor
V. CONCLUSION
⎛ 1 ⎞ ⎟ ⎜ ⎜ v0 ⎟ . u1 = ⎜ : ⎟ ⎟ ⎜ ⎜v ⎟ 1 − p ⎠ ⎝
In this paper, we have studied the effects of AR features and number of MLP-BP hidden units on the classification performance for designing BCIs. Classification results indicated 20-100 HU gave better performance for all the subjects with the ARBG method as the best method to extract features from EEG signals. This conclusion is based on the average and best classification performance over all the mental task combinations as it is difficult to conclude based on classification performance of single mental task pairs. Though more HU might increase the training and testing time for MLP-BP NN, it is advantageous as it generally results in higher classification performances compared to lower HU. Finally, we showed that it is appropriate to design individual BCIs, i.e. those that are suitable for use by a particular individual. Our experimental results showed that we cannot expect to build universal BCIs for use by all. This is because the thought patterns from different individuals are not the same and therefore different mental tasks result in varying classification performance. The results showed that in most cases, the suitable mental task pairs for each subject (i.e. the mental task pair that gave the best classification performances) are invariant to the feature extraction method. Therefore, it is more important to choose suitable mental task pairs for each individual as compared to the feature extraction method for a successful BCI design.
(A.4)
In terms of the moment matrices N
N
N
v =1
v =1
v =1
U = ∑ u v u vT , V = ∑ vv vvT , W = ∑ vv u vT ,
(A.5)
where the least squares estimate of the parameter matrix B can be written as (A.6)
∧
B = WU −1 . The residual covariance matrix ∧
C=
1 N − np
N
∧
∑ε v =1
v
∧
∧
∧
ε vT with ε v = vv − B u v .
(A.7)
is an estimate of the noise covariance matrix C and can be expressed as ∧
C=
1 (V − WU −1W T ) . N − np ∧
(A.8)
The residual covariance matrix C is propotional to a Schur complement of the matrix
175
World Academy of Science, Engineering and Technology 12 2005
⎛U Γ = ⎜⎜ ⎝W
W T ⎞ N ⎛ uv ⎞ T ⎟ = ∑ ⎜ ⎟ uv V ⎟⎠ v =1 ⎜⎝ vv ⎟⎠
(
)
vvT ,
[4]
(A.9)
which is the moment matrix Γ = K T K belonging to the data matrix
⎛ u1T ⎜ K =⎜ : ⎜uT ⎝ N
v1T ⎞ ⎟ : ⎟ , v TN ⎟⎠
[5] [6]
(A.10) [7]
The least squares estimates can be computed from a QR factorization of the data matrix K = QR ,
[8]
(A.11) [9]
with an orthogonal matrix Q and an upper triangular matrix ⎛R R = ⎜⎜ 11 ⎝ 0
(A.12)
R12 ⎞ . ⎟ R22 ⎟⎠
[10]
The QR factorization of the data matrix K leads to the Cholesky factorization Γ = K T K = R T R of the moment matrix. ⎛U ⎜ ⎜W ⎝
WT V
⎛ RT R ⎞ ⎟ = R T R = ⎜ 11T 11 ⎟ ⎜R R ⎠ ⎝ 12 11
⎞ , ⎟ R R12 + R R22 ⎟⎠
[11]
R11T R12
T 12
T 22
[12]
(A.13)
[13]
and from this Cholesky factorization, one finds the representation
(
∧
B = R11−1 R12
)
T
∧
and C =
1 T R22 R22 , N − np
[14]
(A.14)
[15] [16]
for the least squares estimates of the parameter matrix B and of the noise covariance matrix C. The estimated parameter
[17]
∧
matrix B is obtained as the solution of a triangular system of ∧ equations, and the residual covariance matrix C is given in a factored form that shows explicitly that the residual covariance matrix is positive semi-definite.
[18] [19]
ACKNOWLEDGMENT The authors would like to acknowledge the assistance of Dr. C. Anderson of Colorado State University, USA for giving permission to use the EEG data. REFERENCES [1] [2]
[3]
Vaughan, T.M., Wolpaw, J.R., and Donchin, E., “EEG based communications: Prospects and Problems,” IEEE Transactions on Rehabilitation Engineering, vol. 4, no. 4, pp. 425-430, December 1996. Wolpaw, J.R., Birbaumer, N., Hectderks, W.J., McFarland, D.J., Pecleham, P.H., Schalk, G., Donchin, E., Quatrano, L.A., Robinson, C.J., Vaughan, T.M. “Brain-Computer Interface Technology: A Review of the First International Meeting,” IEEE Transactions on Rehabilitation Engineering, vol. 8 no. 2, pp. 164-173, June 2000. Anderson, C.W., Stolz, E.A., and Shamsunder, S., “Multivariate autoregressive models for classification of spontaneous electroencephalogram during mental tasks,” IEEE Transactions on Biomedical Engineering, vol. 45, no. 3, pp. 277-286, 1998.
176
Currant, E., Sykacek, P., Stokes, M., Roberts, S. J., Penny, W., Johnsrude, I., and Owen, A.M., “Cognitive Tasks for Driving a BrainComputer Interfacing System: A Pilot Study,” IEEE Transactions on Neural Systems and Rehabilitation Engineering, vol. 12, no.1, pp. 48-54, March 2003. Keirn, Z.A., and Aunon, J.I., “A new mode of communication between man and his surroundings,” IEEE Transactions on Biomedical Engineering, vol. 37, no.12, pp. 1209-1214, December 1990. Mason, S.G., and Birch, G.E., “A General Framework for BrainComputer Interface Design,” IEEE Transactions on Neural System and Rehabilitation Engineering, vol. 11, no. 1, pp. 70-85, March 2003. Palaniappan, R., Paramesran, P., Nishida, S., and Saiwaki, N., ”A New Brain-Computer Interface Design Using Fuzzy ARTMAP,” IEEE Transactions on Neural System and Rehabilitation Engineering, vol. 10, no.3, pp. 140-148, Sept. 2002. Pineda, J.A., Silverman, D.S., Vankov, A., and Hestenes, J., “Learning to Control Brain Rhythms: Making a Brain-Computer Interface Possible,” IEEE Transactions on Neural System and Rehabilitation Engineering, vol. 11, no.2, pp. 181-184, June 2003. Donchin, E., Spencer, K.M., and Wijesinghe, R., “The mental prosthesis: assessing the speed of a P300-based brain-computer interface,” IEEE Transactions on Rehabilitation Engineering, vol. 8 no. 2, pp. 174-179, June 2000. Obermaier, B., Neuper, C., Guger, C., Pfurtscheller, “Information Transfer Rate in a Five-Classes Brain-Computer Interface,” IEEE Transactions on Neural System and Rehabilitation Engineering, vol. 9, No. 3, pp. 283-288, Sept. 2001. Pfurtscheller, G., Neuper, C., Guger, C., Harkam, W., Ramoses, H., Schlogl, A., Obermaier, B., Pregenzer, M., “Current trends in Graz brain-computer interface (BCI) research,” IEEE Transactions on Rehabilitation Engineering, vol. 8, no. 2, pp. 216-219, June 2000. Jasper, H., “The ten twenty electrode system of the international federation,” Electroencephalographic and Clinical Neurophysiology, vol. 10, pp. 371-375, 1958. Osaka, M., “Peak alpha frequency of EEG during a mental task: task difficulty and hemispheric differences,” Psychophysiology, vol. 21, pp. 101-105, 1984. Burg, J.P., “A new analysis technique for time series data,” in Childers, D.G. (ed), Modern Spectrum Analysis, pp.42-28, IEEE Press, 1978. Fante R.L., Signal Analysis and Estimation, John Wiley and Sons, 1988. Shiavi, R., Introduction to Applied Statistical Signal Analysis, 2nd edition, Academic Press, 1999. Resende, F.G.V., Tokuda, K., Kaneko, M., & Nishihara, A., “RLS Algorithm for Adaptive AR Spectrum Analysis Based on Multi-Band Decomposition of the Linear Prediction Error,” Proceedings of IEEE Tencon–Digital Processing Application, pp. 541-546, 1996. Neumaier, A., Schneider, T., “Estimation of parameters and eigenmodes of multivariate autoregressive models,” ACM Transactions on Mathematical Software, vol.27, no.1, pp. 27-57, March 2001. Rumelhart, D. E., Hinton, G. E., and Williams, R. J., “Learning internal representations by error propagation,” in Rumelhart, D. E. and McClelland, J. L. (eds), Parallel Data Processing, vol.1, The M.I.T. Press, Cambridge, MA, pp. 318-362, 1986.