The Journal of Neuroscience, October 3, 2012 • 32(40):13805–13818 • 13805
Behavioral/Systems/Cognitive
Effects of Decision Variables and Intraparietal Stimulation on Sensorimotor Oscillatory Activity in the Human Brain Ian C. Gould,1,3 Anna C. Nobre,1,2,3 Valentin Wyart,1,3,4 and Matthew F. S. Rushworth1,2,3 Department of Experimental Psychology, University of Oxford, Oxford OX1 3UD, United Kingdom, 2Centre for Functional Magnetic Resonance Imaging of the Brain, John Radcliffe Hospital, University of Oxford, Oxford OX3 9DU, United Kingdom, 3Oxford Centre for Human Brain Activity, Department of Psychiatry, Warneford Hospital, University of Oxford, Oxford OX3 7JX, United Kingdom, and 4Laboratoire de Neurosciences Cognitives, Ecole Normale Supe´rieure, 75005 Paris, France 1
To decide effectively, information must not only be integrated from multiple sources, but it must be distributed across the brain if it is to influence structures such as motor cortex that execute choices. Human participants integrated information from multiple, but only partially informative, cues in a probabilistic reasoning task in an optimal manner. We tested whether lateralization of alpha- and beta-band oscillatory brain activity over sensorimotor cortex reflected decision variables such as the sum of the evidence provided by observed cues, a key quantity for decision making, and whether this could be dissociated from an update signal reflecting processing of the most recent cue stimulus. Alpha- and beta-band activity in the electroencephalogram reflected the logarithm of the likelihood ratio associated with the each piece of information witnessed, and the same quantity associated with the previous cues. Only the beta-band, however, reflected the most recent cue in a manner that suggested it reflected updating processes associated with cue processing. In a second experiment, transcranial magnetic stimulation-induced disruption was used to demonstrate that the intraparietal sulcus played a causal role both in decision making and in the appearance of sensorimotor beta-band activity.
Introduction To choose effectively, information must be integrated across time and from diverse sources and distributed across the brain if it is to influence structures such as motor cortex that execute choices. While the intraparietal sulcus is implicated in decision integration processes (Gold and Shadlen, 2007; Hunt et al., 2012), lateralization of sensorimotor oscillatory activity in the alpha band (8 –14Hz) and beta band (15–25 Hz) may continuously reflect action plans as a consequence of decision integration (Donner et al., 2009; Siegel et al., 2011). Alpha-band modulation has frequently been related to attention and to movement preparation (Pfurtscheller and Lopes da Silva, 1999; Worden et al., 2000; Foxe and Snyder, 2011); however, the cognitive correlates of beta-band activity have been less clear. Beta-band activity is prominent in the human sensorimotor cortex and has been suggested to reflect maintenance of the current behavioral status quo versus the initiation of action (Baker, 2007; Engel and Fries, 2010; Wang, 2010). Other accounts, however, emphasize a possible role of beta in mediating interregional connectivity within the brain
Received May 6, 2012; revised July 25, 2012; accepted Aug. 1, 2012. Author contributions: I.C.G., A.C.N., and M.F.S.R. designed research; I.C.G. performed research; I.C.G., A.C.N., V.W., and M.F.S.R. analyzed data; I.C.G., A.C.N., and M.F.S.R. wrote the paper. This work was supported by the MRC, Wellcome Trust, and National Institute for Health Research (NIHR) Oxford Biomedical Research Centre based at Oxford University Hospitals Trust Oxford University. The views expressed are those of the authors and not necessarily those of the NHS, the NIHR, or the Department of Health. The authors declare no competing financial interests. Correspondence should be addressed to Ian C. Gould, Department of Experimental Psychology, University of Oxford, South Parks Road, Oxford OX1 3UD, UK. E-mail:
[email protected]. DOI:10.1523/JNEUROSCI.2200-12.2012 Copyright © 2012 the authors 0270-6474/12/3213805-14$15.00/0
(Buschman and Miller, 2007; Wang, 2010; Donner and Siegel, 2011; Dean et al., 2012). We developed a version of the weather prediction task (Yang and Shadlen, 2007) in which humans participants observed a series of visual cues that had probabilistic associations with two mutually exclusive responses. A key quantity to compute during decision making is the log-likelihood ratio (logLR), the logarithm of the ratio between the probabilities associated with the cue and each of the responses being correct. Information from several cues can be combined by summing the logLRs associated with the cues observed on each trial. The behavioral task made it possible to track the dynamic impact of information on alpha- and beta-band electroencephalographic activity. We tested for changes in oscillatory lateralization proportional to logLRs as evidence accrues, even before it is time to execute a response. We focused especially on the possibility that oscillatory activity may encode the sum of logLRs associated with observed cues, and whether this may be dissociated from a transient logLR update signal occurring as each new piece of information is witnessed. It would be particularly striking if a logLR update signal could be seen in sensorimotor activity even after accounting for the effect of the sum of logLRs; a logLR update signal has no impact on action over and above the integrated evidence from all cues and so would demonstrate that oscillatory activity does not just reflect motor preparation/inhibition but the receipt of information about cues from other brain areas. In a second experiment we investigated relationships between the intraparietal sulcus, behavior, and oscillatory activity during decision making by testing (1) whether transcranial magnetic
13806 • J. Neurosci., October 3, 2012 • 32(40):13805–13818
Gould et al. • Oscillatory Correlates of Decision Variables
stimulation (TMS)-induced intraparietal disruption affected decision making and (2) whether TMS exerted correlated effects on behavior and oscillatory activity. Because our subjects responded by making hand movements, we applied TMS over a medial intraparietal region with a similar estimated connectivity profile and function to an intraparietal region in the macaque medial intraparietal area (MIP), associated with hand movements (Mars et al., 2011).
Materials and Methods Participants Twenty-four (13 female; age, 19 –34 years) and 12 (7 female; age, 20 –35 years) right-handed volunteers participated in Experiments 1 [electroencephalogram (EEG) only] and 2 (combined EEG and TMS), respectively, after giving informed written consent. Participants reported normal or corrected-to-normal vision and no history of neurological disorders. Both experiments were conducted in accordance with the Declaration of Helsinki.
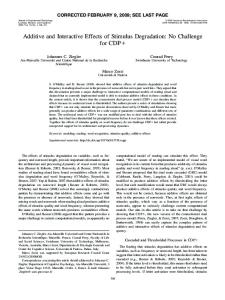
Probabilistic categorization task The behavioral task that we used is an adaptation of the sequential version of the weather prediction (Knowlton et al., 1996; Yang and Shadlen, 2007). On each trial, participants attempted to determine whether the correct response required at the end of the trial was to be made with the left or right hand by integrating the evidence provided by up to four sequentially presented cue shapes (Fig. 1 A, B). After making a unimanual left- or right-handed response, they received positive or negative feedback depending on whether their guess was correct. Before each trial, the required response was randomly set to be “left” or “right.” Up to four cue shapes {s1, s2, s3, s4} were then selected from a set of eight shapes {S1, S2, . . ., S8}. On average, all shapes were equiprobable [P(si ⫽ Sx) ⫽ 1/8 for all x]. However, on each trial, the probabilities of observing specific cue shapes were biased depending on the program-selected response. Each shape was associated with a Figure 1. Experimental task and behavior. A, A typical trial, with four cues providing evidence about the response. B, The set of fixed weight from the set of weights w ⫽ {⫺0.9, cue shapes and their mappings onto WOEs for one participant. C, A schematic of integrated WOE fluctuations over an example trial. ⫺0.7, ⫺0.5, ⫺0.3, ⫹0.3, ⫹0.5, ⫹0.7, ⫹0.9}. At the end of the trial, the evidence favors a “right” response. D, The relationship between cue WOEs and the probabilities of Relationships between shape weights and re- observing each cue given a left or right world state, and on average. E, All possible evidence states at each stage in the task (red sponse probabilities were defined such that dots) and all possible trajectories that can lead to each state (black lines). F, Participants’ responses accurately reflected the shape weights were equal to the change in log integrated WOE after the fourth cue shape. The dashed line describes a probability-matching response pattern. G, Participants’ odds that observing a shape provided in favor subjective WOEs strongly correlate with the objective cue WOEs. of a left- or right-handed response, and posinumber of cue shapes (N ⫽ 8 during the main experiment). P( L) and tive weights were associated with right responses (Fig. 1 B, D): P( R) are the probabilities of the computer selecting a left or right reP共R兩si 兲 sponse [P( L) ⫽ P( R) ⫽ 0.5]. Note that Equations 2 and 3 can be derived , (1) w i ⫽ logN P共L兩si 兲 using Equation 1 and Bayes’ theorem under these assumptions. Cue shapes were sampled independently and with replacement, and the map1 1 N wi , ping between shapes and weights was randomized across participants. (2) ⫻ ⫻ P 共 s i兩 R 兲 ⫽ P 共 R 兲 N 共 1 ⫹ N w i兲 After observation of a sequence of n shapes, the overall evidence accumulated in favor of a left versus right response is the posterior log odds— 1 1 P 共 s i兩 L 兲 ⫽ ⫻ ⫺ P 共 s i兩 R 兲 , (3) the logarithm of the ratio of the probabilities of the program-selected P共R兲 N response being left versus right given the observed shapes. The posterior log odds is equal to the sum of the weights associated with the observed where P(si兩L) and P(si兩R) are the probabilities of observing cue shape si shapes. Because left and right responses were equiprobable, the posterior given a left ( L) or right ( R) program-selected response. N is the total
Gould et al. • Oscillatory Correlates of Decision Variables
J. Neurosci., October 3, 2012 • 32(40):13805–13818 • 13807
log odds is also equal to the log-likelihood ratio (the logarithm of the ratio of the probabilities of observing the presented cue shapes under the assumption of a left versus right world state); that is,
P共s1 , . . . , sn 兩R兲 P共R兩s1 , . . . , sn 兲 WOE ⫽ logN ⫽ logN ⫽ P共s1 , . . . , sn 兩L兲 P共L兩s1 , . . . , sn 兲
冘
For convenience, we refer to all three of the quantities in Equation 4 using the term “weight of evidence” (WOE). The “integrated WOE” (or “posterior WOE”) describes the WOE at the end of an epoch or trial, the “prior WOE” is the accumulated WOE at the start of an epoch and is zero when the first shape appears, and the “update WOE” is the weight of a cue shape presented in a particular epoch of a trial and is equal to the update value that should be added to the prior WOE upon observation of the shape.
Experiment 1: EEG Procedure. Stimuli were presented at 60 Hz on a CRT monitor (viewing distance, 100 cm), with stimulus presentation and response acquisition controlled using Presentation 13.0 (Neurobehavioral Systems). An example trial is shown in Figure 1 A. Each trial commenced with a central fixation cross (1000 ms). One or more cue shapes were then presented sequentially, each for 350 ms followed by a 1000 ms delay period in which only the fixation cross was visible. On most trials (70%), four cues were presented. To ensure response preparation, we also included shorter trials in which only one, two, or three (10% of trials each) cues were presented. The fixation cross turning white acted as a go signal, indicating that participants should respond with a left- or right-hand index finger button press. Participants received feedback (a colored 2.5 o disc) indicating whether they had correctly (green) or incorrectly (red) guessed the response. If participants exceeded the maximum response time (1500 ms) or responded before onset of the go signal, the feedback indicated the trial was a miss (yellow). Participants were instructed to emphasize accuracy but to respond in a timely fashion. Participants completed 40 practice trials with all eight cues, and then 400 trials during which EEG was recorded. Rest breaks were provided every 40 trials. Participants were asked to maintain central fixation and not to blink during trials. Training session. Participants completed a 1.5 h behavioral training session ⬍1 week before the Experiment 1 EEG session. They were told that the order of cue presentation did not affect the evidence shapes provided and were shown a ranking of the shapes reflecting how predictive they were and whether they provided evidence for a left or right response. They were informed that they would never be told the exact weights of shapes or how to combine information from multiple shapes, and that their main aims in the training session were to learn these using trial and error. Participants first completed practice trials with the most predictive pair of shapes (w ⫽ ⫾0.9), then with the next most predictive pair (w ⫽ ⫾0.7), and then with both pairs of shapes together (w ⫽ ⫾0.7, ⫾0.9). This procedure was then repeated with the less predictive four shapes (w ⫽ ⫾0.3, ⫾0.5). Practice continued until participants reported feeling comfortable using the shapes in each block, typically 10 –20 trials with shape pairs and 20 – 40 trials with sets of four shapes. Participants then completed 40 practice trials with six shapes (excluding only the most predictive pair of shapes) and a 40-trial practice block with all eight cue shapes. To ensure the evidence provided by shapes was constant throughout the training, the cue set size N was varied appropriately in Equations 2 and 3. After a short break, participants completed the second part of the training session: 240 trials with all eight cue shapes, with rest breaks every 40 trials. Behavioral data analysis. We estimated the impact of each cue shape on participants’ choices from four-cue trials using logistic regression, as in previous studies (Yang and Shadlen, 2007; Philiastides et al., 2010):
P共R兲 ⫽
8K , 1 ⫹ 8K
(5)
w ⴱi N i ,
(6)
i⫽1
(4)
i⫽1
冘 8
K ⫽ 0 ⫹
n
wi .
where
where P( R) indicates the response made on each trial, Ni is the number of times shape si was observed on trial i, and wiⴱ is the fitted subjective weight of evidence (SWOE) for shape si. Pearson correlation coefficients characterized the relationship between each participant’s SWOEs and the true shape WOEs. The estimated SWOEs for several observers were very large due to their high performance (note that the SWOEs for an ideal observer are proportional to the true shape WOEs but infinite). We therefore normalized the set of wiⴱ values within subjects for display purposes. EEG recording, preprocessing, and spectral analysis. EEG was recorded continuously (1000 Hz sampling rate; left mastoid reference; NuAmps digital amplifiers; Neuroscan) from 40 scalp sites using Ag/AgCl electrodes mounted on an elastic cap (Easy Caps) according to the 10 –20 international system. The montage included seven midline sites (OZ, POZ, PZ, CPZ, CZ, FCZ, and FZ), 14 sites over each hemisphere (O1/O2, PO3/PO4, PO7/PO8, P1/P2, P3/P4, CP1/CP2, CP3/CP4, C1/C2, C3/C4, FC1/FC2, FC3/FC4, F1/F2, F3/F4, and FP1/FP2), left and right mastoids, horizontal EOG (HEOG) and vertical EOG (VEOG) electrodes to monitor the EOG bipolarly, and an additional electrode (AFZ) used as a ground. Vertical EOG was calculated as the bipolar derivation between FP2 and the lower VEOG electrode. Recordings were rereferenced offline to the average EEG. Due to the low numbers of shorter trials, EEG data were only analyzed for trials in which four cue shapes were presented. For these trials, continuous epochs from 1000 ms before onset of the first cue shape to the end of the response period were analyzed except on miss trials, when the EEG showed recording artifacts, or if saccades or blinks occurred in the EOG. This resulted in inclusion of 222 trials per subject on average (79% of all four-cue trials; ⫽ 9.9%). Power spectra were computed for single-trial data using the multitaper method (Mitra and Pesaran, 1999) with a single Hanning taper (2–35 Hz; 0.5 Hz steps; 600 ms temporal smoothing window; 50 ms window steps) using Fieldtrip (Oostenveld et al., 2011). This relatively long temporal smoothing window allowed us to discriminate between spectral activity in the alpha- and beta-band frequencies. Shorter temporal smoothing windows yielded qualitatively similar results, but reduced the frequency resolution such that clear distinction between the alpha and beta bands was not possible. Raw power data were log10 transformed and multiplied by 10, yielding approximately normally distributed data suitable for standard parametric statistical tests (Kiebel et al., 2005). To obtain spectral representations of phase-locked responses on the task, we also performed spectral analysis on the average waveform for each participant. Averaged overall and phase-locked data for each participant were baseline corrected using the 500 ms before onset of the first cue shape. A Student’s t test was subsequently performed on all sensor–time–frequency bins. Statistical analysis of spectral data. Single-trial spectral data were modeled using several general linear regression models (GLMs). Single-trial data were either raw data from individual sensors, an average over several sensors, or a lateralization index (LI), calculated as the right-hemisphere minus left-hemisphere difference for left/right symmetric electrode pairs or regions of interest (ROIs). Each regression model was fit independently for each subject and at every sensor–frequency–time bin. Significant effects were then identified using a permutation-based clustering procedure ( p ⬍ 0.01 cluster threshold, two-tailed; 2000 permutations) (Maris and Oostenveld, 2007). All p values were Bonferroni corrected when analyzing multiple sensors. To investigate the temporal evolution of effects within frequency bands of interest, we averaged over these frequencies and then calculated cluster statistics using adjacent time bins rather than time–frequency bins. To test whether oscillatory signals reflected the integrated WOE, we fit the following regression model:
y ⫽  0 ⫹  1 WOE i ,
i ⫽ 1,2,3, or 4,
(7)
Gould et al. • Oscillatory Correlates of Decision Variables
13808 • J. Neurosci., October 3, 2012 • 32(40):13805–13818
where y is single-trial spectral power at a sensor–frequency–time bin for a single participant, and WOEi is the integrated WOEs after the ith cue on each trial. To dissociate the contributions of the prior WOE and update WOE to spectral data, we fit the following model to spectral data across all four epochs:
y i ⫽  0 ⫹  1 WOE i⫺1 ⫹  2 Q i ⫹  3 i,
i ⫽ 1,2,3,4,
(8)
where yi is the spectral power from a sensor–frequency bin at a time point relative to onset of the ith cue, Qi is the update WOE provided by the ith cue, and WOEi⫺1 is the prior WOE at the time the ith cue is presented. The coefficient 3 was included to ensure any nonspecific effects of time in the task were modeled. By using the model summarized in Equation 8, we sought to identify whether any aspect of oscillatory activity might be associated not just with the evidence for a particular response but with the dynamic updating of that evidence by the update cue. Whether this is the case is an important question because the update cue, in isolation, does not determine the choice that is prepared, and indeed it might even provide evidence that runs counter to the prior evidence and the action that was being prepared. It might, however, be argued that an even more stringent test of whether the update cue has an impact on oscillatory activity is to assess whether it has an independent effect over and above that exerted by the posterior evidence after integration of both the prior evidence and the update cue evidence. To investigate whether the update WOE contributed to spectral responses over and above representation of the integrated WOE (or posterior WOE), we fit an additional model to spectral data across all four epochs:
y i ⫽  0 ⫹  1 WOE i ⫹  2 Q i ⫹  3 i,
i ⫽ 1,2,3,4,
(9)
where WOEi is the integrated WOE after observation of the ith cue is presented, and all other terms are as in Equation 8. Control analyses investigated whether 8 –14 and 15–25 Hz spectral activity varied parametrically with the WOE or could be explained by planning of the categorical (left or right) motor response made at the end of the trial. In other words, this analysis assessed whether the evidence for a response had an impact on oscillatory activity that was over and above the impact that preparation of one response or the other had on oscillatory activity. To maximize sensitivity for this analysis, for each frequency band and for each trial, we averaged 1000 ms of power data, starting 500 ms after each cue was presented. Within this time window, oscillatory activity reflected the most recently presented cue, but not the subsequently presented cue. We fit regression models separately to the data for each frequency band and each of the four epochs:
y ⫽  0 ⫹  1 WOE i ⫹  2 R,
i ⫽ 1,2, 3 or 4,
(10)
where R is the response made at the end of the trial. We then performed a two-way repeated-measures ANOVA to investigate whether the fitted coefficients for 1 and 2 varied with the cue period i. The ANOVA model included a dummy variable to allow us to test whether 1 and 2 differed significantly from zero. A second control model investigated whether oscillatory power reflected planning of a categorical response which flipped in direction over the course of trials due to fluctuations in the evidence presented to participants. In other words, this analysis was similar to the previous one, but it was more refined in an important sense. Now rather than assessing whether evidence had an impact on oscillatory activity over and above the identity of the response ultimately prepared, it assessed whether evidence had an impact on oscillatory activity over and above the impact of the identity of the response favored by the evidence at any point in time. For example, on a given trial it might be the case evidence favored a right response after the first cue, a left response after the second and third cues, and a right response after the fourth and final cues. The model summarized in Equation 11 allowed us to test whether oscillatory activity was tracking the evolving evidence rather than the flipping favored response identity as each cue was presented. Now R is replaced by the term Si,
which reflects the sign of the integrated WOE after presentation of the ith shape:
y ⫽  0 ⫹  1 WOE i ⫹  2 S i ,
i ⫽ 1,2,3,4.
(11)
An additional control analysis ensured results were not affected by nonspecific factors associated with task difficulty or cue-related surprise. We extended the model in Equation 8 to include terms describing the absolute values of the prior WOE and the cue-related surprise:
y i ⫽  0 ⫹  1 WOE i⫺1 ⫹  2 Q i ⫹  3 i ⫹  4 兩WOE i⫺1 兩 ⫹  5 Z i , i ⫽ 1,2,3,4, Z i ⫽ log共P共sj 兩L兲 P共L兲i ⫹ P共sj 兩R兲 P共R兲i 兲,
(12) (13)
where 兩WOEi⫺1兩 denotes the absolute value of the prior WOE, and sj is the cue shape presented in the ith epoch. P(sj兩L) and P(sj兩R) are the conditional probabilities of observing shape sj in the ith epoch under the assumption of a left and right programmed responses, respectively. P( L)i and P( R)i are the prior probabilities of left or right responses given the WOE provided by all previously presented shapes on the trial. Zi is therefore the overall log probability of observing the cue stimulus under the prior WOE and is more negative when the presented cue is surprising given P( L)i and P( R)i. Note also that this term corresponds to log of the denominator in Bayes’ rule when calculating the posterior probability of each response state given the observation of a cue:
P* 共 L 兩 s i 兲 ⫽
P 共 s j兩 L 兲 P 共 L 兲 i . P 共 s j兩 L 兲 P 共 L 兲 i ⫹ P 共 s j兩 R 兲 P 共 R 兲 i
(14)
Experiment 2: TMS-EEG We conducted a second experiment to examine the causal dependence of decision making and beta-band activity on the human medial intraparietal cortex. The task in Experiment 1 was modified to make it more suitable for use with TMS. First, the evidence observed on each trial was reduced to three shapes. Second, we removed all shorter trials on which fewer than three cue shapes were presented, simplifying the design and maximizing the number of trials from which usable data was obtained. Third, five pulses of 10 Hz TMS were delivered on 50% of trials (MagStim Rapid biphasic stimulator; 70 mm figure-of-eight coil). On TMS trials, five pulses of 10 Hz TMS were delivered starting 50 ms after onset of the second cue stimulus, over the time period that Experiment 1 had indicated that decision variable updating occurred. TMS was delivered with the coil positioned tangentially to the scalp and the handle oriented toward the vertex. After completing the behavioral training session, subjects performed two TMS-EEG sessions (intraparietal TMS and V5/MT TMS, counterbalanced). In each session, participants completed 40 practice trials during which TMS was delivered on 50% of trials, and then 360 trials during which TMS was delivered on 50% of trials and the EEG recorded. Rest breaks were provided every 40 trials. TMS output intensity was matched across sites according to each participant’s resting motor threshold (Stokes et al., 2005, 2007). Between participants, TMS output intensity was varied between 90 and 100% of distance-adjusted motor threshold (mean, 95%) to ensure stimulation was comfortable and did not induce blinks. Mean stimulation intensity was 63% of the maximum stimulator output. Resting motor threshold was assessed in a separate session. EEG recordings and analysis were as in Experiment 1 except for changes to the electrode montage to allow placement of the TMS coil. The montage recorded from included seven midline sites (OZ, POZ, PZ, CPZ, CZ, FCZ, and FZ), nine sites over each hemisphere (O1/O2, PO3/ PO4, PO7/PO8, CP3/CP4, CP5/C6, C3/C4, C5/C6, FC3/FC4, and FC5/ 6), left and right mastoids, HEOG and VEOG electrodes to monitor the EOG bipolarly, and an additional electrode (AFZ) used as ground. Electrode wires were arranged on the scalp to be loop free and oriented away from the center of the TMS coil to minimize TMS-induced artifacts (Veniero et al., 2009). On average, 162 TMS trials (SD, 15) and 163 no-TMS trials (SD, 19) were analyzed per subject after artifact rejection. A repeated-measures ANOVA with factors TMS condition (TMS, noTMS) and TMS site (MIP, V5) revealed the number of rejected trials did
Gould et al. • Oscillatory Correlates of Decision Variables
J. Neurosci., October 3, 2012 • 32(40):13805–13818 • 13809
Figure 2. Overall and evoked time–frequency effects during decision making and after responses. A, B, In the overall response (A) but not the time-locked response (B), alpha (8 –14 Hz) and beta (15–25 Hz) modulation followed presentation of cue stimuli and progressively desynchronized over the trial. Top, Average effects at individual sensors. Bottom, Effects averaged across sensors. C, Topography of the beta rebound lateralization is evident in the average time–frequency map for the subtraction of left- and right-handed responses. The bottom panel shows the further subtraction between the left-hemisphere ROI (C3, CP3) and right-hemisphere ROI (C4, CP4). Light vertical dashed lines, Onset times of cue stimuli; heavy dashed lines, onset of the go cue in A and B and the response time in C. not differ between sites or TMS conditions (all F values ⬍1.3; all p values ⬎0.3). TMS site localization. In separate sessions, TMS was delivered medial to the left intraparietal sulcus to an area resembling macaque MIP or to a left V5/MT control site, which was unlikely to be critical for any aspect of the sensorimotor transformations needed for performance of this task. Stimulation sites were identified in T1-weighted structural MRI scans for each participant using MNI coordinates from previous studies of MIP (Mars et al., 2011) and V5/MT (Kolster et al., 2010) and local neuroanatomical landmarks (see Fig. 9B). The medial intraparietal area we stimulated has been implicated previously in visually guided limb movements (Rushworth et al., 2001a; Grefkes et al., 2004; Hinkley et al., 2009) and variously known as hIP3 (Scheperjans et al., 2008) and IPS4 (Swisher et al., 2007). Patterns of correlation between the resting state signal in this region and other brain areas resemble those between MIP and other brain areas in macaques (Mars et al., 2011). Stimulation sites were in the left hemisphere because of its dominant role in action selection (Rushworth et al., 2001b, 2003; Hesse et al., 2006; Oliveira et al., 2010; Cotti et al., 2011). It was also important to compare the effects of intraparietal TMS with those of TMS to a control area in the same hemisphere because the lateralized auditory and tactile sensations induced by TMS may bias attention or responses to one side of space. Coil placement was guided using Brainsight frameless stereotaxy (Rogue Research). Behavioral effects of TMS. For each TMS-EEG session, we characterized how participants’ responses varied with the WOE at the end of each trial using a logistic psychometric function:
P共R兲 ⫽
1 , 1 ⫹ 8 ⫺  共 WOE⫺ ␣ 兲
(15)
where P( R) describes the proportion of right responses the participant made at each WOE, and  and ␣ describe the slope and threshold of
the psychometric function, respectively. Separate repeated-measures ANOVAs compared the obtained slope and threshold parameters for intraparietal and control sites, with factors of TMS condition (TMS, no-TMS) and site (active, control). EEG data analysis. We first checked that EEG data replicated the pattern of results observed in Experiment 1 using the same GLM approach as in Experiment 1. We then extended the GLM model in Equation 12 to include a term reflecting the effects of TMS over and above any variance explainable by task demands common to TMS and no-TMS trials:
y i ⫽  0 ⫹  1 WOE i⫺1 ⫹  2 Q i ⫹  3 i ⫹  4 兩WOE i⫺1 兩 ⫹  5 Z i ⫹  6 T i , i ⫽ 3,
(16)
where T describes whether TMS was delivered on each trial and all other terms are as described for Equation 12. This analysis was performed separately for each channel–frequency–time bin of each participant’s data from each TMS-EEG session. The model was fit to data from the third epoch of each trial only from the earliest time at which artifact-free EEG time–frequency data were available (800 ms after onset of the second cue shape) to the beginning of the response period. The model was fit on a priori grounds to time–frequency data between 3 and 27 Hz (Maris and Oostenveld, 2007) over which task-related effects were observed in Experiment 1. The 3 Hz lower limit ensured data were not contaminated by low-frequency TMS artifacts associated with recharging of TMS boosters. To investigate the behavioral and spectral consequences of TMS, we averaged the regression coefficients describing the mean effect of TMS over time and frequency windows of interest for each participant in the MIP TMS-EEG session, and then subtracted the same measure calculated for the V5 control session. This computation was performed separately for left- and right-hemisphere ROIs. Data were then subjected
13810 • J. Neurosci., October 3, 2012 • 32(40):13805–13818
Gould et al. • Oscillatory Correlates of Decision Variables
Figure3. Spectralcorrelatesofintegrateddecisionevidence.A,LateralizationofspectralactivitycorrelatingwiththeintegratedWOEattheendoffour-cuetrialsevolvedthroughoutthetrial.Solidblacklines encircle significant effects. B, Regression coefficient between the integrated overall WOE in each epoch of the trial and alpha (thin red line) and beta (thin blue line) lateralization. Error bars indicate SEM. Thick horizontal lines indicate significant effects. Dashed lines indicate onset times of cues and the go signal. C, D, Both frequency bands correlated with the WOE at consistent central and parietal scalp locations (left 5 plots in each row). As positive WOEs favored left responses, the WOE correlated positively with left-hemisphere oscillatory activity and negatively with right-hemisphere oscillatory activity. A post-response beta-band rebound was found at the same electrode locations (bottom right). All topographies depict a birds-eye view of the scalp, with anterior locations at the top. Large black dots highlight electrodes contributing to regions of interest.
Gould et al. • Oscillatory Correlates of Decision Variables
J. Neurosci., October 3, 2012 • 32(40):13805–13818 • 13811
of the TMS artifact but before onset of the third cue stimulus by averaging the vectors describing the coupling at each time point within the window, yielding a single estimate of coupling for each participant. To compare between conditions, we calculated the vector difference between each participant’s coupling estimates in each condition. For each experimental condition, we then tested the null hypothesis that there was a uniform distribution of phase angles across the group using the Rayleigh test (Berens, 2009). To test the null hypothesis that there was no difference in the distribution of phase angles between conditions, we applied the Rayleigh test to the vector differences between each condition.
Results
Figure 4. Temporal dynamics of oscillatory lateralization within epochs. A, B, Correlates of the prior WOE were sustained over trial epochs (A), whereas correlates of cue update WOE were only observed after the cue had been processed (B). Solid black lines encircle significant effects. C, D, Time course of average alpha and beta activity reflecting the prior WOE and update WOE. Horizontal red/blue lines indicate significant effects. E, F, Topographies of the regression coefficients averaged across the entire epoch for the prior WOE regressor and from 400 ms after cue onset until the end of the epoch for the update WOE regressor. Large black dots highlight electrodes contributing to regions of interest. to a two-way repeated-measures ANOVA to investigate whether spectral power differed in left- and/or right-hemisphere ROIs following MIP stimulation. Factors were ROI (left hemisphere, right hemisphere) and TMS site (MIP, V5). We also tested whether individual participants’ TMS-induced changes in EEG time–frequency data correlated with TMSinduced changes in behavior using two-tailed Pearson correlations. To investigate further the link between TMS-induced neural and behavioral changes, we characterized how participants’ responses varied with the phase of the beta-band oscillation after TMS. We reasoned that if beta-band changes reflect interareal interactions, then behavioral changes due to TMS may have been more likely when TMS caused a reset in the phase of the ongoing beta-band oscillation (Leventhal et al., 2012). Analysis of phase-toresponse coupling was completed by regressing the behavioral responses made by participants at the end of each trial with the sine and cosine of the 20 Hz phase data from that trial. This was performed separately for each time point of interest and for the left- and right-hemisphere ROIs. We then calculated the square root of the sum of squares of the resulting beta coefficients to estimate the amplitude of the phase-response coupling, and the arctangent of the beta coefficients to provide an estimate of the preferred phase of the coupling. Results were pooled across the 550 ms window after the offset
Behavioral results Figure 1, F and G, shows that despite the large number of possible shape combinations (8 4 permutations; 330 unique permutations), participants were able to integrate the information provided by multiple shapes and were highly sensitive to the WOE provided by each cue. Not only did they make left-hand responses when the integrated WOE was negative and right-hand responses when it was positive, but the subjective WOEs assigned to cues were correlated with the objective WOEs that had been programmed (mean r ⫽ 0.97, p ⬍ 0.001 for all individual participants). At intermediate integrated WOEs, participants made a sharper transition between left and right responses than expected by a probability matching explanation of behavior. Subjects selected 92% of responses optimally on the most frequent trial type with four cues. While accuracy declined significantly on the infrequent trials with fewer cues (F(3,69) ⫽ 5.73, p ⬍ 0 0.01; linear contrast, F(1,23) ⫽ 10.0, p ⬍ 0.01), it remained high (87%) in absolute terms, even when just one cue was presented.
EEG results We first characterized the average time course and spectral profile of EEG responses in our task (Fig. 2 A, B). Presentation of cues was followed by beta-band desynchronization, becoming increasingly prominent toward the end of the trial. Alpha-band activity also tended to be more desynchronized toward the end of trials. These effects were not present in a phase-locked analysis, suggesting they reflect induced oscillatory neural activity. Induced activity modulation in these frequency bands has been reported in several previous attentional and decision-making tasks (Donner et al., 2007, 2009; Siegel et al., 2008). Our primary aim was to assess whether preparatory motor activity continuously reflects the WOE in favor of one decision (integrated WOE), both as new information is witnessed (update WOE) and as it is integrated with prior evidence (prior WOE) from previous cues. Because alpha- and beta-band desynchronization occur contralateral to the prepared response, we calculated a
13812 • J. Neurosci., October 3, 2012 • 32(40):13805–13818
Gould et al. • Oscillatory Correlates of Decision Variables
right-hemisphere minus left-hemisphere LI at electrodes commonly implicated in motor execution and imagery (left ROI, C3 and CP3; right ROI, C4 and CP4) (Pfurtscheller et al., 1996; Wolpaw and McFarland, 2004). We also validated these ROIs using an independent data set. For this, we aligned raw EEG data to participants’ responses and recomputed the time–frequency analysis as described above. We then identified the peak electrodes at which differential beta modulation was present following left- versus right-hand responses (the “beta rebound”). The post-response beta-band rebound (Fig. 2C) was found at the same electrodes, consistent with the effects being driven by differential activity in the primary motor and/or premotor cortex. Consistent with our hypothesis, there Figure 5. Beta-band activity reflects decision updating. A, B, In addition to correlates of the integrated WOE, which includes the was evidence of a strong relationship be- prior and cue WOE, correlates of the cue update WOE were observed in the beta band around the time cues were processed (B). tween the integrated WOE after the fourth Horizontal red/blue lines indicate significant effects. cue and alpha- and beta-band lateralization. Regressing the integrated WOE after the fourth cue against consequence of some other factor that might have been correthe LI for 2–35 Hz activity throughout experimental trials (Eq. 7) lated with decision evidence. We first considered whether they revealed significant effects in the alpha- and beta-bands, particmerely reflected the preparation of the categorical response made ularly toward the end of the trial (Fig. 3A). Performing the at the end of each trial (Fig. 6 A, top) (Eq. 10). Although both same analysis separately for each cue period relative to the frequency bands reflected the categorical response and displayed integrated WOE after each cue presentation revealed alpharamping effects toward the end of the trial, they did so in addition and beta-power correlates in all epochs, strengthening toward to being correlated with the WOE. A significant effect of the the end of the trial and dissipating after a response was made (Fig. integrated WOE was present even when the effect of the final 3B). Fitting the model to individual electrode data verified that the response on alpha- and beta-band activity was additionally modstrongest correlations between the integrated WOE and the LI were eled at each stage of the trial (Fig. 6 A) (8 to 14 Hz, F(1,23) ⫽ 22.79, p ⬍ 10 ⫺3; 15–25 Hz, F(1,23) ⫽ 4.82, p ⫽ 0.038). For both freobserved at the electrodes contributing to the LI (Fig. 3C,D). As quency bands we also observed a main effect of cue period (for expected given that positive WOEs were associated with right-hand cues 1– 4) on regression coefficients (8 to 14 Hz, F(3,69) ⫽ 9.94, responses, the positive correlations between the LI and WOE rep ⬍ 10 ⫺3; 15 to 25 Hz, F(3,69) ⫽ 20.47, p ⬍ 10 ⫺3). For both flected that there was a negative correlation between left-hemisphere frequency bands, post hoc tests revealed no significant responseoscillatory activity and the WOE and a positive correlation between related effects at cue periods 1 and 2, even though significant right-hemisphere oscillatory activity and the WOE. We note that effects were observed at cue periods 3 (pairwise comparisons, p these correlations may reflect both desynchronisation contralateral values ⬍0.05) and 4 (pairwise comparisons, p values ⬍0.001). to the side at which a response is prepared, and ipsilateral synchroAlternatively, we reasoned that our effects might not have nization (Donner et al., 2009; van Wijk et al., 2009). reflected preparation of the categorical responses participants The results plotted in Figure 3 reveal the effect of the inteactually made at the end of trials but instead a closely related grated WOE on oscillatory signals. To examine how oscillatory variable, the preparation of the response favored by evidence activity changes as each new piece of evidence is witnessed and to date at each intermediate stage of the trial given the inteintegrated with the prior WOE, a regression model was used to grated WOE. In other words, we tested whether beta-band identify the unique contributions of the prior WOE and the WOE activity might reflect the intended response if we allowed that update provided by the most recently observed cue (Eq. 8). Both the intended response direction might flip as each of the four aspects of the decision evidence make dissociable contributions cues was presented and evidence in favor of one response or to the LI (Fig. 4). The prior evidence was reflected in both the the other fluctuated (Fig. 6 B, top). We tested this possibility alpha- and beta-bands throughout the epoch. Correlates of the by considering an additional model incorporating a term that most recently presented cue were only apparent 400 –500 ms after reflected the sign of the integrated WOE at each cue period the cue was presented, presumably reflecting the processing times (Eq. 11). We focused on trials on which participants made the associated with the task. Both effects appeared more sustained for optimal response, suggesting that they correctly tracked the 8 –14 Hz than for 15–25 Hz activity, and had similar topographies WOE over the course of the trial. Results were similar to to the overall WOE. the previous analysis, and a significant effect of the integrated To assess more stringently how oscillatory activity reflected WOE was again found for both frequency bands (Fig. 6 B) (8 to dynamic updating due to the update cue, we tested whether the 14 Hz, F(1,23) ⫽ 22.9, p ⬍ 10 ⫺3; 15 to 25 Hz, F(1,23) ⫽ 6.12, p ⫽ update cues phasically modulated oscillatory activity over and 0.021). Similar to the effect of the response in the previous above representation of the integrated (or posterior) evidence model, a significant main effect of cue period was observed on (Eq. 9). A significant effect was found for the beta band, but not coefficients modeling the effect of the sign of the integrated for the alpha band (Fig. 5). WOE (8 to 14 Hz, F(3,69) ⫽ 7.79, p ⬍ 10 ⫺3; 15 to 25 Hz, We further investigated whether the observed relationships F(3,69) ⫽ 10.87, p ⬍ 10 ⫺3). Post hoc tests revealed significant between oscillatory signals and decision evidence were simply the
Gould et al. • Oscillatory Correlates of Decision Variables
A
J. Neurosci., October 3, 2012 • 32(40):13805–13818 • 13813
B
Control Analysis 1
Control Analysis 2
WOE Control Regressor 0
1
2
3
WOE Control Regressor
4
0
1
15−25 Hz
0.2
0.2
0.1
0.1
0
0
−0.1
−0.1
1
1
0.5
0.5
0
0 2
3
Sum of WOE Regression Co−efficient
8−14 Hz
1
4
Epoch Number
2
3
4
Epoch Number
1
2
3
4
Epoch Number
Sign(Sum of WOE) Regression Co−efficient
Sum of WOE Response Regression Co−efficient Regression Co−efficient
Epoch Numbe r
8−14 Hz
15−25 Hz
0.4
0.4
0.2
0.2
0
0
1
1
0.5
0.5
0
0
−0.5
−0.5 1
2
3
4
Epoch Number
1
2
3
4
Epoch Number
Figure 6. Lateralization of spectral activity was parametrically modulated by decision evidence. A, Effects of the WOE in each epoch after controlling for participants’ categorical responses. B, Effects of the WOE in each epoch after controlling for the optimal response based on partial evidence in each epoch. The top panels show a schematic of the values for each regressor throughout an example trial. Error bars indicate SEM.
effects of the WOE sign on 8 –14 Hz power at cue periods 2, 3, and 4 (all p values ⬍ 0.05). For 15–25 Hz power, post hoc tests revealed a marginal effect at cue period 3 ( p ⫽ 0.07) and a significant effect at cue period 4 ( p ⬍ 10 ⫺3). To ensure effects associated with general arousal, task difficulty or surprise were not responsible for our observed link between evidence and the LI, we further extended our regression model to include a parameter reflecting the absolute value of the prior evidence (a parameter that indexes certainty/uncertainty about which response to make) and a parameter reflecting the log probability of observing the cue given the prior WOE (Eq. 12). This latter term is identical (though opposite in sign) to the surprise at observing the cue (Bestmann et al., 2008b). Inclusion of these terms did not mediate the impact of the prior and cue WOEs on the LI (Fig. 7A), though significant effects were found in the average over electrodes contributing to the LI (Fig. 7B). Positive effects of the certainty and surprise parameters were also found at a range of individual electrode sites (Fig. 8).
ment started almost 3 s, and finished ⬎2 s, before the response. As such, the TMS manipulation in the current combined TMS-EEG experiment is minimal compared to that used in many other investigations where the TMS impact is designed to be concurrent with the entire experimental trial. Similarly the oscillatory modulations were recorded over an extended period of 550 ms that only began 350 ms after TMS delivery. We characterized how individual participants’ choices varied with the overall WOE by fitting logistic psychometric functions to their choice data in each session and TMS condition (Eq. 15). The slope and threshold parameters were fit independently in each case. No significant effects on slope parameters were found ( p values for all F tests ⬎ 0.1). For the threshold parameter, a significant interaction was found between TMS condition and TMS site (F(1,11) ⫽ 5.41, p ⫽ 0.04) reflecting a shift in psychometric function threshold parameters to the right (Fig. 9 A, B) and implying a bias to left hand responses after ipsilateral left intraparietal TMS.
Effects of TMS on behavior We conducted a second experiment to examine the causal dependence of decision making and oscillatory activity on the human medial intraparietal cortex. We examined the effect of applying five pulses of 10 Hz (i.e., lasting 400 ms) MRI-guided TMS to this area starting 50 ms after onset of the second cue stimulus. Relatively low intensity TMS was used, ⬃95% of distance-adjusted resting motor threshold (Stokes et al., 2005, 2007), and it was possible to collect analyzable EEG data. It should be noted that any effects of TMS, while hopefully statistically significant, are likely to be small in absolute terms. TMS induces slight and transient disruption to signal-to-noise ratios (Walsh and PascualLeone, 2003; Silvanto et al., 2008), rather than real lesions. More specifically it should be noted that TMS delivery in this experi-
TMS-EEG effects We first established that oscillatory activity still reflected updating and integration of WOE in the same manner as it had in Experiment 1 (data not shown). We then examined whether TMS exerted any effect on the average alpha- or beta-band power over and above the effects due to performance of the decision-making task. Such a model tests for a potential biasing impact of the TMS on spectral power, and we used this approach because the behavioral analysis had suggested that intraparietal TMS induced a bias in behavior (threshold change) rather than a change in the way information was integrated (no effect on slope). We extended the regression model that we had previously fit to spectral data to include a term describing the average effects of TMS, and then fit this model separately to
13814 • J. Neurosci., October 3, 2012 • 32(40):13805–13818
Gould et al. • Oscillatory Correlates of Decision Variables
Figure 7. Bilateral effects of unsigned evidence and surprise. A, The 兩Prior WOE兩, which indexes certainty, and the surprise associated with the most recently observed cue did not significantly modulate spectral lateralization. B, In the average across ROI electrodes in both hemispheres, the prior WOE and cue update WOE had no significant effects, but significant effects of the 兩Prior WOE兩 and surprise terms were found.
Figure 8. A, Significant effects of a surprise/Bayesian normalization term parameter were observed across a range of electrodes, and were strongest at frontal and parieto-occipital electrodes. B, The absolute value of the prior WOE modulated oscillatory activity in the alpha and beta bands across a wide range of electrodes.
Gould et al. • Oscillatory Correlates of Decision Variables
J. Neurosci., October 3, 2012 • 32(40):13805–13818 • 13815
subjects predicted the effects of TMS on their behavioral decision-making performance. The behavioral data analyzed were the intraparietal versus V5 changes in threshold (Fig. 9A). The neural data analyzed were the subtraction between estimated regression coefficients describing the effects of TMS on alpha- and betaband activity for intraparietal versus V5 TMS over the time window starting 800 ms after the second cue presentation and ending at the time the third cue was presented. We focused on the same electrodes, C3, C4, CP3, and CP4, that had been the focus of Experiment 1: the lefthemisphere ROI, the right-hemisphere ROI, and the difference between them (i.e., the LI). For both the alpha and beta bands, repeated-measures ANOVAs on the neural data with factors of ROI (left hemisphere, right hemisphere) and site (control, active) did not reveal any main effects of interactions (all F values ⬍0.9; all p values ⬎0.35). Correlations comparing the behavioral and neural data were performed separately for the left-hemisphere ROI, the right-hemisphere ROI, and the LI. We were primarily interested in investigating whether we could observe a correlate of the psychometric function threshold shift resulting from intraparietal stimulation. Supporting this idea were significant correlations between behavioral and beta-band changes for both hemispheres (left-hemisphere ROI, r ⫽ 0.62, p ⫽ 0.03; right-hemisphere ROI, r ⫽ 0.60, p ⫽ 0.04) (Fig. 9C), although no significant correlation was found for the LI itself (r ⫽ 0.01, p ⫽ 0.97). No significant effects were found for the alpha frequency band (left-hemisphere ROI, r ⫽ ⫺0.13, p ⫽ 0.68; right-hemisphere ROI, r ⫽ ⫺0.18, p ⫽ 0.58; LI, r ⫽ 0.04, p ⫽ 0.89). In summary, intraparietal TMSFigure 9. Effects of TMS on decision behavior and beta-band activity. A, Top, Participants’ responses as a function of the WOE on induced changes in beta-band activity at TMS (red) and no-TMS (black) trials from MIP and V5 stimulation sessions. Bottom, TMS-induced change in psychometric function sensorimotor electrodes correlated with thresholds for each stimulation site. B, MNI locations for MIP (green) and V5 (red) stimulation sites for individual subjects. C, Top, changes in the threshold of logistic psyThis correlation was topographically specific to motor cortex electrodes. Bottom, Correlation between TMS-induced behavioral chometric functions describing particithreshold changes and beta-band modulation at left- (blue) and right-hemisphere (red) sensorimotor cortex electrodes. pants’ choice behavior. Finally, we characterized how particispectral data from each TMS-EEG session. The model was fit pants’ responses varied with the phase of the beta-band oscillato data from 800 ms after onset of the second cue, the earliest tion after TMS. We reasoned that if beta-band changes reflect time at which time–frequency data were undistorted by TMS interareal interactions, then behavioral changes due to TMS may pulses, until the beginning of the response period. The earliest have been more likely when TMS caused a reset in the phase of the TMS artifact-free time reflects that the last TMS pulse was ongoing beta-band oscillation (Leventhal et al., 2012). Following delivered 450 ms after onset of the second cue, the TMS artiMIP TMS, there was a significant relationship between beta phase fact extended ⬃30 ms, and the half-width of our temporal and participants’ responses for the left hemisphere ROI (Fig. 10) smoothing window was 300 ms. (Rayleigh test, p ⬍ 0.01). This coupling was significantly different To identify TMS-induced EEG changes that might be greater after for MIP TMS trials compared with MIP no-TMS trials (Rayleigh intraparietal TMS and that might be related to the behavioral test, p ⬍ 0.05), and the TMS-induced coupling difference comeffects of intraparietal TMS, we tested whether TMS modulated paring MIP with V5 TMS was marginally significant (Rayleigh spectral activity between control and active TMS-EEG sessions, test, p ⫽ 0.056). No significant effects were found for the rightand whether the effects of TMS on spectral power in individual hemisphere ROI.
13816 • J. Neurosci., October 3, 2012 • 32(40):13805–13818
Gould et al. • Oscillatory Correlates of Decision Variables
Discussion In this study, human participants integrated sequentially presented pieces of evidence toward a decision about which of two potential actions should be performed. Responses were sensitive to observed evidence, allowing investigation of how oscillatory activity varied with decision evidence. Through EEG analysis, and by applying TMS to left medial intraparietal cortex, we established five key findings: (1) sensorimotor alphaand beta-band activity varied parametrically with evidence for left- versus right-handed responses, (2) the most recently observed evidence affected oscillatory lateralization in a manner that could be dissociated from representation of the prior and overall decision evidence, (3) decision certainty and surprise at the most recent cue correlated positively with bilateral oscillatory activity, (4) medial intraparietal TMS during decision making biased decisions toward ipsilateral responses, and (5) the behavioral impact of TMS was associated with bilateral increases in sensorimotor betaband activity. Oscillatory correlates of decision variables and decision updating As participants observed a sequence of cues providing partial evidence about the appropriate motor response, a portion of Figure 10. Relationship between beta-band phase and TMS-induced response biases. At the left-hemisphere sensorimotor variance in alpha- and beta-band lateral- ROI, beta phase predicted participants’ responses on TMS trials following MIP stimulation. Plots are histograms of the preferred ization reflected the integrated weight of phase angle in each condition. The red lines shows the mean direction. evidence provided by cues. This finding At the time each cue was presented, alpha- and beta-band complements results demonstrating that beta- and gamma-band lateralization was related to the prior WOE—the integrated lateralization in M1 can predict behavioral choices toward the logLR associated with previous cues. After ⬃500 ms, oscillatory end of a decision period (Donner et al., 2009). The precise nature lateralization in both frequency bands was modulated by the upof the decision variable encoded by sensorimotor alpha- and date WOE furnished by the logLR of the most recently observed beta-band modulation remains to be determined, and indeed cue. These relationships suggest that oscillatory lateralization recomputational accounts of decision making differ in the quantiflects maintenance of a decision variable and dynamically reconties they emphasize such as log probability in favor of a decision figures to reflect the integrated evidence as new shapes are outcome (Bogacz and Gurney, 2007; Bogacz, 2009), log posterior observed. Intriguingly, beta-band lateralization transiently reodds (Wang, 2002; Soltani and Wang, 2010), or logLRs (Yang flected the update WOE over and above the integrated WOE and Shadlen, 2007). While these quantities are closely correlated term, which included both the prior and update WOE. In other and difficult to disambiguate in our experimental design, we note words, significant portions of sensorimotor beta-band modulathat several potentially confounding alternative variables can be tion and its lateralization reflected information about cues that ruled out here. Previous decision-making studies have reported guided action planning rather than the action itself (Hatsopoulos that parietal and frontal activity scales with overall decision unand Suminski, 2011; Leventhal et al., 2012). certainty (Volz et al., 2004; Huettel et al., 2005; Donner et al., Several bilateral oscillatory modulations occurred simultane2007; de Lange et al., 2010), perceptual difficulty or attentional ously in relation to different decision variables. For example, while load (Heekeren et al., 2004; Tosoni et al., 2008), and surprise lateralization of alpha- and beta-band activity increased as the time (Bestmann et al., 2008a; Mars et al., 2008). Nevertheless, inclufor responding neared, bilateral oscillatory activity was greatest when sion of two additional model parameters, the absolute value of certainty about the appropriate response was high. Increased betathe prior evidence (indexing uncertainty) and log probability of band activity was reported previously with greater response accuracy observing the cue given the prior WOE (indexing surprise at in a visual motion detection task while lateralization of beta-band observing the cue), did not significantly modulate alpha- or betaactivity reflected the integrated visual motion signal that might have band lateralization or diminish the significance of the WOE served as the response evidence (Donner et al., 2009, 2007). The terms on oscillatory lateralization. In addition, parametric WOE effect of certainty on increased beta-band activity may also reflect changes remained significant in explaining alpha- and beta-band reduced responsiveness, by the motor circuit, to new evidence bearactivity even after controlling for categorical response preparation effects. ing on the decision (de Lange et al., 2010).
Gould et al. • Oscillatory Correlates of Decision Variables
Optimal updating of a decision variable in light of new evidence can be described in Bayesian terms as a function of (1) the weight of the prior evidence, (2) the weight of the new piece of evidence, and (3) a divisive normalization term. As discussed above, alpha- and beta-band lateralization were sensitive to the first two of these terms. We note that bilateral oscillatory activity was also modulated by a surprise-related parameter, which is equal to the logarithm of the third term used for normalization during Bayesian updating. It is also a component in models describing how Bayesian decision updating occurs via cortico-basal ganglia loops. These models predict that prior decision variable log probabilities are combined with new decision information in cortical integrators, then normalized by such a term via diffuse projections from the subthalamic nucleus and globus pallidus that lead back to the cortex (Frank, 2006; Bogacz and Gurney, 2007). The same cortico-basal ganglia circuits can also generate strong betaband activity (Nevado Holgado et al., 2010). Our data suggest that all three of these quantities are represented in the human brain in a sequential order that is consistent with the model proposed by Bogacz and Gurney (2007), raising the possibility that the oscillatory signals we report provide a direct window into the neural computations underlying decision making. Effects of intraparietal TMS on decision making While decision making reflects the integrity of distributed circuits with subcortical components such as pallidum and subthalamic nucleus (Frank, 2006; Bogacz and Gurney, 2007), the present study also demonstrates its dependence on the intraparietal sulcus. TMS over a medial intraparietal region resembling macaque MIP (Mars et al., 2011) biased subjects toward ipsilateral responses, even though timing of TMS was not optimal for inducing behavioral change. Such an ipsilateral bias is expected if parietal areas are primarily concerned with integration of evidence toward contralateral hand responses when the two hands are competing to be chosen (Oliveira et al., 2010). TMS causes destructive interference as opposed to the constructive interference induced by microstimulation targeted to neurons with particular response fields. Nevertheless, TMS and microstimulation effects can often be related; intraparietal microstimulation (Hanks et al., 2006), just like TMS here, induced response bias, as opposed to changes in evidence accumulation quality that would have been indexed by changes in the slope of a fitted psychometric function. Correlated effects of TMS on beta-band activity and behavior Not only the decision, but also beta-band activity, was causally dependent on the intraparietal sulcus; individual variability in decision threshold biases was correlated with individual differences in bilateral sensorimotor beta-band effects seen after intraparietal, as opposed to control, TMS. Although intraparietal TMS-induced betaband changes were most prominent over the same sensorimotor areas as identified previously in this study, their precise nature merits further investigation. Among other possibilities, the beta-band changes may have reflected reduced responsiveness to further evidence (de Lange et al., 2010) or reduced response preparation. The correlated changes in decision and beta activity underscore the intimacy of the relationship between this aspect of the EEG and decision making. Several considerations suggest that they cannot be dismissed as consequences of volume conduction: (1) the differential nature of the effect induced by intraparietal versus control TMS, (2) that no similar effects were seen in other frequency bands, and (3) the distribution of the effect over sensorimotor areas. Furthermore, the phase of post-TMS beta-band activity was predictive of partici-
J. Neurosci., October 3, 2012 • 32(40):13805–13818 • 13817
pants’ responses following intraparietal TMS. Given that salient cues can cause resetting in the phase of beta-band activity (Leventhal et al., 2012), TMS may have had a greater impact on behavior on trials where it caused a reset in the phase of the ongoing beta-band oscillation. While parietal TMS directly affects a limited region of cortex (Walsh and Cowey, 2000; Walsh and Pascual-Leone, 2003), it may impact on other functionally coupled areas (O’Shea et al., 2007; Bestmann et al., 2008b). It may make sense that TMS effects are correlated with beta-band increases if the beta-band changes themselves reflect long-range interactions (Engel and Fries, 2010; Wang, 2010). Beta-band modulations have been reported between parietal and premotor cortex during visually guided response selection (Pesaran et al., 2008; Dean et al., 2012), and between superior parietal cortex and primary motor cortex (Witham et al., 2007). The potential for beta-band activity to mediate interareal coupling has been emphasized, perhaps because oscillations in this frequency, as opposed to gamma, may be more robust during long-range coupling because of their resistance to synaptic delays (Kopell et al., 2000). The results suggest one way in which insights about beta-band roles in long-range interactions and in motor control may be combined. They suggest that beta-band modulations do not simply reflect motor preparation, but continuously reflect the sensorimotor cortex’s receipt of signals tracking probabilistic quantities that should govern optimal response selection and updating of decision variables as new information is revealed. Similarly, correlated behavioral changes and increases in beta-band activity may occur when effects of cortical disruption propagate throughout the brain.
References Baker SN (2007) Oscillatory interactions between sensorimotor cortex and the periphery. Curr Opin Neurobiol 17:649 – 655. Berens P (2009) CircStat: A MATLAB toolbox for circular statistics. J Stat Software 31:1–21. Bestmann S, Ruff CC, Blankenburg F, Weiskopf N, Driver J, Rothwell JC (2008a) Mapping causal interregional influences with concurrent TMSfMRI. Exp Brain Res 191:383– 402. Bestmann S, Harrison LM, Blankenburg F, Mars RB, Haggard P, Friston KJ, Rothwell JC (2008b) Influence of uncertainty and surprise on human corticospinal excitability during preparation for action. Curr Biol 18:775– 780. Bogacz R (2009) Optimal decision-making theories. In: Handbook of reward and decision making (Dreher JC, Tremblay L, eds), pp 375–397. New York: Academic. Bogacz R, Gurney K (2007) The basal ganglia and cortex implement optimal decision making between alternative actions. Neural Comput 19: 442– 477. Buschman TJ, Miller EK (2007) Top-down versus bottom-up control of attention in the prefrontal and posterior parietal cortices. Science 315: 1860 –1862. Cotti J, Rohenkohl G, Stokes M, Nobre AC, Coull JT (2011) Functionally dissociating temporal and motor components of response preparation in left intraparietal sulcus. Neuroimage 54:1221–1230. Dean HL, Hagan MA, Pesaran B (2012) Only coherent spiking in posterior parietal cortex coordinates looking and reaching. Neuron 73:829 – 841. de Lange FP, Jensen O, Dehaene S (2010) Accumulation of evidence during sequential decision making: the importance of top-down factors. J Neurosci 30:731–738. Donner TH, Siegel M (2011) A framework for local cortical oscillation patterns. Trends Cogn Sci 15:191–199. Donner TH, Siegel M, Oostenveld R, Fries P, Bauer M, Engel AK (2007) Population activity in the human dorsal pathway predicts the accuracy of visual motion detection. J Neurophysiol 98:345–359. Donner TH, Siegel M, Fries P, Engel AK (2009) Buildup of choicepredictive activity in human motor cortex during perceptual decision making. Curr Biol 19:1581–1585. Engel AK, Fries P (2010) Beta-band oscillations—signalling the status quo? Curr Opin Neurobiol 20:156 –165.
13818 • J. Neurosci., October 3, 2012 • 32(40):13805–13818 Foxe JJ, Snyder AC (2011) The role of alpha-band brain oscillations as a sensory suppression mechanism during selective attention. Front Psychol 2:154. Frank MJ (2006) Hold your horses: A dynamic computational role for the subthalamic nucleus in decision making. Neural Netw 19:1120 –1136. Gold JI, Shadlen MN (2007) The neural basis of decision making. Annu Rev Neurosci 30:535–574. Grefkes C, Ritzl A, Zilles K, Fink GR (2004) Human medial intraparietal cortex subserves visuomotor coordinate transformation. Neuroimage 23:1494 –1506. Hanks TD, Ditterich J, Shadlen MN (2006) Microstimulation of macaque area LIP affects decision-making in a motion discrimination task. Nat Neurosci 9:682– 689. Hatsopoulos NG, Suminski AJ (2011) Sensing with the motor cortex. Neuron 72:477– 487. Heekeren HR, Marrett S, Bandettini PA, Ungerleider LG (2004) A general mechanism for perceptual decision-making in the human brain. Nature 431:859 – 862. Hesse MD, Thiel CM, Stephan KE, Fink GR (2006) The left parietal cortex and motor intention: an event-related functional magnetic resonance imaging study. Neuroscience 140:1209 –1221. Hinkley LBN, Krubitzer LA, Padberg J, Disbrow EA (2009) Visual-manual exploration and posterior parietal cortex in humans. J Neurophysiol 102:3433–3446. Huettel SA, Song AW, McCarthy G (2005) Decisions under uncertainty: Probabilistic context influences activation of prefrontal and parietal cortices. J Neurosci 25:3304 –3311. Hunt LT, Kolling N, Soltani A, Woolrich MW, Rushworth MF, Behrens TE (2012) Mechanisms underlying cortical activity during value-guided choice. Nat Neurosci 15:470 – 476, S1–S3. Kiebel SJ, Tallon-Baudry C, Friston KJ (2005) Parametric analysis of oscillatory activity as measured with EEG/MEG. Hum Brain Mapp 26:170 –177. Knowlton BJ, Mangels JA, Squire LR (1996) A neostriatal habit learning system in humans. Science 273:1399 –1402. Kolster H, Peeters R, Orban GA (2010) The retinotopic organization of the human middle temporal area MT/V5 and its cortical neighbors. J Neurosci 30:9801–9820. Kopell N, Ermentrout GB, Whittington MA, Traub RD (2000) Gamma rhythms and beta rhythms have different synchronization properties. Proc Natl Acad Sci U S A 97:1867–1872. Leventhal DK, Gage GJ, Schmidt R, Pettibone JR, Case AC, Berke JD (2012) Basal ganglia beta oscillations accompany cue utilization. Neuron 73:523–536. Maris E, Oostenveld R (2007) Nonparametric statistical testing of EEG- and MEG-data. J Neurosci Methods 164:177–190. Mars RB, Debener S, Gladwin TE, Harrison LM, Haggard P, Rothwell JC, Bestmann S (2008) Trial-by-trial fluctuations in the event-related electroencephalogram reflect dynamic changes in the degree of surprise. J Neurosci 28:12539 –12545. Mars RB, Jbabdi S, Sallet J, O’Reilly JX, Croxson PL, Olivier E, Noonan MP, Bergmann C, Mitchell AS, Baxter MG, Behrens TE, Johansen-Berg H, Tomassini V, Miller KL, Rushworth MF (2011) Diffusion-weighted imaging tractography-based parcellation of the human parietal cortex and comparison with human and macaque resting-state functional connectivity. J Neurosci 31:4087– 4100. Mitra PP, Pesaran B (1999) Analysis of dynamic brain imaging data. Biophysical J 76:691–708. Nevado Holgado AJ, Terry JR, Bogacz R (2010) Conditions for the generation of beta oscillations in the subthalamic nucleus-globus pallidus network. J Neurosci 30:12340 –12352. Oliveira FT, Diedrichsen J, Verstynen T, Duque J, Ivry RB (2010) Transcranial magnetic stimulation of posterior parietal cortex affects decisions of hand choice. Proc Natl Acad Sci U S A 107:17751–17756. Oostenveld R, Fries P, Maris E, Schoffelen JM (2011) Fieldtrip: open source software for advanced analysis of MEG, EEG, and invasive electrophysiological data. Comput Intell Neurosci 2011:1–9. O’Shea J, Johansen-Berg H, Trief D, Go¨bel S, Rushworth MF (2007) Functionally specific reorganization in human premotor cortex. Neuron 54:479 – 490. Pesaran B, Nelson MJ, Andersen RA (2008) Free choice activates a decision circuit between frontal and parietal cortex. Nature 453:406 – 409.
Gould et al. • Oscillatory Correlates of Decision Variables Pfurtscheller G, Stanca´k A, Neuper C (1996) Event-related synchronization (ERS) in the alpha band – an electrophysiological correlate of cortical idling: a review. Internat J Psychophysiol 24:39 – 46. Pfurtscheller G, Lopes da Silva FH (1999) Event-related EEG/MEG synchronization and desynchronization: basic principles. Clin Neurophysiol 110:1842–1857. Philiastides MG, Biele G, Heekeren HR (2010) A mechanistic account of value computation in the human brain. Proc Natl Acad Sci U S A 107:9430 –9435. Rushworth MF, Paus T, Sipila PK (2001a) Attention systems and the organization of the human parietal cortex. Neuroimage 13:S353–S353. Rushworth MF, Ellison A, Walsh V (2001b) Complementary localization and lateralization of orienting and motor attention. Nat Neurosci 4:656 – 661. Rushworth MF, Johansen-Berg H, Go¨bel SM, Devlin JT (2003) The left parietal and premotor cortices: motor attention and selection. Neuroimage 20:S89 –S100. Scheperjans F, Eickhoff SB, Ho¨mke L, Mohlberg H, Hermann K, Amunts K, Zilles K (2008) Probabilistic maps, morphometry, and variability of cytoarchitectonic areas in the human superior parietal cortex. Cereb Cortex 18:2141–2157. Siegel M, Donner TH, Oostenveld R, Fries P, Engel AK (2008) Neuronal synchronization along the dorsal visual pathway reflects the focus of spatial attention. Neuron 60:709 –719. Siegel M, Engel AK, Donner TH (2011) Cortical network dynamics of perceptual decision-making in the human brain. Front Hum Neurosci 5:21. Silvanto J, Muggleton N, Walsh V (2008) State-dependency in brain stimulation studies of perception and cognition. Trends Cogn Sci 12:447– 454. Soltani A, Wang XJ (2010) Synaptic computation underlying probabilistic inference. Nat Neurosci 13:112–119. Stokes MG, Chambers CD, Gould IC, Henderson TR, Janko NE, Allen NB, Mattingley JB (2005) Simple metric for scaling motor threshold based on scalp-cortex distance: Application to studies using transcranial magnetic stimulation. J Neurophysiol 94:4520 – 4527. Stokes MG, Chambers CD, Gould IC, English T, McNaught E, McDonald O, Mattingley JB (2007) Distance-adjusted motor threshold for transcranial magnetic stimulation. Clin Neurophysiol 118:1617–1625. Swisher JD, Halko MA, Merabet LB, McMains SA, Somers DC (2007) Visual topography of human intraparietal sulcus. J Neurosci 27:5326 –5337. Tosoni A, Galati G, Romani GL, Corbetta M (2008) Sensory-motor mechanisms in human parietal cortex underlie arbitrary visual decisions. Nat Neurosci 11:1446 –1453. van Wijk BC, Daffertshofer A, Roach N, Praamstra P (2009) A role of beta oscillatory synchrony in biasing response competition? Cereb Cortex 19:1294 –1302. Veniero D, Bortoletto M, Miniussi C (2009) TMS-EEG co-registration: on TMS-induced artifact. Clin Neurophysiol 120:1392–1399. Volz KG, Schubotz RI, von Cramon DY (2004) Why am I unsure? Internal and external attributions of uncertainty dissociated by fMRI. Neuroimage 21:848 – 857. Walsh V, Cowey A (2000) Transcranial magnetic stimulation and cognitive neuroscience. Nat Rev Neurosci 1:73–79. Walsh V, Pascual-Leone A (2003) Transcranial magnetic stimulation: a neurochronometrics of mind. Cambridge, MA: MIT. Wang XJ (2002) Probabilistic decision making by slow reverberation in cortical circuits. Neuron 36:955–968. Wang XJ (2010) Neurophysiological and computational principles of cortical rhythms in cognition. Physiol Rev 90:1195–1268. Witham CL, Wang M, Baker SN (2007) Cells in somatosensory areas show synchrony with beta oscillations in monkey motor cortex. Eur J Neurosci 26:2677–2686. Wolpaw JR, McFarland DJ (2004) Control of a two-dimensional movement signal by a noninvasive brain-computer interface in humans. Proc Natl Acad Sci U S A 101:17849 –17854. Worden MS, Foxe JJ, Wang N, Simpson GV (2000) Anticipatory biasing of visuospatial attention indexed by retinotopically specific alpha-band electroencephalography increases over occipital cortex. J Neurosci 20:RC63. Yang T, Shadlen MN (2007) Probabilistic reasoning by neurons. Nature 447:1075–1080.