Effective VM Sizing in Virtualized Data Centers Ming Chen∗ , Hui Zhang† , Ya-Yunn Su‡ , Xiaorui Wang∗ , Guofei Jiang† , Kenji Yoshihira† ∗
University of Tennessee Knoxville, TN 37996 Email:
[email protected],
[email protected]. † NEC Laboratories America Princeton, NJ 08540 Email: {huizhang,gfj,kenji}@nec-labs.com. ‡ National Taiwan University Taipei, Taiwan 106, R.O.C Email:
[email protected].
Abstract—In this paper, we undertake the problem of server consolidation in virtualized data centers from the perspective of approximation algorithms. We formulate server consolidation as a stochastic bin packing problem, where the server capacity and an allowed server overflow probability p are given, and the objective is to assign VMs to as few physical servers as possible, and the probability that the aggregated load of a physical server exceeds the server capacity is at most p. We propose a new VM sizing approach called effective sizing, which simplifies the stochastic optimization problem by associating a VM’s dynamic load with a fixed demand. Effective sizing decides a VM’s resource demand through statistical multiplexing principles, which consider various factors impacting the aggregated resource demand of a host where the VM may be placed. Based on effective sizing, we design a suite of polynomial time VM placement algorithms for both VM migration cost-oblivious and migration cost-aware scenarios. Through analysis, we show that our algorithm is O(1)approximation for the stochastic bin packing problem when the VM loads can be modeled as all Poisson or all normal distributions. Through evaluations driven by a real data center load trace, we show that our consolidation solution can achieve an order of reduction on physical server requirement compared to that before consolidation; the consolidation result is only 24% more than the optimal solution. With effective sizing, our server consolidation solution achieves 10% to 23% more energy savings than state-of-the-art approaches.
I. I NTRODUCTION Increasing the actual amount of computing work completed in the data center relative to the amount of energy used, is an urgent need in the new green IT initiative, and server consolidation can have a significant effect on overall data center performance per watt. Server consolidation is based on the observation that many enterprise servers do not utilize the available server resources maximally all of the time, and virtualization technologies facilitate consolidation of several physical servers onto a single high end system for higher resource utilization. In this paper, we formulate server consolidation in virtualized data centers as a stochastic bin packing problem. The problem takes the following probabilistic SLA objective: the probability that the aggregate resource demand exceeds the server capacity is at most p. A new VM sizing concept
called effective sizing is introduced to address it. The basic idea of effective sizing is taking a VM’s resource demand as a random variable, and estimating its contribution to the aggregate resource demand of a server through two parts: the intrinsic demand, which is a function of the VM’s own demand in a distribution and the server’s capacity; and the correlationaware demand, which is a function of the VM’s demand and its time-line correlation relationship with the resource demand of the other VMs in the server. Clearly, the effective size of a VM is dependent not only on its own demand, but also on the demand of the co-hosted VMs along the time; this is a natural reflection of the statistical multiplexing effect in virtualized data centers when multiple VMs are packed on the same server. Based on effective sizing, we develop the VM placement algorithms for server consolidation with and without VM migration cost concerns. We show the O(1)-approximation properties of the VM placement algorithm for VM load models including all Poisson and all normal distributions. On evaluation, We test our algorithms through a virtual data center consolidation of 2525 servers based on real data traces. we show that our VM consolidation solution can achieve an order of reduction on physical server requirement compared to that before consolidation; actually the consolidation result can be only 24% more than the optimal solution. With effective sizing, our server consolidation achieves 10% to 23% more energy savings than state-of-the-art approaches. The rest of the paper is organized as follows. In Section II we present the related work. Section III presents the problem formulation and our solution to the server consolidation problem, and Section IV shows the analysis results of the proposed VM placement algorithms. We present the tracebased evaluation results in Section V, and conclude this paper in Section VI with future work. II. R ELATED W ORK Server consolidation and VM placement in virtualized data centers has recently received a lot of attention. Bobroff et al [1] outline a systematic approach to identify the servers that are good candidates for dynamic placement, and present
a mechanism for dynamic migration of VMs based on a load forecast. Verma et al [9] present a power-aware application placement methodology and system in the context of a runtime placement controller. Verma et al [10] present two new consolidation methods that take both load correlation and dynamics into VM placement considerations. Meng et al [7] propose a joint-VM provisioning approach in which multiple VMs are consolidated and provisioned based on an estimation of their aggregate resource need. In comparison, our effective sizing based approach is the first to undertake statistical multiplexing in VM resource allocation from the perspective of approximation algorithms, and has a provable performance and complexity. Stochastic bin packing has been studied from the perspective of approximation algorithms. Kleinberg et al [6] consider traffic admission control in high-speed networks, and develop approximation algorithms to solve the corresponding stochastic bin packing problem restricted to on-off sources. Goel and Indyk [4] further extend the study on other source models including more probability distributions. Our work is the first to study this problem in the VM co-hosting application, and effective sizing is a new approach different from the effective bandwidth defined in the previous work.
[5]: it associates each random variable with a fixed value, and then simplifies the stochastic problem into a deterministic version, which has many approximation algorithms with good performance. However, previous work focus on random variables with specific distributions (e.g., weighted Bernoulli trials), and does not take load correlation into consideration. We introduce effective sizing to address the above issues with the following definition: let a random variable Xi represent a VM i’s resource demand, and another random variable Xj represent a server j’s existing aggregate resource demand from the VMS already allocated to it; The Effective Size (ES) of i if hosted on server j consists of two parts: •
I ESij =
N −1 X
P r[
k=0
III. E FFECTIVE S IZING BASED S ERVER C ONSOLIDATION
•
i:Xi ∈Sj
for all 1 ≤ j ≤ k. This is a natural analog of the deterministic bin packing problem, and is NP-complete. Actually, for some random variables (such as Bernoulli trials) even computing X Xi > 1] P r[
B. Effective Sizing Effective sizing follows the basic idea of effective bandwidth
(2)
•
Uk > Cj ] ≤ p
(3)
where Uk are independent and identically distributed (i.i.d.) random variables with the same distribution as Xi , and Cj is the server utilization target of server j. Intuitively, Nij is the maximal number of VMs that can be packed into server j without breaking the probabilistic SLA when all the VMs have the same workload pattern as VM i. Correlation-aware demand q q CA ESij = Zα ( σi2 + σj2 + 2ρσi σj − σi2 + σj2 ) (4) where σi2 and σj2 are the variances of the random variables Xi and Xj ; ρ is the correlation coefficient between Xi and Xj ; Zα denotes the α-percentile for the unit normal distribution (α = 1 − p). For example, if we want the overflow probability p = 0.25%, then α = 99.75%, and Zα = 3. I CA Finally, ESij = ESij + ESij .
i:Xi ∈Sj
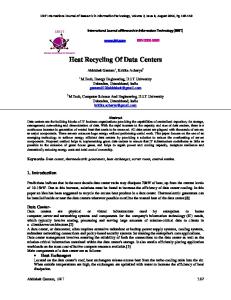
VM Effective Size 40
Single VM load: normal distribution, mean=10, s-d=10
35 30 effective size
is NP-complete [6]. Mapped back to the server consolidation application, a random variable represents the workload distribution of a VM, and each P bin Si represents a physical server. The constraint P r[ i:Xi ∈Sj Xi > 1] ≤ p can be translated into a probabilistic Server Level Agreement (SLA): the probability that the aggregate resource demand exceeds the server utilization target is at most p. The bin size 1 represents the server utilization consolidation target (100% by default), and can be other value (e.g., 90% or 200%). In the original stochastic bin packing problem, workload correlation is not considered.
Cj Nij
and Nij is the maximal value of N satisfying the following constraint
A. Problem Formulation We introduce effective sizing in the context of the stochastic bin packing problem. The original problem is defined as the following [4]: given a set of items, whose size is described by independent random variables S = {X1 , X2 , . . . , Xn }, and an overflow probability p, partition the set S into the smallest number of set (bins) S1 , . . . , Sk such that X Xi > 1] ≤ p (1) P r[
Intrinsic demand
25 20 15 10 5 0 30 60 90 120 150 180 210 240 270 300 330 360 390 420 450 480 server capacity
Fig. 1. Effective sizing example: i.i.d random variables with normal distribution
Clearly, the effective size of a VM is not only dependent on its own demand, but also the demand of the co-hosted VMs along the time; this is a natural reflection of the statistical multiplexing effect in virtualized data centers when multiple VMs are packed into the same server. Figure 1 shows a VM’s effective size as a function of the server capacity, for an example load model: normal distributions (a good approximation for the server load in practice due to the central limit theorem [3]). Assume the VMs to be packed have i.i.d. load with normal distribution (µ = 10, σ = 10), and the overflow probability is 5% (the corresponding Zα = 2). When the server capacity is 30, the effective size of a VM is 30, which is actually the 95-percentile load of this VM. When the server capacity increases, the effective size of the VM decreases: the effective size is 20 (the 70-percentile load of this VM) when the server capacity is 80; the effective size is less than 14.4 after the server capacity is large than 300. Intuitively, effective sizing allocates less resource buffer for smaller VMs (relative to the hosting server’s capacity) since the statistical-multiplexing gain increase with the number of random variables in a bin. Later in Section IV we will study the correctness of effective sizing for a few load distribution models, and in Section V we will validate effective sizing on real data center workload with no model assumption. I On intrinsic demand ESij , we note that the computation of Equation( 3) is much simpler than that for the constraint ( 1) in the original problem. It is easy to show that Equation( 3) can be solved in polynomial time even for Bernoulli trials. In Section IV, we will present the analysis for the VM placement algorithm when using intrinsic demand for independent workloads. Lastly, we would like to point out that in a homogeneous server cluster with the same utilization I target setting, the intrinsic demand ESij can have the subscript j dropped and be computed only once for the whole cluster. CA , we note that it is On correlation-aware demand ESij a heuristic to approximately estimate the demand variation affected by load correlation. Equation( 4) approximates Xi and Xj two correlated random variables with normal distributions, I and compensates the error in ESij due to the ignorance of load correlation. Lastly, we would like to point out that the CA computation complexity for ESij in a placement scheme 2 is O(N M d) instead of O(N d) in other correlation-aware placement schemes [10] (N : number of VMs; M : number of servers; d: data points of workload time series); in a virtualized data center, M is typically an order less than N . C. VM Placement Algorithms Server consolidation can be loosely classified into static, semi-static and dynamic consolidation based on the management frequency [10]. In this subsection, we present three VM placement algorithms based on effective sizing which have their pros and cons in terms of algorithm simplicity, consolidation efficiency, and migration cost. The solution choice in a consolidation scenario depends on the trade-off made among the three factors.
1) VM Placement - Independent Workload : We present the first VM placement algorithm which assumes independent workload among the VMs. It is easy to integrate coarsegranularity load correlation information into this algorithm by introducing VM affinity rules (e.g., VM placement affinity rules such as not hosting VMs a and b together due to concurrent peak loads) during the placement process. Data Structures: • VM list with the load distributions. • physical server list including the server utilization target and the overflow probability. Algorithm on a cluster with homogeneous servers. 1) Calculate the effective size of the VMs, using Equation ( 2) and ( 3). 2) Sort the VMs in decreasing order by the effective size. 3) Place each VM in order to the first server in the list with sufficient remaining capacity (aka, the sum of allocated VM effective size is no more than the server utilization target). Fig. 2.
Independent Workload VM Placement Algorithm
As shown in Figure 2, Effective Sizing-based Independent Workload (ES-IW) VM Placement Algorithm is a combination of effective sizing and the First Fit Decreasing (FFD) strategy, which has been shown to use no more than 11/9 OPT + 1 bins (where OPT is the number of bins given by the optimal solution) for the deterministic bin packing problem [12]. ES-IW VM placement algorithm is simple, greedy for energy efficiency, but may cause high migration cost as it does not consider VM hosting history information. It fits for static or semi-static server consolidation. In practice, it might be a problem to solve Equation ( 3) without a simple load model. One alternative is using normal distribution model for approximation and calculating (µi , σi ) for each VM i based on its load. The closed-form solution for Equation( 3) under normal distribution is: p 2Zα2 σi2 + 4µi Cj − 2Zα σi Zα2 σi2 + 4µi (5) Nij = 4µ2i For a heterogeneous cluster where a VM’s effective size can not be pre-computed before step 3, we can modify Step 1 and 2 so that the placement order is based on the value (µi + Zα σi ), and use the actual effective size in the target server for step 3. To incorporate the server power efficiency factor into consideration, we can sort the servers in decreasing order by the power efficiency metrics in Step 3, like that in [9]. To consider other resource constraints such as memory, we can add them in Step 3 as the constraints when judging a server’s availability. The above discussions apply to the next two VM
placement algorithms as well, and will not be repeated for brevity. 2) VM Placement - Correlation aware: We present the second VM placement algorithm which drops the load independence assumption. Data Structures: • VM list with the load distributions. • physical server list including the server utilization target and the overflow probability. Algorithm on a cluster with homogeneous servers. 1) Calculate intrinsic load ESiI of the VMs. 2) Sort VMs in decreasing order by ESiI . 3) Place each VM i in order to the best non-empty server in the list which has sufficient remaining capacity and yields the minimal correlation-aware CA demand ESij for i. If no such server is available, pick the next empty server in the server list and repeat. Fig. 3.
Correlation Aware (CA) VM Placement Algorithm
As shown in Figure 3, Effective Sizing-based Correlation Aware (ES-CA) VM Placement Algorithm is a combination of effective sizing and a variant of the Best Fit Decreasing (BFD) strategy, which has been shown to have the same approximation performance as FFD for the deterministic bin packing problem. ES-CA VM placement algorithm is simple, correlationaware, but may cause high migration cost like the IW algorithm. It fits for semi-static server consolidation which takes a moderate frequency and also wants to respond to workload variation in some degree. 3) VM Placement - History and Correlation Aware: We present the third VM placement algorithm which drops the load independence assumption and considers the VM hosting history information. As shown in Figure 4, Effective Sizing-based History and Correlation Aware (ES-HCA) VM Placement Algorithm is a combination of effective sizing and a heuristic for historyaware bin packing. It is higher in computation complexity and makes best effort for achieving trade-off between consolidation efficiency and migration cost (number of VMs migrated). It fits for dynamic consolidation which takes a fast frequency and utilizes workload variation along the time for maximal energy efficiency. D. Discussions On product implementations, industry VM management tools such as VMware’s Dynamic Power Management [11] and NEC’s SigmaSystemCenter [8] have the consolidation
component (called host power-off recommendations) where our algorithms can be implemented. On workload distribution modeling, we proposed normal distribution model for approximation based on the central limit theorem and the common multiple-VM co-hosting settings in virtualized data centers. Note effective sizing needs only the mean and variance of each VM’s load based on the history data. We will show in Section V that this model approximation works well on a set of real data center workload traces. In stochastic bin packing, it assumes that the load of a VM is a stationary process and the load distribution is stable over time. In real-world applications this assumption may not hold. To alleviate this dynamics issue, one technique is time segmentation where the load process in a smaller time segment assumes to be more stable than the full consolidation period. On migration cost, the ES-HCA algorithm only considers the number of migrated VMs as the metric, while VM migration could have an impact on energy efficiency, CPU and network usages, or application performance cost. Including those costs into the consideration and achieving that maximal energy efficiency is the future work in our algorithm design. Our SLA is defined on server-side utilization performance, while many SLAs are defined on client-side application performance. While we position our algorithm applications at the infrastructure management layer, integrating them with application-layer performance management is an interesting research topic. IV. A NALYSIS In this section, we present the analytic results on the VM placement algorithm in the stochastic bin packing problem defined in Section III-A, which assumes independent random variables. We study the cases where the item size (VM load) distributions are all Poisson, or all normal distributions. A. Poisson Distributions For Poisson-distribution VM load, we have the following result. Theorem 4.1: For items with independent Poisson variables, ES-IW VM placement algorithm finds a packing of items in bins of size 1+ with overflow probability p such ∗ that the number of bins used is at most ( 11 9 B + 1), where ∗ B is the minimum possible number of bins. Proof: Let {X1 , X2 , . . . , Xn } be n items with Poisson variables, and P (xi )denote the Poisson variable with mean xi . For independent Poisson variables, the following fact holds: P (x1 ) + P (x2 ) =D P (x1 + x2 ) where X =D Y indicates that the random variables X and Y have identical distributions. Hence, the random variable corresponding to the sum of items in a bin is just a Poisson variable with mean equal to the sum of means of the individual items. Therefore, the overflow probability constraint in Equation(1) can be translated to the constraint that the sum of the means
Data Structures: • VM list with the load distributions and existing VM hosting information (V Mi , Serverj ). • Physical server list including load information, server utilization target and the overflow probability. Algorithm 1) Sort physical servers in decreasing order by the measured server load. 2) For each overloaded server j with violated SLAs (overflow probability > p) CA a) Sort the VMs in the server in decreasing order by the correlation-aware demand ESij . b) Place each VM i in order to the best non-empty and non-overloaded server k in the list which has CA sufficient remaining capacity and yields the minimal correlation-aware demand ESik . If no such server is available, pick the next empty server in the server list and repeat. c) If j’s load meets the overflow constraint after moving out VM i, terminates the searching process for this server and go to next overloaded server; otherwise, continue the searching for the remaining VMs. Fig. 4.
History and Correlation Aware (HCA) VM Placement Algorithm
of the random variables packed in the bin not be larger than µp , which is derived by solving P r[P (µp ) > 1] = p Now, the stochastic bin packing problem is equivalent to the deterministic version of bin-packing problem, with the size of each bin set to µp . The effective size of each Poisson random variable Xi equals to its mean. As ES-IW VM placement algorithm uses the FFD algorithm, its bin packing performance is the same as FFD in the deterministic problem, which is shown to use no more than 11/9 OPT + 1 bins [12].▽ Theorem 4.1 says that in a stochastic setting with Poisson variables, ES-IW VM placement algorithm has the O( 11 9 ) approximation performance, the same as that of the FFD algorithm in a deterministic setting.
B. Normal Distributions For normal-distribution VM load, we have the following result. Theorem 4.2: For items with independent normal variables, ES-IW VM placement algorithm finds a packing of items in bins of size 1 + rc with overflow probability p such that the ∗ ∗ number of bins used is at most ( 11 9 B + 1), where B is the minimum possible number of bins, and rc ≤ 0.496. Proof: Let X1 , . . . , Xn be n normal random variables of types (µ1 , σ12 ), . . ., (µn , σn2 ), where (µi , σi2 ) is the (mean, variance) of the normal distribution. For independent normal random variables, the following fact holds: (µa , σa2 ) + (µb , σb2 ) =D (µa + µb , σa2 + σb2 ) where X =D Y indicates that the random variables X and Y have identical distributions. Hence, the random variable corresponding to the sum of items in a bin is just a normal variable with mean equal to the sum of means, and variance equal to the sum of variances of the individual items.
Therefore, the overflow probability constraint in Equation(1) can be translated to s X X µi + Zα σi2 ≤ 1 i:Xi ∈Sj
i:Xi ∈Sj
and the overflow probability constraint in Equation Equation(3 can be translated to 1 q N µi + Zα N σ22 ≤ 1
where Zα denotes the α-percentile for the unit normal distribution (α = 1 − p). For Ni , the maximal value of N , satisfies q (6) Ni µi + Zα Ni σi2 = 1
Now, the stochastic bin packing problem is translated to the deterministic version of bin-packing problem, with the size of each bin set to 1. The effective size of each normal random variable Xi equals to N1i in Equation(6). As ES-IW VM placement algorithm uses the FFD algorithm, its bin packing performance is the same as FFD in the deterministic problem. However, one remaining question is that during the placement, when we decide to sum up the load of a VM i onto the existing aggregate load of server j, does the overflow constraint based on effective size ESi + ESj ≤ 1 equal to the original overflow constraint (7)? q µi + µj + Zα σi2 + σj2 ≤ 1
(7)
Unfortunately, the answer is no. In the following we search for an upper bound on the quantity of load overflow in effective size based placement. Let ESi = N1i , and ESj = N1j . If ESi + ESj ≤ 1, aka, 1 1 Ni + Nj ≤ 1, then at least one of Ni and Nj is no less than
1 We replace C by 1 due to the original bin packing problem formulation. j The theorem holds for the case Cj 6= 1.
2; w.o.l.g., let Ni ≥ 2. Next, based on Equation(6), we have: q (8) Ni µi + Zα Ni σi2 = 1 q (9) Nj µj + Zα Nj σj2 = 1
Therefore, the α-percentile load of the normal variable by summing Xi and Xj is: q µi + µj + Zα σi2 + σj2 p p q 1 − Zα Ni σi2 1 − Zα Ni σi2 + + Zα σi2 + σj2 = Nx Nx (based on Equations (8) and (9)) s s q 2 1 1 σ σi2 i =( + ) + Zα ( σi2 + σj2 − ( + )) Ni Nj Ni Ni s s q σi2 σi2 2 2 ≤ 1 + Zα ( σi + σj − ( + )) Ni Ni √ √ √ (based on x + y ≤ x + y) q q 1 ≤ 1 + Zα ( σi2 + σj2 )(1 − √ ) Ni 1 1 ≤ 1 + ( √ + p ) ∗ 0.29 Ni Nj ≤ 1 + (0.71 + 1) ∗ 0.29 = 1.496 (based on Nj ≥ 2)
Therefore, the bin capacity overflow amount has up bound of 0.496.▽ Theorem 4.2 says that in a stochastic setting with normal variables, ES-IW VM placement algorithm has the O( 11 9 ) approximation performance if the bin capacity can be relaxed by a small constant factor rc which is no more than 0.496. V. E VALUATION A. Data Center Workload Traces The workload traces we used includes the resource utilization data of 5, 415 servers from the IT systems of ten large companies covering manufacturing, telecommunications, financial, and retail sectors. The trace records the average CPU utilization of each server in every 15 minutes from 00 : 00 on July 14th (Monday) to 23 : 45 on July 20th (Sunday) in 2008. Among them, 2, 525 of the servers have the hardware spec information including the processor speed (in MHZ) and processor/core number. Workload characterization on the traces is skipped due to space limit, and is included in the companion technical report [2] for interested readers. B. Simulation Methodology We implement a stand-alone simulator in Python. It runs on the workload trace described in Section V-A to evaluate the energy efficiency performance when consolidating the servers into a virtualized data center. In the simulations, we use the 2, 525 servers with known CPU spec information, and calculate the absolute CPU demand of those servers at a time point through multiplying the CPU utilization by the processor speed and the number of cores. The physical servers in the
simulations are homogeneous with the following hardware specs: • CPU: 3GHZ Quadra-core (the most common CPU model in the traces). • Memory: we use the metric memory constraint which specifies the maximal number of VMs allowable on a physical server. The simulations evaluate the values (8, 16, 32, ∞), where ∞ means no memory constraint. For each run of the simulations, we define a consolidation frequency X (in hours), and divide the data trace along the time into epochs with length X. During each epoch, we measure the consolidation performance with two metrics: • The number of active servers. An active server hosts at least one guest VM. • The number of performance violations. One violation is defined as a server overloading event on a physical server where the sum of CPU demand from the hosted VMs is larger than a threshold (100% in the evaluation) at a time point. A dependent metric is the overflow probability, which equals performance violations divided by active servers. We compare five server consolidation schemes: • Baseline scheme 1 (B1): B1 is a combination of VM sizing on average load and the First Fit Decreasing (FFD) placement scheme. This is an energy-biased scheme. • Baseline scheme 2 (B2): B2 is a combination of VM sizing on maximal load and the FFD placement scheme. This is an over-provisioning scheme. • Baseline scheme 3 (B3): B3 is a combination of VMware DPM’s VM sizing scheme [11] (on (µ + 2σ), where µ is the mean, σ is the standard deviation, of a VM’s load) and the FFD placement scheme. This is a representative scheme from industry products. • Baseline scheme 4 (B4): B4 is a consolidation scheme in [10], which is a combination of VM sizing on the 95-percentile load, the FFD placement scheme, and the correlation-aware affinity rules (aka, two VMs will not be hosted in the same physical when their load correlation coefficient is higher than a threshold t; we use t = 0.8 in this paper). This is a representative scheme from the state-of-art research solutions. • ES-CA: In ES-CA algorithm, we use p = 0.05 as the target overflow probability, the same as that used in B3 and B4. We will compare the above 4 baseline schemes with ES-CA as all those schemes do not consider migration cost which leads to the fair comparison on VM sizing technologies. The results of the ES-HCA algorithm are included in the companion technical report [2] for interested readers. C. Results 1) Offline Consolidation: In offline consolidation scenarios, the ES-CA scheme is invoked at the beginning of each epoch and use the trace data in that epoch to make the consolidation decision. For comparison, we also calculated a
6
4
2
0 0
10
Fig. 6.
20
30
40 50 60 VM average utilization load
70
80
90
100
Effective sizing example: on real data center workload
resource demand low bound: the sum of the CPU demand from all the 2525 servers at each time point (like consolidating them into a single warehouse-sized machine); for a server consolidation scenario with the frequency X hours, we divide the time into epochs with the length X hours, and use the maximal aggregate CPU demand among all the time points in an epoch as the low bound for this epoch. The bound is finally normalized by the base server CPU capacity (3.0GHZ*4). In practice, server consolidation has many other factors to consider such as memory and other resource constraints, VM affinity policies, and more; we focus on the CPU resource demand here due to the lack of other information in the trace, and note that the low bounds will still hold even with the additional consolidation constraints.
System performance (consolidation frequency = 12 hours) 400
50
active servers overflow probability
350
40
300 250
30
200 20
150 100
10
50 0
Active servers
300
B2
B3
B4
ES-CA
ES - CA VM Placement low bound
250
Fig. 7.
200
Figure 7 shows the online consolidation performance of the five schemes with consolidation frequency 12 hours, no memory constraint, and buffer factor b = 80%. The performance includes both the active servers per epoch in average and the standard deviation, and the server overflow probability per epoch in average. B1, which provisions the VMs on their average load, has the lowest active servers but very high performance violations. ES-CA uses 46% less active servers than B2 with max-load based VM sizing, 23% less than B3 with VMware DPM’s sizing approach, and 10% less than B4 with the 95-percentile sizing. ES also achieves its performance goal with below 5% overflow probability; it even has less performance violations than B4. Figure 8 shows the online consolidation performance of the five schemes with consolidation frequency 12 hours, memory constraint of maximally 16 VMs per server, and buffer factor b = 100%. ES uses 34% less active servers than S2, 16% less than S3, and 11% less than S4. ES still achieves its performance goal with below 5% overflow probability. More simulation results are included in the companion technical report [2] for interested readers.
150 100 50 0 0
Fig. 5.
0 B1
Offline consolidation performance with frquency = 12 hours
Avg Overflow Probability (in %)
(effective size-mean)/standard_deviation
8
server consolidation leads to 2% overflow (server overload) probability in average, with the standard deviation of 3%. Figure 6 shows a snapshot of the effective sizing results in one epoch during the above consolidation. The x axis is the VMs ranked by the average load; the y axis is the value of effectiveσ size−µ , which is the normalized overprovisioned resource on a VM atop its base average load. We see a clear trend of less overprovisioned resource for smaller VMs (in terms of average load), and more overprovisioned resource for larger VMs; the reason is explained in Section III-B. 2) Online Consolidation: In online consolidation scenarios, a scheme is invoked at the end of each epoch and use the trace data in that epoch to make a workload prediction and the consolidation decision for the next epoch. We use a simple approach for workload prediction: the workload in the next epoch assumes to be the same as that in the previous epoch, and the prediction error is compensated by lowering the server utilization target with a buffer factor b (e.g., b = 80% leads to lowering server utilization target to Ci ∗ 80%).
Average active servers
VM Effective Size 10
20
40
60
80 Time
100
120
140
160
Offline Consolidation of ES VM Placement: no memory constraint
Figure 5 shows the offline consolidation performance of ES-CA VM placement algorithm. along with the resource demand low bound. The consolidation frequency is 12 hours. Effective sizing based server consolidation solution performs close to the low bound; it uses in average 24% (with the standard deviation 11%) more physical servers than the low bound. Note ES-CA algorithm uses even less resource than the low bound in the last 12 hours; in this case ES-CA incurs performance violations, while the low bound has no physical server overloading. Overall, effective sizing based
Online Consolidation of ES VM Placement: no memory constraint
System performance (consolidation frequency = 12 hours) 400
active servers performance violations
ACKNOWLEDGMENT
60
350 50
40 250
200
30
150 20
Avg performance violations
Average active servers
300
100 10 50
0
0 S1
S2
S3
S4
COEM
Fig. 8. Online Consolidation of ES VM Placement: memory constraint = 16 VMs/server
VI. C ONCLUSIONS & F UTURE W ORK Virtualized data centers are proposed as a new IT infrastructure choice for large enterprises to consolidate old IT systems and improve energy efficiency. In this paper, we present effective sizing, a new VM sizing solution in server consolidation, and shows its performance through the analysis and evalution of the new VM placement algorithms based on effective sizing. Server consolidation is a multi-dimensional bin packing problem; in this paper we only discuss VM sizing on CPU demand and take memory as a constraint; in the future, we want to address other resources like disk I/O, memory bus and network bandwidth. Note effective sizing as a general technology can be applied to those statistically multiplexed resources as well in the provisioning process.
We thank Ashish Goel of Stanford University for helpful discussions on the effective sizing idea . We thank the anonymous reviewers for their valuable feedback. R EFERENCES [1] N. Bobroff, A. Kochut, and K. Beaty. Dynamic placement of virtual machines for managing sla violations. In Integrated Network Management, 2007. IM ’07. 10th IFIP/IEEE International Symposium on, 2007. [2] M. Chen, H. Zhang, Y.-Y. Su, X. Wang, G. Jiang, and K. Yoshihira. Coordinated energy management in virtualized data centers. Technical Report UT-PACS-2010-01, University of Tennessee, Knoxville, http://pacs.ece.utk.edu/EffectiveSize-tr.pdf, 2010. [3] R. Durrett. Probability: theory and examples. Duxbury Press, Belmont, CA, second edition, 1996. [4] A. Goel and P. Indyk. Stochastic load balancing and related problems. In Foundations of Computer Science, 1999. 40th Annual Symposium on, pages 579–586, 1999. [5] J. Y. Hui. Resource allocation for broadband networks. In Broadband switching: architectures, protocols, design, and analysis, pages 358–368, Los Alamitos, CA, USA, 1991. IEEE Computer Society Press. [6] J. Kleinberg, Y. Rabani, and E. Tardos. Allocating bandwidth for bursty connections. In STOC ’97: Proceedings of the twenty-ninth annual ACM symposium on Theory of computing, New York, NY, USA, 1997. ACM. [7] X. Meng, C. Isci, J. Kephart, L. Zhang, E. Bouillet, and D. Pendarakis. Efficient resource provisioning in compute clouds via vm multiplexing. In ICAC ’10: Proceeding of the 7th international conference on Autonomic computing, pages 11–20, New York, NY, USA, 2010. ACM. [8] NEC. Nec sigmasystemcenter: Integrated virtualization platform management software. http://www.nec.com/global/prod/sigmasystemcenter/. [9] A. Verma, P. Ahuja, and A. Neogi. pmapper: power and migration cost aware application placement in virtualized systems. In Middleware ’08: Proceedings of the 9th ACM/IFIP/USENIX International Conference on Middleware, New York, NY, USA, 2008. [10] A. Verma, G. Dasgupta, T. Nayak, P. De, and R. Kothari. Server workload analysis for power minimization using consolidation. In Proceedings of the 2009 USENIX Annual Technical Conference, 2009. [11] VMware. VMware Distributed Power Management Concepts and Use. http://www.vmware.com/files/pdf/DPM.pdf. [12] M. Yue. A simple proof of the inequality ffd(l) = (11/9)opt(l)+1, for all l, for the ffd bin-packing algorithm. Acta Mathematicae Applicatae Sinica, 7(4), October 1991.