Effect of Schizotypy on Cognitive Performance and Its Tuning by COMT val158 Met Genotype Variations in a Large Population of Young Men Nikolaos Smyrnis, Dimitrios Avramopoulos, Ioannis Evdokimidis, Costas N. Stefanis, Hara Tsekou, and Nicholas C. Stefanis Background: Mirroring schizophrenia, specific dimensions of schizotypy are related to cognitive dysfunction. The relation of schizotypy and state psychopathology to cognitive performance and its link to catechol-O-methyltransferase (COMT) val158 met genotype variations was studied in a large sample of young men. Methods: State psychopathology and schizotypy were assessed with self-rated questionnaires. Cognitive performance was assessed with tests of reasoning ability, sustained attention, and verbal and spatial working memory. Subjects were genotyped for the val158 met polymorphism of the gene for COMT (low enzymatic activity met/met, intermediate met/val, and high val/val). Results: The val/val group had higher scores in measures of state psychopathology as well as negative and disorganized schizotypy dimensions, whereas there was no effect of COMT genotype on cognitive performance measures. Structural equation modeling showed that cognitive performance accuracy but not speed decreased with increasing negative schizotypy, increased with increasing paranoid schizotypy, and was not affected by state psychopathology. Increasing val loading resulted in a dose-dependent increase in the factor loading for the relation between negative schizotypy and cognitive performance accuracy. Conclusions: Different schizotypal phenotypes had opposing relations to cognitive performance in the population. COMT genotype modulated the relation between the negative schizotypal phenotype and cognitive performance. Key Words: Catechol-O-methyltransferase, COMT, dopamine, executive function, prefrontal cortex, schizophrenia, schizotypy factors, sustained attention, working memory
T
he study of schizotypal personality traits in apparently healthy individuals has received great attention because of converging evidence from genetic and epidemiologic studies that such traits are clustering in individuals at elevated risk for schizophrenia and are prodromal to the subsequent full manifestation of the disorder (Maier et al. 1999). Schizotypy has a strong familial relationship with schizophrenia (Kendler et al. 1993) and may lie on an etiologic continuum of severity with the disorder (Claridge 1994; Eysenck and Eysenck 1976). It is therefore plausible to hypothesize that schizotypal traits in the general population may be related to impaired performance in domains, such as sustained attention, for which deficits have been observed in patients with schizophrenia. A frequently used neuropsychologic task measuring sustained attention is the Continuous Performance Test (CPT; Cornblatt and Keilp 1994). Patients with schizophrenia have been shown to perform more poorly on the CPT than do control subjects (Liu et al. 1997; Nuechterlein et al. 1986; Pandurangi et al. 1994). More specifically, the presence of negative symptoms has consistently been related to poorer performance in the CPT (Liu et al. 1997; Nuechterlein et al. 1986). Studies examining patients with DSM-III schizotypal personality disorder have found that these individuals manifest a specific
From the University Mental Health Research Institute (NS, DA, CNS, NCS) and the Psychiatry Department (NS, HT, NCS) and Cognition and Action Group (NS, IE, HT), Neurology Department, National and Kapodistrian University of Athens, Eginition Hospital, Athens, Greece. Address reprint requests to Nikolaos Smyrnis, Psychiatry Dept., National and Kapodistrian University of Athens, Medical School, Eginition Hospital, 72 Vas. Sofias Avenue, Athens, Greece 11528; E-mail:
[email protected]. Received November 16, 2005; revised May 2, 2006; accepted July 6, 2006.
0006-3223/07/$32.00 doi:10.1016/j.biopsych.2006.07.019
deficit on the CPT (Harvey et al. 1996). Participants with psychometrically defined high schizotypy have also been found to perform worse than control subjects (Lenzenweger et al. 1991; Obiols et al. 1993). Other studies examined the relationship between CPT performance and schizotypal personality characteristics in a community sample (Chen et al. 1997, 1998). It was observed that poorer CPT performance was associated with the negative and disorganization factor but not with the positive factor of schizotypy, a pattern that resembles the relationship between CPT performance and clinical symptom dimensions in patients with schizophrenia. Another impaired cognitive function in patients with schizophrenia is working memory (WM; Goldman-Rakic 1994). Patients with schizophrenia have been found to be impaired in a range of WM tasks that examine various WM domains, especially verbal and spatial (Carter et al. 1998). A limited number of studies have investigated WM function in relation to schizotypy. In one study, individuals scoring high on the Perceptual Aberration Scale (PAS; Chapman et al. 1978), which is associated with the positive factor of schizotypy, showed deficits in spatial WM (Park et al. 1995). A later study by the same group (Park and McTigue 1997) found an association between the negative symptom factor of the Schizotypal Personality Questionnaire (SPQ; Raine 1991) and performance in a spatial WM task. It has been proposed that a fundamental dysfunction in schizophrenia involves prefrontal dopaminergic hypoactivity, reflected in the presence of the negative symptom cluster and cognitive dysfunction (Weinberger et al. 1986). Favoring this hypothesis is the relation of the genotype for catechol-O-methyltransferase (COMT), a critical enzyme in the dopaminergic metabolic pathway, to schizophrenia (Li et al. 1996). High levels of COMT activity lead to a hypodopaminergic state, whereas the opposite is true for low COMT levels. A G-to-A transition at codon 158 of the COMT gene, resulting in a valine to methionine substitution, has been identified and has been found to be associBIOL PSYCHIATRY 2007;61:845– 853 © 2007 Society of Biological Psychiatry
846 BIOL PSYCHIATRY 2007;61:845– 853
N. Smyrnis et al.
ated with differential COMT activity (Lachman et al. 1996; Lotta et al. 1995). The val allele results in a thermolabile protein with a three- to fourfold increase in enzymatic activity (Mannisto et al. 1999; Scanlon et al. 1979) compared with the met allele. Increased COMT activity may result in reduced dopamine neurotransmission in the prefrontal cortex and thus contribute to the poorer performance of frontally mediated cognitive tasks and the occurrence of associated negative symptoms observed in patients with schizophrenia. Consistent with the hypothesis of genetically determined variation in prefrontal dopamine signaling, it was observed that the load of the low-activity met allele was related in allele dosage fashion to enhanced performance on the Wisconsin Card Sorting Test (WCST) of executive cognition (Egan et al. 2001), which was replicated in sample of 73 healthy volunteers (Malhotra et al. 2002) but not in a community sample of 120 young female subjects (Tsai et al. 2003). One report found an association between WCST performance and COMT genotype in patients but not in healthy control subjects (Joober et al. 2002), and another found an association in healthy siblings but not in patient siblings (Rosa et al. 2004). No effect of COMT genotype was seen on measures of attention using the CPT (Goldberg et al. 2003). In yet another study, however, it was reported that the met allele was associated with better performance in the processing speed and attention domain but not with other domain scores measuring executive and visuoperceptual functions, declarative verbal learning and memory, simple motor ability, or global neurocognitive function (Bilder et al. 2002). In two previous studies, we showed that the high-activity val allele was related to high scores on the SPQ and the PAS in a sample of healthy young men (Avramopoulos et al. 2002; Stefanis et al. 2004). We also investigated the relation of the COMT genotype to cognitive function in this sample using sustained attention and WM tasks and found no relation between the two (Stefanis et al. 2004). In this study, we used our population sample of apparently healthy young conscripts; the subjects performed cognitive tasks measuring general concept formation and reasoning ability, sustained attention, and verbal and spatial working memory and also completed questionnaires measuring schizotypy (SPQ) and current state psychopathology (Symptom Check List 90 revised [SCL90-R]; Derogatis 1993). We also completed our analysis of
genotyping the whole population for the COMT G-to-A transition polymorphism at codon 158 (Avramopoulos et al. 2002; Stefanis et al. 2004). In this report, we confirm the effect of COMT on negative and disorganized schizotypy and the absence of an effect on cognitive performance measures in a much larger sample. We also extend our findings to a relation of state psychopathology to COMT genotype. We then explore the relation between schizotypy and cognitive function in the population, based on the hypothesis that particular schizotypy factors (Stefanis et al. 2004) have a specific effect on cognitive function. We finally test a novel hypothesis, namely, that different COMT val158 met genotypes may affect the relation of schizotypy to cognitive function rather than having a direct effect on cognition.
Methods and Materials Participants The characteristics of the population used in this report have been previously described in detail (Smyrnis et al. 2003; Stefanis et al. 2004). Briefly, a sample of 2130 young male subjects aged 18 –24 were recruited from the Greek Air Force. The conscripts gave written informed consent before participating in the study. These individuals were prescreened by a team of medical doctors of all specialties (military personnel) for the presence of a serious medical condition including substance abuse, and individuals with such conditions were not admitted for military training. The study protocol was approved by the Bioethics and Medical Deontology Committee of the University Mental Health Research Institute. Psychometric Assessment We administered to 1657 subjects (80% of the total population) a battery of self-rated questionnaires, assessing, among other variables, 1) schizotypy, with the PAS and the SPQ; 2) current psychopathology, with the SCL90-R; and 3) personality characteristics, with the Temperament and Character Inventory (TCI-140-R; Cloninger et al. 1994). In this report, we used the scores on the nine scales of SCL90-R to assess current state psychopathology in our population and the nine scales of the SPQ to assess schizotypy (Table 1).
Table 1. Schizotypal Personality Questionnaire (SPQ) in the Three COMT Groups
SPQ Total Score Ideas of Reference Magical Thinking Unusual Perceptual Experience Suspiciousness Social Anxiety Lack of Close Friends Constricted Affect Odd Behavior Odd Speech Cognitive Perceptual Factor Negative Factor Disorganization Factor Paranoid Factor
met/met1
met/val2
val/val3
F (p)
26.2 (.91) 4.9 (.16) 2 (.11) 2.5 (.15) 3.5 (.15) 3 (.16) 2.1 (.13) 1.94 (.12) 2.5 (.16) 3.6 (.17) .45 (.011) .39 (.015) .20 (.009) .19 (.008)
25.9 (.55) 4.9 (.1) 1.8 (.07) 2.3 (.1) 3.5 (.09) 3 (.11) 2.1 (.08) 1.91 (.08) 2.6 (.1) 3.6 (.11) .45 (.009) .39 (.009) .20 (.006) .18 (.005)
28.3 (.76)2 5 (.12) 2.1 (.11)2 2.7 (.13) 3.8 (.13) 3.2 (.13) 2.4 (.12) 2.2 (.12)2 2.8 (.12) 4 (.15)1,2 .47 (.011) .43 (.012)1,2 .23 (.008)1,2 .20 (.007)2
3.58 (.03) .31 (.73) 3.22 (.04) 2.46 (.08) 1.73 (.17) .48 (.61) 2.26 (.1) 3.12 (.04) .71 (.49) 3.16 (.04) .8 (.44) 3.33 (.04) 3.92 (.02) 3.39 (.03)
Mean and standard error of the mean (in parentheses) SPQ, SPQ subscale, and SPQ factor scores for each catechol-O-methyltransferase (COMT) group. The last column presents the F for the one-way analysis of variance comparing the three groups. All F values that resulted in p ⬍ .05 are marked in bold. The significant post hoc differences for each mean are marked with superscript numbers corresponding to the group mean for which the post hoc test was significant at p ⬍ .05. For example, the val/val mean (3) for the SPQ score was significantly larger than the val/met (2) and met/met (1) means.
www.sobp.org/journal
N. Smyrnis et al. The four validity items of the TCI-R questionnaire were used to exclude participants who responded incorrectly to at least one of these items, thus ensuring the collaboration of the responders in these self-report scales. A four-factor model of schizotypy, derived from the nine scales of SPQ, has been described previously based on confirmatory factor analysis (Stefanis et al. 2004). The same four latent variables were used in the structural equation modeling to describe schizotypy factors: 1) cognitive–perceptual, 2) negative, 3) disorganized, and 4) paranoid. Exploratory factor analysis showed that a single factor explained 67% of the variance for the nine SCL90-R indices, and subsequent confirmatory factor analysis showed that models with more than one factor were not superior to the single-factor model. Thus, for the structural equation modeling, we used a single latent variable for all SCL90 scale scores. Assessment of Cognitive Functions All subjects performed the following cognitive tasks: 1. Raven’s Progressive Matrices (Raven 1982), which examines concept formation and reasoning ability. 2. The Continuous Performance Test—Identical Pairs version (CPT-IP), (Cornblatt et al. 1988, 1989), assessing sustained attention. In this task, four-digit numbers were flashed on the center of a computer monitor for 50 msec at a rate of one per sec. The subject was instructed to respond as fast as possible by releasing the right key of the mouse device whenever two identical stimuli were presented in succession. A test phase lasting 5 min was preceded by a 1-min familiarization phase, during which two-digit numbers were flashed. Each subject was given 150 trials during the test phase; 30 were target trials, 30 included the presentation of numbers that differed in one digit, and 90 included stimuli differing in more than one digit. Responses to the target trials were considered hits, responses to similar but not identical stimuli were recorded as false alarms, and responses to the other trials were recorded as random errors. 3. A verbal and a spatial version of the n-back task were used to assess verbal and spatial working memory (Gevins et al. 1996). In the verbal n-back task, a sequence of letters, selected among a set of 12 letters of the Greek alphabet, was presented for 500 msec, one every 3 sec, on a computer monitor. Subjects responded (by pressing the appropriate key on the computer keyboard) “yes” when the current letter matched the one that was presented two trials preceding it or “no” (by pressing another predefined key) in the no-match condition. In the spatial version of the n-back task, the subjects were told to remember not the letters themselves but their locations on the computer monitor. Each letter appeared randomly in 1 of 12 locations (the monitor being divided into 12 squares in a 4 ⫻ 3 matrix), again for 500 msec, at a rate of one per 3 sec, as in the verbal n-back task. Subjects were instructed to press the “yes” key whenever the currently presented letter appeared in the same location as the letter presented two trials before and to press the “no” key in any other case. Each subject performed five blocks of the verbal n-back task and five blocks of the spatial n-back task, plus one practice block per task. Each block comprised 22 letter presentations (thus 20 responses), and a total of 110 letters were presented in each task. We excluded subjects with less than 60 responses in each task from the analysis.
BIOL PSYCHIATRY 2007;61:845– 853 847 The measures of cognitive performance accuracy were the raw score in the Raven test and the d-prime (d=) in the CPT-IP, verbal n-back, and spatial n-back tasks. The d= is an index of the ability of the subject to discriminate a target stimulus from a nontarget stimulus. For the computation of d=, both the hit rate (proportion of correct responses to target trials) and false alarm rate (proportion of erroneous responses to nontargets) are taken into account. The measures of cognitive performance speed were the mean response latencies for hits for each subject on the CPT-IP, verbal n-back, and spatial n-back tasks. Subjects with a negative d= value in any of the three cognitive tasks or with a raw score below 10 on the Raven test were excluded from further analysis. Exploratory factor analysis showed that two factors explained 60% of the variance of all cognitive performance indices. The first factor loaded on accuracy indices and the second on speed indices. These two factors were used in the structural equation modeling that follows. DNA Extraction and COMT Typing A mouthwash for DNA extraction was obtained from all subjects. DNA was extracted from mouthwash samples in the population as described previously (Avramopoulos et al. 2002). All genotyping was performed blind to phenotype measures by K-Biosciences (Herts, United Kingdom; http://www.kbioscience. co.uk/) using a competitive allele-specific polymerase chain reaction system (CASP). Valid data from COMT genotyping were obtained from 1795 individuals. Selection of Population for Analysis From the sample of 1657 individuals who responded to the questionnaires, 1323 individuals (79.8%) had valid data in all cognitive assessment tasks (Raven, CPT, verbal n-back, spatial n-back) as defined previously. Of these individuals, 1118 (84.5%) had valid COMT genotype data; 908 (81.2%) of these individuals had valid psychometric data based on the exclusion criterion of the TCI and were the final sample used in this study. The three genotype frequencies in this population were as follows: 1) met/met, 21.03% (191/908); 2) met/val, 50.77% (461/908); and 3) val/val, 28.19% (256/908). These frequencies were not deviant from those expected for genotypes in Hardy–Weinberg Equilibrium. These three genotype groups were used in subsequent analyses. Analysis One-way analysis of variance (ANOVA) was used to test the effect of COMT genotype on each of the psychometric and cognitive performance indices. Fisher Least Square Difference post hoc tests were used to test for significant differences between genotype groups when the ANOVA showed a significant effect of COMT genotype group. Structural equation modeling was used to test specific hypotheses for the relation between psychometric and cognitive variables. Structural equation modeling allows the specification of “latent” variables that reflect a conceptual reduction of measured variables, called “manifest” variables. In this study, latent variables were the schizotypy factors, which reflect a reduction of the SPQ scores; a state psychopathology factor, which reflects a reduction of the SCL-90 scores; cognitive performance accuracy, which reflects a reduction of the Raven score, and the d= scores in CPT-IP, verbal n-back, and spatial n-back tests; and cognitive performance speed, which reflects a reduction of the mean latencies in the three cognitive tests. In the model, we consider psychometric variables as www.sobp.org/journal
848 BIOL PSYCHIATRY 2007;61:845– 853
N. Smyrnis et al.
Table 2. Symptom Checklist 90 —Revised (SCL90-R) in the Three COMT Groups SCL90-R
met/met1
met/val2
val/val3
F (p)
Anxiety Depression Phobic Anxiety Hostility Lack of Interpersonal Relations Obsessive–Compulsive Symptoms Paranoia Psychotisism Somatization Symptoms SCL90-R Factor Score
7.6 (.47) 13 (.57) 2.1 (.21) 5.2 (.37) 6.4 (.37) 10.4 (.47) 6.3 (.33) 5.3 (.38) 10.3 (.56) .08 (.07)
7.8 (.29) 13.2 (.39) 2 (.13) 4.8 (.22) 6.4 (.26) 10.9 (.34) 6.6 (.22) 6 (.27) 9.9 (.37) .06 (.05)
8.9 (.41)1,2 14.5 (.56) 2.7 (.21)1,2 5.6 (.21) 7.7 (.39)1,2 12.1 (.48)1,2 7.5 (.3)1,2 7.2 (.39)1,2 11.7 (.55)2 ⫺.17 (.07)1,2
3.15 (.04) 2.38 (.09) 4.75 (.009) 2.14 (.11) 4.57 (.01) 3.56 (.03) 3.96 (.02) 6.08 (.002) 4.10 (.02) 5.2 (.005)
Mean and standard error of the mean (in parentheses) SCL90-R scale scores and factor score (last row) for each catechol-O-methyltransferase (COMT) group. The last column presents the F for the one-way analysis of variance comparing the three groups. All F values that resulted in p ⬍ .05 are marked in bold. The significant post hoc differences for each mean are marked with superscript numbers corresponding to the group mean for which the post hoc test was significant at p ⬍ .05. For example, the val/val mean (3) for the anxiety score was significantly larger than the val/met (2) and met/met (1) means.
exogenous, meaning they are the independent factors that in turn affect the endogenous cognitive performance variables. The STATISTICA 6.0 (StatSoft) software was used for this analysis. The module for model estimation uses an iterative process that minimizes a Maximum Wishart Likelihood (ML) discrepancy function. Two criteria for convergence of the iteration process were used: the maximum residual cosine criterion and the relative function change criterion. We used the default values for these criteria that are preselected in the structural equation modeling module of STATISTICA 6.0. To assess the goodness of fit of the resulting models, we used the following measures: Goodness of Fit Index (GFI), Adjusted Goodness of Fit Index (AGFI), Normed Fit Index (NFI), and Root Mean Square Error of Approximation (RMSEA). The GFI, AGFI, and NFI goodness of fit measures indicate good models for values higher than .90; RMSEA values of .05 or less have been proposed as indicative of reasonable fit between model and data. To compare models, we used the following theoretic information measures: the Akaike information criterion (AIC), the Bayes Information Criterion (BIC), and the Browne-Cudeck Criterion (BCC). Lower values of these theoretic measures indicate better models. The rationale for using these goodness of fit and theoretical information measures is described in detail in our previous work (Stefanis et al. 2004).
Results A preliminary analysis of correlations between the psychometric and cognitive variables showed that Pearson correlation coefficients were below .1 for all individual pairs of variables.
Table 1 presents the effect of COMT val158 met genotype group (val/val val/met, or met/met) on the total SPQ score, and the four factors that were used to reduce the SPQ data scores. Although there is a significant effect for the SPQ total score, the post hoc comparisons showed that there was a significant difference between the val/val and val/met groups but not between the val/val and met/met groups. The same was true for the significant effect of COMT on constricted affect and magical thinking subscale scores of SPQ, whereas the effect on odd speech was significant for both comparisons (val/val vs. val/met and val/val vs. met/met). Finally, regarding the four factors of SPQ, there was a clear effect of val/val genotype on the negative and disorganization symptom factors, whereas only the val/val and val/met groups affected the paranoid factor significantly. Table 2 presents the effect of COMT genotype group on SCL90-R subscale scores and the SCL90-R single-factor score. As can be seen, the val/val group had significantly higher scores than the met/met and met/val groups in the following indices: anxiety, phobic anxiety, lack of interpersonal relations, obsessive– compulsive symptoms, paranoia, and psychotisism. Finally, the factor score for the val/val group was significantly different from that of the other two groups, confirming a general effect of val/val genotype on state psychopathology. Table 3 shows that in contrast to the effects of COMT on psychometric indices, there was no effect of COMT genotype on the cognitive indices of performance in this population. Further-
Table 3. Cognitive Indices in the Three COMT groups
Raven Score CPT d= VNB d= SNB d= CPT Mean Latency (msec) VNB Mean Latency (msec) SNB Mean Latency (msec) Cognitive Accuracy Factor Cognitive Speed Factor
met/met
met/val
val/val
F (p)
47.5 (.5) 1.94 (.06) 2.66 (.06) 2.85 (.07) 496.8 (3.8) 948.7 (14.4) 873 (13.4) ⫺.04 (.07) ⫺.012 (.07)
48.3 (.3) 1.96 (.04) 2.72 (.04) 2.89 (.05) 496.1 (2.5) 945 (9.5) 874.3 (9.1) .04 (.05) .014 (.05)
47.8 (.41) 1.92 (.05) 2.67 (.06) 2.81 (.06) 497.5 (3.6) 939.6 (13.2) 876.4 (12.2) ⫺.04 (.06) ⫺.016 (.06)
.98 (.37) .21 (.81) .54 (.58) .41 (.66) .05 (.95) .11 (.89) .01 (.98) .7 (.51) .01 (.91)
Mean and standard error of the mean (in parentheses) cognitive index scores for each catechol-O-methyltransferase (COMT) group. The last column presents the F for the one-way analysis of variance comparing the three groups. None of the F values resulted in p ⬍ .05.
www.sobp.org/journal
BIOL PSYCHIATRY 2007;61:845– 853 849
N. Smyrnis et al.
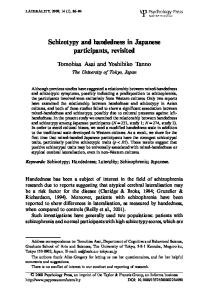
Figure 1. Path diagram of the general structural equation model describing the relations of schizotypy and state psychopathology to cognitive performance accuracy and speed. The nine subscales of SPQ are as follows: ideas of reference, magical thinking, unusual perceptual experiences, suspiciousness, social anxiety, no close friends, constricted affect, odd behavior, and odd speech. The schizotypy latent variables are cognitive perceptual, paranoid, negative, and disorganization. The nine subscales of SCL90-R are anxiety, depression, phobic anxiety, hostility, lack of interpersonal communication, obsessive– compulsive disorder symptoms, paranoia, psychotisism, and somatization symptoms, and they all load on the “state psychopathology” latent variable. The Raven raw score, the CPT-IP d= and the d= for the verbal and spatial n-back tests were used to derive the performance accuracy latent variable, whereas the CPT-IP and the two n-back tests mean latencies for correct responses were used to derive the cognitive performance speed latent variable. The model also included residual variables for all exogenous manifest variables (depicted as delta 1–18), residual variables for all endogenous manifest variables (depicted as epsilon 1–7), and disturbances for all endogenous latent variables (depicted as zeta 1–2). Lines indicate two-way correlations, and arrows indicate one-way relations. Solid lines and arrows indicate significant factor estimates, and dotted lines and arrows indicate nonsignificant factor estimates at the level of p ⫽ .05. The factor loading estimates are depicted for selected relations with a number on the line.
more, there was no effect of genotype on the factor scores for cognitive performance accuracy and performance speed. Schizotypy and Cognition The hypothesis tested was whether specific dimensions of schizotypy or state psychopathology were related to cognitive performance accuracy or speed in the total population. In the model shown in the path diagram of Figure 1, SPQ scores (exogenous manifest variables) loaded on four latent exogenous variables that were the previously described four dimensions of SPQ. All SCL-90 scores loaded on one latent exogenous variable, state psychopathology. These exogenous latent variables then predicted two endogenous latent variables, the cognitive perfor-
mance accuracy and the cognitive performance speed. Cognitive performance accuracy loaded on four endogenous manifest variables, namely, the Raven score and the three d= scores of the three cognitive tasks, whereas cognitive performance speed loaded on three endogenous manifest variables, namely, the mean latencies of correct responses in the three cognitive tasks. The model estimation process converged normally. Table 4 shows the theoretical information and goodness of fit measures for this model. The GFI, AGFI, and NFI indices were all above .9, and the RMSEA index was .05, indicating that the model was a good fit to the data. As shown in Figure 1, state psychopathology was significantly correlated with all schizotypy factors, and, in turn, all schizotypy factors were significantly intercorrelated, as
Table 4. Measures of Model Fit Information Theoretic Model General Model Specific Model Specific Model for met/met Specific Model for met/val Specific Model for val/val
Goodness of Fit
AIC
BCC
BIC
GFI
AGFI
NFI
RMSEA
1.166 .109 .381 .166 .323
1.171 .109 .394 .168 .336
1.548 .231 .774 .373 .649
.923 .987 .970 .986 .967
.901 .974 .939 .970 .932
.918 .973 .933 .969 .943
.055 .039 .032 .029 .056
www.sobp.org/journal
850 BIOL PSYCHIATRY 2007;61:845– 853 expected. State psychopathology was not a significant predictor of either cognitive performance accuracy or speed. The cognitive–perceptual and disorganized factors of schizotypy were also not significant predictors of either performance accuracy or speed. In contrast, the negative and paranoid factors of schizotypy were both significant predictors of performance accuracy. More specifically, performance accuracy increased with increasing scores in the paranoid factor of schizotypy (factor loading ⫽ .69, t ⫽ 2.2, p ⬍ .05), and decreased with increasing scores in the negative factor of schizotypy (factor loading ⫽ ⫺.48, t ⫽ ⫺2, p ⬍ .05). We next used a more restricted model, where negative and paranoid schizotypy affect cognitive performance accuracy. The iteration process for this model converged normally. This model was much better than the previous general model, both in terms of goodness of fit measures and in terms of information theoretic measures (Table 4). The relations of negative and paranoid schizotypy to cognitive performance were significant as expected (negative schizotypy factor loading ⫽ ⫺.61, t ⫽ ⫺3.9, p ⬍ .001; paranoid schizotypy factor loading ⫽ .341, t ⫽ 2.5, p ⬍ .05). The Effect of COMT We next addressed the effect of COMT genotype on the relation of schizotypy and cognition. We ran the specific model showing the relation of paranoid and negative schizotypy to cognitive performance accuracy, separately for each one of the three COMT groups, as shown in Figure 2. For the met/met group, the model fit was good (Table 4). In this model, both
N. Smyrnis et al. negative schizotypy (factor loading ⫽ .054, t ⫽ .2, p ⬎ .8) and paranoid schizotypy (factor loading ⫽ .41, t ⫽ 1.5, p ⬎ .1) were not significantly related to cognitive performance. The model fit for the met/val group was also good (Table 4). In this model, the relation of negative schizotypy to cognitive performance was significant (factor loading ⫽ ⫺.62, t ⫽ ⫺2.8, p ⬍ .01), whereas the relation of paranoid schizotypy to cognitive performance was not significant (factor loading ⫽ .26, t ⫽ 1.3, p ⬎ .1). Finally, in the val/val group, the model again provided a good fit (Table 4), and again the relation of negative schizotypy to cognition was significant (factor loading ⫽ ⫺.98, t ⫽ ⫺2.9, p ⬍.01), whereas that of paranoid schizotypy was not (factor loading ⫽ .31, t ⫽ .98, p ⬎ .3). Figure 3 presents the absolute value of the factor loading, regarding the relation of negative schizotypy to cognitive performance for the total sample and for the three COMT groups. A clear dose–response effect is evident: as the val loading increases from 0 to 2, the factor loading increases from 0 to 1. To test further whether the relation between negative schizotypy and cognitive performance accuracy changes significantly among the three genotype groups, we used the homogeneity of slopes model of the general linear model analysis. This analysis tests directly whether a categorical factor (genotype) significantly alters the regression slope between a set of dependent (cognitive performance accuracy) and independent (negative schizotypy) variables, a factor that is equal to the correlation coefficient in the case of one dependent and one independent variable. A significant effect on the slope of the regression of negative schizotypy on cognitive perfor-
Figure 2. Path diagrams for the specific structural equation model of the paranoid and negative schizotypy factors affecting performance accuracy for the three groups of catechol-O-methyltransferase (COMT)-genotyped individuals, met/met, met/val, and val/val. All conventions are the same as for the model depicted in Figure 1.
www.sobp.org/journal
N. Smyrnis et al.
BIOL PSYCHIATRY 2007;61:845– 853 851 that affects cognitive performance, irrespective of current state symptomatology (Harvey et al. 1996).
Figure 3. The effect of catechol-O-methyltransferase (COMT) genotype (met/met, met/val, val/val, and total sample of all individuals) on the absolute value of the factor loading of the relation of negative schizotypy and cognitive performance accuracy. The factor loading was derived from structural equation modeling for the three COMT groups as presented in Figure 2. Error bars represent the standard error for each factor loading.
mance accuracy was shown as a significant interaction of genotype ⫻ negative schizotypy [F(2, 901) ⫽ 3.54, p ⬍.03).
Discussion Schizotypy and Cognition A salient finding of this study was that two schizotypy factors were related to cognitive performance accuracy, whereas no relation with cognitive performance speed was observed. We chose structural equation modeling analysis to test the relation of psychometric and cognitive tasks to avoid multiple comparisons and also in face of the fact that both psychometric and cognitive indices of performance were highly intercorrelated. Structural equation modeling effectively takes account of complex interrelations among manifest variables and also identifies significant correlations among latent variables of interest. It should be noted here that among the many indices of performance in the cognitive tasks, we selected only the performance accuracy and speed to get a meaningful reduction of data. We have excluded other indices such as the variance in response latency in these tasks, an index that we have examined in a previous study in relation to COMT genotype (Stefanis et al. 2005) and restricted this analysis to the most acceptable indices for measuring accuracy and speed in these cognitive tasks. We plan, however, to incorporate such novel measures of performance in our future work. Regarding the specific tasks used in this study to measure cognitive performance, it has been found that people with schizotypy perform worse on the CPT, and these deficits are significantly related to the negative SPQ factor (Chen et al. 1997; Lenzenweger et al. 1991; Obiols et al. 1993). This pattern of findings is similar to those found in patients with schizophrenia, because impaired CPT performance is consistently associated with the presence of negative symptoms (Liu et al. 1997; Nuechterlein et al. 1986). An interesting finding is the increase in cognitive performance accuracy with increasing paranoid schizotypy. In a previous study that measured performance at the Wisconsin Card Sorting Test (WSCT), the authors also found that individuals with a predominantly paranoid schizotypy performed better than controls (Suhr and Spintzagel 2001). We did not observe a relation between performance accuracy or speed and current state psychopathology. This observation offers strong support to the notion that schizotypy is a trait factor
The Effect of COMT Genotype Current theoretical approaches postulate that the major functional deficit in schizophrenia is the hypodopaminergic function of the prefrontal cortex, resulting in what the so-called negative symptom cluster of the disease (Weinberger et al. 1988). Increased COMT activity may result in reduced dopamine neurotransmission in the prefrontal cortex and thus contribute to the executive dysfunction and the occurrence of negative symptoms observed in patients with schizophrenia. The literature has not been consistent regarding this hypothesis, however; some studies support a relation of COMT genotype variations to cognitive dysfunction in measures of memory and attention, but others do not (Bilder et al. 2002; Egan et al. 2001; Goldberg et al. 2003; Joober et al. 2002; Malhotra et al. 2002; Rosa et al. 2004; Tsai et al. 2003). In a previous study, we showed that COMT val158 met genotype variations did not have an effect on cognitive performance measures of accuracy and speed in tasks that involve executive control (Stefanis et al. 2004). In this study, we confirm the absence of a relation between COMT genotype variations and cognitive performance indices in a much larger sample. Recent studies have shown that other sites within the COMT gene may also affect its functionality, suggesting that a subdivision of the population of val158 and met158 population based on haplotypes comprising linked single nucleotide polymorphisms in other domains of the gene may exert differential effects on the phenotype (Tunbridge et al. 2006). It would thus be interesting to further analyze our sample using these haplotypes and test for differences in cognitive performance. On the other hand, we found a relation of COMT genotype to schizotypy and current state psychopathology. The higher schizotypal scores of val/val homozygotes that we observed confirmed our previous results (Avramopoulos et al. 2002; Stefanis et al. 2004). We also confirmed the significantly higher scores of val/val homozygotes in the negative and disorganized factors of schizotypy (Stefanis et al. 2004). It is important to note here that we repeatedly find an effect of COMT val158 met genotype on self-reported measures of schizotypy in healthy individuals. It could be expected that this effect would be more evident for individuals with clinically identified schizotypal personality disorder (Kendler et al. 1996), especially in view of the hypothesis that high schizotypy might be considered a qualitatively different phenotype that is dissociated from normal population (Lenzenweger and Korfine 1992). The significantly higher scores in current psychopathology of val/val homozygotes is an interesting new finding in this sample. Our results indicate that this effect was present for many scale scores of SCL90-R, but conclusions about specific effects of COMT on psychopathology should not be drawn from these results because SCL90-R scale scores are highly intercorrelated. Awaiting further analysis, we currently provided evidence that higher levels of current psychopathology are detected in individuals with a high val loading. Structural equation modeling confirmed an effect of schizotypal phenotype on cognitive performance. We then examined the modulation of this effect by the COMT val158 met genotype variations. Thus, in the met/met group in which the val loading was 0, the relation of negative schizotypy to cognitive performance is not significant, and the factor loading of this relation is 0. Increasing the val loading to 1 and then 2 resulted in a significant effect of negative schizotypy to cognition, and there www.sobp.org/journal
852 BIOL PSYCHIATRY 2007;61:845– 853 was a dose response increase in the factor loading of this relation from 0 to 1. It may be that among individuals with predominantly negative schizotypal personality characteristics, those that also exhibit a high val loading will be much more prone to develop cognitive dysfunction in tasks of working memory and attention. This modulating effect of COMT might explain the discrepancy in reported results on the effect of COMT on cognition. Thus, cognition per se might be much less sensitive to reduced dopamine levels in the healthy adults. This effect might become much more exaggerated in the context of high negative schizotypy, however. Therefore, the degree of schizotypy might be the crucial factor that would account for discrepancies in the observed relation between COMT genotype variations and cognition. Methodological Limitations Motivation in recruits may have been low, resulting in poor discrimination on cognitive test results. Although we cannot exclude this possibility, recruits were generally motivated, because participation in the research exercise provided an opportunity to skip army routines. In addition, individuals with unreliable answers on the four validity items of the Temperament and Character Inventory (Cloninger et al. 1994), arguably a valid indicator of poor motivation, were excluded from the sample. On the other hand, the exclusion of a nontrivial percentage of random responders based on the TCI validity items raises the question of whether we were biasing our sample toward excluding the most deviant group because the random responders had higher scores in schizotypy and poorer performance in the cognitive tasks. We believe that this is not the case for the following reasons: first, the two groups did not differ in SCL90 measures of psychopathology except a higher avoidance and escape pattern. Second, the correlation of schizotypy scores with cognitive performance in the nonresponder group was near zero for all indices of performance. These observations led us to the conclusion that the random responders’ participation and worse performance in the study were mainly due to secondary gains related to avoidance of military drills during the day of examination and subsequent indifference during testing procedures, not due to genuine psychometrically deviant performance (Stefanis et al. 2005). Positive association results are often due to population admixture and stratification. Our population is one of Greek nationals of a particular age span. The vast majority of male Greek nationals serve in the Greek armed forces, however, and there are no set criteria for assignment in the air force. The sample, therefore, is representative for the Greek population of this age stratum. As with most European populations, a certain extent of admixture is possible, but it is unlikely that it is large enough to account for the reported results. Finally, in view of the sexually dimorphic effects of COMT knockout mice and reports of gender-specific associations between COMT polymorphisms and schizophrenia (Shifman et al. 2002), it may be possible that the findings reported here are specific to men and cannot be generalized to women. This work was supported by the Grant EKBAN 97 to CNS from the General Secretariat of Research and Technology of the Greek Ministry of Development. Intrasoft provided the technical support for this project. The authors thank Dr. Ioannis Ntzioufras for statistical advice. Avramopoulos D, Stefanis NC, Hantoumi I, Smyrnis N, Evdokimidis I, Stefanis CN (2002): Higher scores of self-reported schizotypy in healthy young males carrying the COMT high activity allele. Mol Psychiatry 7:706 –711.
www.sobp.org/journal
N. Smyrnis et al. Bilder RM, Volavka J, Czobor P, Malhotra AK, Kennedy JL, et al. (2002): Neurocognitive correlates of the COMT Val(158)Met polymorphism in chronic schizophrenia. Biol Psychiatry 52:701–707. Carter CS, Perlstein W, Ganguli R, Brar J, Mintun M, Cohen JD (1998): Functional hypofrontality and working memory dysfunction in schizophrenia. Am J Psychiatry 155:1285–1297. Chapman LJ, Chapman, JP, Raulin ML (1978): Body-image aberration in schizophrenia. J Abnorm Psychol 8:399 – 407. Chen WJ, Hsiao CK, Hsiao LL, Hwu HG (1998): Performance of the continuous performance test among community samples. Schizophr Bull 24:163– 174. Chen WJ, Hsiao CK, Lin CCH (1997): Schizotypy in community samples: The three factor structure and correlation with sustained attention. J Abnorm Psychol 106:649 – 654. Claridge GS (1994): Single indicator of risk for schizophrenia: Probable fact or likely myth? Schizophr Bull 20:151–168. Cloninger CR, Przybeck T, Svrakic D, Wetzel R (1994): The Temperament and Character Inventory (TCI): A guide to its development and use. St. Louis, MO: Center for Psychobiology and Personality. Cornblatt BA, Keilp JG (1994): Impaired attention, genetics, and the pathophysiology of schizophrenia. Schizophr Bull 20:31– 46. Cornblatt BA, Lenzenweger MF, Erlenmeyer-Kimling L (1989): The Continuous Performance Test, Identical Pairs Version: II. Contrasting attentional profiles in schizophrenic and depressed patients. Psychiatry Res 29:65– 85. Cornblatt BA, Risch NJ, Faris G, Friedman D, Erlenmeyer-Kimling L (1988): The Continuous Performance Test, Identical Pairs Version: I. New findings about sustained attention in normal families. Psychiatry Res 26:223–238. Derogatis R (1993): Symptom Checklist-90-R (SCL-90-R). Minneapolis, MN: Computer Systems. Egan MF, Goldberg TE, Kolachana BS, Callicott JH, Mazzanti CM, Straub RE, et al. (2001): Effect of COMT Val 108/158 Met genotype on frontal lobe function and risk for schizophrenia. Proc Natl Acad Sci U S A 98:6917– 6922. Eysenck HJ, Eysenck SBG (1976): Psychotisism as a dimension of personality. London: Hodder and Stoughton. Gevins A, Smith ME, Le J, Leong H, Bennett J, Martin N, McEvoy L, et al. (1996): High resolution evoked potential imaging of the cortical dynamics of human working memory. Electroencephalogr Clin Neurophysiol 98:327– 348. Goldberg TE, Egan MF, Gscheidk T, Coppola R, Weikert T, Kolachana BS, et al. (2003): Executive subprocesses in working memory: Relationship of catechol-o-methyltransferase Vall58Met genotype and schizophrenia. Arch Gen Psychiatry 60:889 – 896. Goldman Rakic PS (1994): Working memory dysfunction in schizophrenia. J Neuropsychiatry Clin Neurosci 6:348 –357. Harvey PD, Keefe RSE, Mitroupolou V, Dupre R, Roitman SL, Mohs RC, Siever LJ (1996): Information-processing markers of vulnerability to schizophrenia: Performance of patients with schizotypal and nonschizotypal personality disorders. Psychiatry Res 60:49 –56. Joober R, Rouleau GA, Lal S, Dixon M, O’Driscoll G, Palmour R, et al. (2002): Neuropsychological impairments in neuroleptic-responder vs. -nonresponder schizophrenic patients and healthy volunteers. Schizophr Res 53:229 –238. Kendler KS, McGuire M, Gruenberg AM, O’Hare A, Spellman M, Walsh D (1993): The Roscommon Family Study. III. Schizophrenia-related personality disorders in relatives. Arch Gen Psychiatry 50:781–788. Kendler KS, Thacker L, Walsh D (1996): Self-report measures of schizotypy as indices of familial vulnerability to schizophrenia. Schizophr Bull 22:511– 520. Lachman HM, Papolos DF, Saito T, Yu YM, Szumlanski CL, Weinshilboum RM (1996): Human catechol-O-methyltransferase pharmacogenetics: Description of a functional polymorphism and its potential application to neuropsychiatric disorders. Pharmacogenetics 6:243–250. Lenzenweger MF, Cornblatt BA, Putnick M (1991): Schizotypy and sustained attention. J Abnorm Psychol 100:84 – 89. Lenzenweger MF, Korfine L (1992): Confirming the latent structure and base rate of schizotypy: A taxometric analysis. J Abnorm Psychol 101:567–571. Li T, Sham PC, Vallada H, Xie T, Tang X, Murray RM, et al. (1996): Preferential transmission of the high activity allele of COMT in schizophrenia. Psychiatr Genet 6:131–133.
N. Smyrnis et al. Liu SK, Hwu HG, Chen WJ (1997): Clinical symptom dimensions and deficits on the Continuous Performance Test in schizophrenia. Schizophr Res 25:211–219. Lotta T, Vidgren J, Tilgmann C, Ulmanen I, Melen K, Julkunen I, et al. (1995): Kinetics of human soluble and membrane-bound catechol O-methyltransferase: A revised mechanism and description of the thermolabile variant of the enzyme. Biochemistry 34:4202– 4210. Maier W, Falkai P, Wagner M (1999): Schizophrenia spectrum disorders: A review. In: Maj M, Sartorious N, editors. Schizophrenia. Vol. 2 of WPA Series Evidence and Experience in Psychiatry. Chichester, UK: Wiley, 311–371. Malhotra AK, Kestler LJ, Mazzanti C, Bates JA, Goldberg T, Goldman D (2002): A functional polymorphism in the COMT gene and performance on a test of prefrontal cognition. Am J Psychiatry 59:652– 654. Mannisto PT, Kaakkola S (1999): Catechol-O-methyltransferase (COMT): Biochemistry, molecular biology, pharmacology, and clinical efficacy of the new selective COMT inhibitors. Pharmacol Rev 51:593– 628. Nuechterlein KH, Edell E, Norris M, Dawson ME (1986): Attentional vulnerability indicators, thought disorder, and negative symptoms. Schizophr Bull 12:408 – 426. Obiols JE, Garcia-Domingo M, de Trincheria I, Domenech E (1993): Psychometric schizotypy and sustained attention in young males. Person Indiv Diff 14:381–384. Pandurangi AK, Sax KW, Pelonero AL, Goldberg SC (1994): Sustained attention and positive formal disorder in schizophrenia. Schizophr Res 13: 109 –116. Park S, Holzman PS, Goldman-Rakic PS (1995): Spatial working memory deficits in the relatives of schizophrenic patients. Arch Gen Psychiatry 52:821– 828. Park S, McTigue K (1997): Working memory and the syndromes of schizotypal personality. Schizophr Res 26:213–220. Raine A (1991): The SPQ: A scale for the assessment of schizotypal personality based on DSM-III-R criteria. Schizophr Bull 17:555–564. Raven JC (1982): Revised Manual for Raven’s Progressive Matrices and Vocabulary Scales. Windsor: NFER-Nelson.
BIOL PSYCHIATRY 2007;61:845– 853 853 Rosa A, Peralta V, Cuesta MJ, Zarzuela A, Serrano F, Martinez-Larrea A, et al. (2004): New evidence of association between COMT gene and prefrontal neurocognitive function in healthy individuals from sibling pairs discordant for psychosis. Am J Psychiatry 161:1110 –1112. Scanlon PD, Raymond FA, Weinshilboum RM (1979): Catechol-O-methyltransferase: Thermolabile enzyme in erythrocytes of subjects homozygous for allele for low activity. Science 203:63– 65. Shifman S, Bronstein M, Sternfeld M, Pisante-Shalom A, Lev-Lehman E, Weizman A, et al. (2002): A highly significant association between a COMT haplotype and schizophrenia. Am J Hum Genet 71:1296 –1302. Smyrnis N, Evdokimidis I, Stefanis NC, Avramopoulos D, Constantinidis TS, Stavropoulos A, Stefanis CN (2003): Antisaccade Performance of 1,273 men: Effects of schizotypy, anxiety, and depression. J Abnorm Psychol 112:403– 414. Stefanis NC, Smynis N, Avramopoulos D, Evdokimidis I, Ntzoufras I, Stefanis CN (2004): Factorial composition of self-rated schizotypal traits among young males undergoing military training. Schizophr Bull 30:335–350. Stefanis NC, Van Os J, Avramopoulos D, Smyrnis N, Evdokimidis I, Hantoumi I, Stefanis CN (2004): Variation in catechol-o-methyltransferase val158 met genotype associated with schizotypy but not cognition: A population study in 543 young men. Biol Psychiatry 56:510 –515. Stefanis NC, van Os J, Avramopoulos D, Smyrnis N, Evdokimidis I, Stefanis CN (2005): Effect of COMT Val158Met polymorphism on the continuous performance test, identical pairs version: Tuning rather than improving performance. Am J Psychiatry 162:1752–1754. Suhr JA, Spintzagel MB (2001): Factor versus cluster models of schizotypal traits. II: Relation to neuropsychological impairment. Schizophr Res 52:3241–250. Tsai SJ, Yu YW, Chen TJ, Chen JY, Liou YJ, Chen MC, Hong CJ (2003): Association study of a functional catechol-O-methyltransferase-gene polymorphism and cognitive function in healthy females. Neurosci Lett 338:123–126. Tunbridge EM, Harrison PJ, Weinberger DR (2006): Catechol-o-methyltransferase, cognition, and psychosis: val158met and beyond. Biol Psychiatry 15:141–145. Weinberger DR, Berman KF, Zec RF (1986): Physiologic dysfunction of dorsolateral prefrontal cortex in schizophrenia I. Regional cerebral blood flow evidence. Arch Gen Psychiatry 43:114 –124.
www.sobp.org/journal