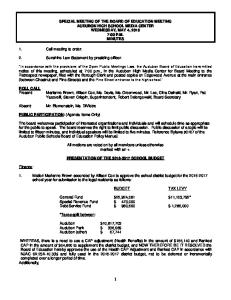
Comparison of Total M&O Revenue for School Districts and Charter Schools - LBB Model 887 FISCAL YEAR 2013 Note: All figures below are estimates and are subject to change based on actual and final student counts, property values, and tax effort. Amounts reflect available statewide estimates and may differ from local projections. M&O revenue amounts below are based on district entitlement for a full year, and do not reflect a payment deferral or any other actual or potential change to the distribution schedule of that entitlement.
Fiscal Year 2013 District Name
A+ ACADEMY ABBOTT ISD ABERNATHY ISD ABILENE ISD ACADEMY ISD ACADEMY OF ACCELERATED LEARNIN ACADEMY OF CAREERS AND TECHNOL ACADEMY OF DALLAS ACCELERATED INTERMEDIATE ACADE ADRIAN ISD ADVANTAGE ACADEMY AGUA DULCE ISD ALAMO HEIGHTS ISD ALBA-GOLDEN ISD ALBANY ISD ALDINE ISD ALEDO ISD ALICE ISD ALIEF ISD ALIEF MONTESSORI COMMUNITY SCH ALLEN ISD ALPHA CHARTER SCHOOL ALPINE ISD ALTO ISD ALVARADO ISD ALVIN ISD ALVORD ISD AMARILLO ISD AMBASSADORS PREPARATORY ACADEM AMERICAN YOUTHWORKS CHARTER SC Legislative Budget Board - Model 887
County District Number
County Name
057829 109901 095901 221901 014901 101810 015816 057810 101849 180903 057806 178901 015901 250906 209901 101902 184907 125901 101903 101815 043901 057832 022901 037901 126901 020901 249901 188901 084804 227801
DALLAS HILL HALE TAYLOR BELL HARRIS BEXAR DALLAS HARRIS OLDHAM DALLAS NUECES BEXAR WOOD SHACKELFORD HARRIS PARKER JIM WELLS HARRIS HARRIS COLLIN DALLAS BREWSTER CHEROKEE JOHNSON BRAZORIA WISE POTTER GALVESTON TRAVIS
HB3646 WADA
1,791 450 1,168 20,692 1,524 560 310 693 364 281 2,973 533 5,198 1,230 893 82,083 5,527 6,106 57,701 387 22,248 251 1,737 1,029 4,317 22,112 1,051 38,817 256 230
Current Law (SB 1 821CS) - FY13
Total M&O Revenue
$9,425,152 $2,421,856 $7,070,916 $106,444,484 $7,824,705 $2,941,292 $1,659,557 $3,622,813 $1,895,778 $1,502,303 $15,493,805 $2,964,241 $31,613,955 $6,445,127 $4,700,160 $446,359,855 $33,730,202 $31,989,979 $323,842,837 $1,979,561 $117,350,762 $1,326,804 $9,366,964 $5,306,350 $22,265,393 $115,852,899 $5,903,638 $208,584,987 $1,309,549 $1,264,540
Fiscal Year: 2013
HB 3646 - FY13
FY13
Total M&O Revenue
Change in Total M&O Revenue
$10,294,687 $2,459,217 $7,701,835 $107,959,090 $8,046,617 $3,214,285 $1,793,247 $3,961,168 $2,070,071 $1,523,864 $16,935,544 $3,010,450 $34,626,470 $6,535,892 $5,107,525 $454,421,279 $36,820,372 $32,922,822 $328,570,450 $2,148,717 $128,711,831 $1,448,141 $10,197,520 $5,480,588 $24,009,190 $121,467,028 $6,415,026 $211,649,495 $1,420,486 $1,379,154
($869,535) ($37,360) ($630,919) ($1,514,606) ($221,912) ($272,993) ($133,690) ($338,354) ($174,293) ($21,561) ($1,441,739) ($46,208) ($3,012,515) ($90,764) ($407,365) ($8,061,424) ($3,090,170) ($932,842) ($4,727,612) ($169,156) ($11,361,069) ($121,337) ($830,557) ($174,238) ($1,743,798) ($5,614,129) ($511,388) ($3,064,509) ($110,937) ($114,614)
Current Law (SB 1 HB 3646 - FY13 821CS) FY13 Total M&O Revenue per HB 3646 WADA $5,261 $5,387 $6,053 $5,144 $5,134 $5,256 $5,353 $5,231 $5,203 $5,353 $5,211 $5,564 $6,082 $5,240 $5,265 $5,438 $6,103 $5,239 $5,612 $5,121 $5,275 $5,291 $5,391 $5,156 $5,157 $5,239 $5,617 $5,374 $5,107 $5,490
FY13
Change in Total Total M&O M&O Revenue Revenue per HB per HB3646 3646 WADA WADA $5,747 $5,470 $6,593 $5,217 $5,279 $5,744 $5,784 $5,720 $5,682 $5,430 $5,696 $5,650 $6,662 $5,313 $5,721 $5,536 $6,662 $5,392 $5,694 $5,559 $5,785 $5,775 $5,869 $5,325 $5,561 $5,493 $6,103 $5,452 $5,540 $5,988
($485) ($83) ($540) ($73) ($146) ($488) ($431) ($489) ($478) ($77) ($485) ($87) ($580) ($74) ($456) ($98) ($559) ($153) ($82) ($438) ($511) ($484) ($478) ($169) ($404) ($254) ($487) ($79) ($433) ($498) Page 1 of 38
Comparison of Total M&O Revenue for School Districts and Charter Schools - LBB Model 887 FISCAL YEAR 2013 Note: All figures below are estimates and are subject to change based on actual and final student counts, property values, and tax effort. Amounts reflect available statewide estimates and may differ from local projections. M&O revenue amounts below are based on district entitlement for a full year, and do not reflect a payment deferral or any other actual or potential change to the distribution schedule of that entitlement.
Fiscal Year 2013 District Name
AMHERST ISD AMIGOS POR VIDA-FRIENDS FOR LI ANAHUAC ISD ANDERSON-SHIRO CISD ANDREWS ISD ANGLETON ISD ANNA ISD ANSON ISD ANTHONY ISD ANTON ISD APPLE SPRINGS ISD AQUILLA ISD ARANSAS COUNTY ISD ARANSAS PASS ISD ARCHER CITY ISD ARGYLE ISD ARLINGTON CLASSICS ACADEMY ARLINGTON ISD ARP ISD ASPERMONT ISD ATHENS ISD ATLANTA ISD AUBREY ISD AUSTIN CAN ACADEMY CHARTER SCH AUSTIN DISCOVERY SCHOOL AUSTIN ISD AUSTWELL-TIVOLI ISD AVALON ISD AVERY ISD AVINGER ISD Legislative Budget Board - Model 887
County District Number
County Name
140901 101819 036901 093901 002901 020902 043902 127901 071906 110901 228905 109912 004901 205901 005901 061910 220802 220901 212901 217901 107901 034901 061907 227818 227821 227901 196901 070901 194902 034902
LAMB HARRIS CHAMBERS GRIMES ANDREWS BRAZORIA COLLIN JONES EL PASO HOCKLEY TRINITY HILL ARANSAS SAN PATRICIO ARCHER DENTON TARRANT TARRANT SMITH STONEWALL HENDERSON CASS DENTON TRAVIS TRAVIS TRAVIS REFUGIO ELLIS RED RIVER CASS
HB3646 WADA
291 959 1,728 1,074 4,199 7,809 3,559 1,084 1,289 352 324 403 3,916 2,212 838 2,210 1,197 77,561 1,207 413 4,252 2,241 2,528 552 572 105,038 239 529 600 263
Current Law (SB 1 821CS) - FY13
Total M&O Revenue
$1,482,032 $4,954,929 $8,464,344 $5,685,223 $27,527,024 $41,436,525 $19,285,558 $6,049,713 $6,754,355 $1,780,793 $1,684,248 $2,267,887 $24,604,939 $11,481,546 $4,515,142 $13,271,846 $6,091,824 $407,202,728 $7,257,001 $2,383,976 $22,322,635 $11,415,987 $13,098,470 $2,912,451 $2,993,812 $628,746,108 $2,106,999 $2,917,002 $3,082,529 $1,436,534
Fiscal Year: 2013
HB 3646 - FY13
FY13
Total M&O Revenue
Change in Total M&O Revenue
$1,500,605 $5,413,048 $9,193,507 $6,227,589 $30,033,846 $45,205,404 $21,090,098 $6,132,395 $6,854,083 $1,803,941 $1,752,609 $2,322,769 $26,880,997 $11,733,525 $4,926,955 $14,572,638 $6,652,110 $413,256,018 $7,957,045 $2,604,548 $23,055,966 $12,479,646 $14,350,853 $3,177,305 $3,282,254 $687,133,349 $2,283,136 $2,958,165 $3,124,689 $1,543,330
($18,573) ($458,119) ($729,163) ($542,366) ($2,506,822) ($3,768,879) ($1,804,541) ($82,682) ($99,728) ($23,148) ($68,361) ($54,883) ($2,276,058) ($251,979) ($411,814) ($1,300,792) ($560,287) ($6,053,290) ($700,045) ($220,571) ($733,331) ($1,063,658) ($1,252,383) ($264,854) ($288,441) ($58,387,240) ($176,136) ($41,163) ($42,160) ($106,796)
Current Law (SB 1 HB 3646 - FY13 821CS) FY13 Total M&O Revenue per HB 3646 WADA $5,101 $5,166 $4,899 $5,295 $6,555 $5,306 $5,419 $5,581 $5,240 $5,060 $5,197 $5,625 $6,284 $5,190 $5,391 $6,005 $5,089 $5,250 $6,011 $5,777 $5,250 $5,094 $5,181 $5,281 $5,234 $5,986 $8,801 $5,514 $5,137 $5,464
FY13
Change in Total Total M&O M&O Revenue Revenue per HB per HB3646 3646 WADA WADA $5,165 $5,644 $5,321 $5,800 $7,152 $5,789 $5,926 $5,657 $5,317 $5,126 $5,408 $5,762 $6,865 $5,304 $5,882 $6,594 $5,557 $5,328 $6,591 $6,312 $5,422 $5,568 $5,677 $5,761 $5,739 $6,542 $9,537 $5,592 $5,207 $5,871
($64) ($478) ($422) ($505) ($597) ($483) ($507) ($76) ($77) ($66) ($211) ($136) ($581) ($114) ($492) ($589) ($468) ($78) ($580) ($535) ($172) ($475) ($495) ($480) ($504) ($556) ($736) ($78) ($70) ($406) Page 2 of 38
Comparison of Total M&O Revenue for School Districts and Charter Schools - LBB Model 887 FISCAL YEAR 2013 Note: All figures below are estimates and are subject to change based on actual and final student counts, property values, and tax effort. Amounts reflect available statewide estimates and may differ from local projections. M&O revenue amounts below are based on district entitlement for a full year, and do not reflect a payment deferral or any other actual or potential change to the distribution schedule of that entitlement.
Fiscal Year 2013 District Name
AW BROWN-FELLOWSHIP CHARTER SC AXTELL ISD AZLE ISD AZLEWAY CHARTER SCHOOL BAIRD ISD BALLINGER ISD BALMORHEA ISD BANDERA ISD BANGS ISD BANQUETE ISD BARBERS HILL ISD BARTLETT ISD BASTROP ISD BAY AREA CHARTER INC BAY CITY ISD BEATRICE MAYES INSTITUTE CHART BEAUMONT ISD BECKVILLE ISD BEEVILLE ISD BELLEVUE ISD BELLS ISD BELLVILLE ISD BELTON ISD BEN BOLT-PALITO BLANCO CISD BENAVIDES ISD BENJAMIN ISD BENJI'S SPECIAL EDUCATIONAL AC BEXAR COUNTY ACADEMY BIG SANDY ISD (Polk) BIG SANDY ISD (Upshur) BIG SPRING ISD Legislative Budget Board - Model 887
County District Number
County Name
057816 161918 220915 212803 030903 200901 195902 010902 025901 178913 036902 014902 011901 101809 158901 101847 123910 183901 013901 039904 091901 008901 014903 125902 066901 138904 101820 015809 187901 230901 114901
DALLAS MCLENNAN TARRANT SMITH CALLAHAN RUNNELS REEVES BANDERA BROWN NUECES CHAMBERS BELL BASTROP HARRIS MATAGORDA HARRIS JEFFERSON PANOLA BEE CLAY GRAYSON AUSTIN BELL JIM WELLS DUVAL KNOX HARRIS BEXAR POLK UPSHUR HOWARD
HB3646 WADA
2,194 1,330 6,675 606 588 1,540 324 3,141 1,501 1,200 5,152 626 11,407 508 4,586 680 23,890 1,021 4,476 237 1,121 2,857 11,582 937 666 170 613 519 757 1,044 4,872
Current Law (SB 1 821CS) - FY13
Total M&O Revenue
$11,342,578 $7,533,236 $35,286,369 $3,165,051 $3,142,290 $8,687,414 $2,067,758 $17,102,690 $7,616,679 $6,133,718 $35,431,828 $3,192,907 $60,764,580 $2,702,792 $26,196,910 $3,505,727 $131,032,135 $6,846,426 $23,030,453 $1,323,756 $6,177,404 $15,205,179 $65,610,397 $4,824,980 $3,712,088 $957,119 $3,199,041 $2,661,316 $3,826,138 $5,433,071 $25,969,278
Fiscal Year: 2013
HB 3646 - FY13
FY13
Total M&O Revenue
Change in Total M&O Revenue
$12,389,949 $7,624,819 $38,313,023 $3,378,799 $3,402,164 $9,237,777 $2,249,243 $18,678,693 $8,098,319 $6,371,869 $38,888,633 $3,237,762 $61,790,057 $2,953,543 $27,757,903 $3,835,385 $143,304,651 $7,495,899 $23,356,868 $1,354,393 $6,643,866 $16,241,795 $68,384,933 $5,258,274 $4,062,309 $971,022 $3,497,233 $2,909,523 $4,189,925 $5,600,016 $27,511,159
($1,047,370) ($91,583) ($3,026,654) ($213,748) ($259,874) ($550,364) ($181,485) ($1,576,003) ($481,640) ($238,151) ($3,456,804) ($44,855) ($1,025,477) ($250,751) ($1,560,994) ($329,659) ($12,272,517) ($649,472) ($326,415) ($30,637) ($466,461) ($1,036,616) ($2,774,536) ($433,294) ($350,221) ($13,903) ($298,191) ($248,207) ($363,786) ($166,945) ($1,541,881)
Current Law (SB 1 HB 3646 - FY13 821CS) FY13 Total M&O Revenue per HB 3646 WADA $5,170 $5,666 $5,286 $5,220 $5,341 $5,643 $6,379 $5,445 $5,073 $5,110 $6,877 $5,103 $5,327 $5,321 $5,713 $5,157 $5,485 $6,704 $5,145 $5,580 $5,510 $5,321 $5,665 $5,148 $5,577 $5,629 $5,216 $5,124 $5,055 $5,204 $5,330
FY13
Change in Total Total M&O M&O Revenue Revenue per HB per HB3646 3646 WADA WADA $5,647 $5,734 $5,740 $5,572 $5,783 $6,000 $6,939 $5,947 $5,394 $5,309 $7,548 $5,174 $5,417 $5,815 $6,053 $5,642 $5,998 $7,340 $5,218 $5,710 $5,926 $5,684 $5,904 $5,610 $6,103 $5,711 $5,702 $5,602 $5,536 $5,364 $5,647
($477) ($69) ($453) ($353) ($442) ($357) ($560) ($502) ($321) ($198) ($671) ($72) ($90) ($494) ($340) ($485) ($514) ($636) ($73) ($129) ($416) ($363) ($240) ($462) ($526) ($82) ($486) ($478) ($481) ($160) ($316) Page 3 of 38
Comparison of Total M&O Revenue for School Districts and Charter Schools - LBB Model 887 FISCAL YEAR 2013 Note: All figures below are estimates and are subject to change based on actual and final student counts, property values, and tax effort. Amounts reflect available statewide estimates and may differ from local projections. M&O revenue amounts below are based on district entitlement for a full year, and do not reflect a payment deferral or any other actual or potential change to the distribution schedule of that entitlement.
Fiscal Year 2013 District Name
BIG SPRINGS CHARTER SCHOOL BIRDVILLE ISD BISHOP CONS ISD BLACKWELL CISD BLANCO ISD BLAND ISD BLANKET ISD BLOOMBURG ISD BLOOMING GROVE ISD BLOOMINGTON ISD BLUE RIDGE ISD BLUFF DALE ISD BLUM ISD BOERNE ISD BOLES ISD BOLING ISD BONHAM ISD BOOKER ISD BORDEN COUNTY ISD BORGER ISD BOSQUEVILLE ISD BOVINA ISD BOWIE ISD BOYD ISD BOYS RANCH ISD BRACKETT ISD BRADY ISD BRAZOS ISD BRAZOS RIVER CHARTER SCHOOL BRAZOS SCHOOL FOR INQUIRY & CR BRAZOSPORT ISD BRECKENRIDGE ISD BREMOND ISD
Legislative Budget Board - Model 887
County District Number
County Name
193801 220902 178902 177903 016902 116915 025904 034909 175902 235901 043917 072904 109913 130901 116916 241901 074903 148901 017901 117901 161923 185901 169901 249902 180901 136901 160901 008903 213801 021803 020905 215901 198901
REAL TARRANT NUECES NOLAN BLANCO HUNT BROWN CASS NAVARRO VICTORIA COLLIN ERATH HILL KENDALL HUNT WHARTON FANNIN LIPSCOMB BORDEN HUTCHINSON MCLENNAN PARMER MONTAGUE WISE OLDHAM KINNEY MCCULLOCH AUSTIN SOMERVELL BRAZOS BRAZORIA STEPHENS ROBERTSON
HB3646 WADA
604 29,731 1,660 305 1,463 867 388 486 1,225 1,186 1,042 177 601 7,522 887 1,415 2,532 738 377 3,411 1,086 791 2,065 1,454 576 1,047 1,827 1,162 247 826 15,316 2,033 675
Current Law (SB 1 821CS) - FY13
Total M&O Revenue
$3,218,956 $156,096,781 $8,467,536 $2,272,789 $8,132,203 $4,447,138 $1,997,803 $2,701,706 $6,317,836 $6,040,372 $5,851,813 $1,081,269 $3,377,252 $44,425,360 $4,937,827 $7,433,352 $12,860,383 $4,089,683 $4,868,247 $17,323,022 $5,948,930 $3,814,828 $10,937,725 $8,980,532 $2,848,914 $5,266,184 $9,323,755 $6,017,933 $1,345,665 $4,348,911 $80,302,253 $10,754,909 $4,993,541
Fiscal Year: 2013
HB 3646 - FY13
FY13
Total M&O Revenue
Change in Total M&O Revenue
$3,473,425 $158,403,238 $9,011,984 $2,486,904 $8,877,444 $4,581,548 $2,165,124 $2,737,795 $6,406,809 $6,196,089 $5,933,919 $1,183,721 $3,562,020 $48,618,806 $5,007,680 $7,808,975 $13,257,167 $4,451,497 $5,302,738 $17,581,741 $6,148,735 $4,130,290 $11,966,523 $9,823,601 $2,878,825 $5,724,483 $10,014,907 $6,505,718 $1,466,954 $4,739,317 $87,505,901 $11,770,461 $5,474,801
($254,470) ($2,306,457) ($544,448) ($214,115) ($745,241) ($134,410) ($167,321) ($36,089) ($88,973) ($155,717) ($82,107) ($102,453) ($184,768) ($4,193,446) ($69,853) ($375,622) ($396,783) ($361,814) ($434,491) ($258,719) ($199,804) ($315,462) ($1,028,798) ($843,069) ($29,911) ($458,299) ($691,151) ($487,784) ($121,288) ($390,406) ($7,203,647) ($1,015,552) ($481,260)
Current Law (SB 1 HB 3646 - FY13 821CS) FY13 Total M&O Revenue per HB 3646 WADA $5,332 $5,250 $5,100 $7,456 $5,560 $5,130 $5,155 $5,562 $5,158 $5,092 $5,618 $6,109 $5,617 $5,906 $5,568 $5,253 $5,078 $5,543 $12,904 $5,079 $5,480 $4,824 $5,296 $6,175 $4,945 $5,028 $5,103 $5,179 $5,443 $5,263 $5,243 $5,290 $7,400
FY13
Change in Total Total M&O M&O Revenue Revenue per HB per HB3646 3646 WADA WADA $5,753 $5,328 $5,428 $8,159 $6,070 $5,285 $5,587 $5,637 $5,231 $5,223 $5,697 $6,688 $5,924 $6,463 $5,646 $5,518 $5,235 $6,033 $14,055 $5,155 $5,664 $5,223 $5,794 $6,754 $4,997 $5,466 $5,481 $5,599 $5,933 $5,736 $5,713 $5,790 $8,113
($421) ($78) ($328) ($702) ($510) ($155) ($432) ($74) ($73) ($131) ($79) ($579) ($307) ($557) ($79) ($265) ($157) ($490) ($1,152) ($76) ($184) ($399) ($498) ($580) ($52) ($438) ($378) ($420) ($491) ($472) ($470) ($500) ($713)
Page 4 of 38
Comparison of Total M&O Revenue for School Districts and Charter Schools - LBB Model 887 FISCAL YEAR 2013 Note: All figures below are estimates and are subject to change based on actual and final student counts, property values, and tax effort. Amounts reflect available statewide estimates and may differ from local projections. M&O revenue amounts below are based on district entitlement for a full year, and do not reflect a payment deferral or any other actual or potential change to the distribution schedule of that entitlement.
Fiscal Year 2013 District Name
BRENHAM ISD BRIDGE CITY ISD BRIDGEPORT ISD BRIGHT IDEAS CHARTER BROADDUS ISD BROCK ISD BRONTE ISD BROOKELAND ISD BROOKESMITH ISD BROOKS ACADEMY OF SCIENCE AND BROOKS COUNTY ISD BROWNFIELD ISD BROWNSBORO ISD BROWNSVILLE ISD BROWNWOOD ISD BRUCEVILLE-EDDY ISD BRYAN ISD BRYSON ISD BUCKHOLTS ISD BUENA VISTA ISD BUFFALO ISD BULLARD ISD BUNA ISD BURKBURNETT ISD BURKEVILLE ISD BURLESON ISD BURNET CONS ISD BURNHAM WOOD CHARTER SCHOOL DI BURTON ISD BUSHLAND ISD BYERS ISD BYNUM ISD CADDO MILLS ISD
Legislative Budget Board - Model 887
County District Number
County Name
239901 181901 249903 243801 203902 184909 041901 121902 025908 015830 024901 223901 107902 031901 025902 161919 021902 119901 166907 186901 145901 212902 121903 243901 176901 126902 027903 071801 239903 188904 039901 109902 116901
WASHINGTON ORANGE WISE WICHITA SAN AUGUSTINE PARKER COKE JASPER BROWN BEXAR BROOKS TERRY HENDERSON CAMERON BROWN MCLENNAN BRAZOS JACK MILAM PECOS LEON SMITH JASPER WICHITA NEWTON JOHNSON BURNET EL PASO WASHINGTON POTTER CLAY HILL HUNT
HB3646 WADA
6,399 3,229 3,107 272 779 1,236 553 685 246 951 2,133 2,440 3,617 65,569 4,402 1,259 19,266 260 296 176 1,357 2,613 1,959 4,107 478 12,838 4,511 1,834 598 1,846 142 417 2,128
Current Law (SB 1 821CS) - FY13
Total M&O Revenue
$31,925,251 $16,317,592 $17,603,350 $1,401,230 $4,328,473 $6,694,482 $2,813,612 $3,575,183 $1,266,105 $4,918,900 $13,504,759 $14,038,192 $17,636,264 $343,850,529 $22,458,474 $7,014,344 $100,109,832 $1,350,595 $1,525,451 $1,174,808 $7,377,284 $14,954,984 $10,143,707 $22,978,549 $2,411,857 $66,461,668 $24,096,946 $9,402,834 $3,389,625 $11,088,085 $794,174 $2,339,333 $10,923,168
Fiscal Year: 2013
HB 3646 - FY13
FY13
Total M&O Revenue
Change in Total M&O Revenue
$34,952,859 $17,228,045 $19,197,071 $1,535,855 $4,383,355 $7,321,978 $3,022,607 $3,678,874 $1,294,584 $5,318,028 $14,732,191 $15,266,136 $19,052,609 $350,469,766 $24,079,759 $7,232,046 $105,125,828 $1,439,617 $1,563,508 $1,281,369 $8,063,133 $16,258,052 $10,290,438 $23,778,176 $2,543,295 $69,821,924 $26,329,892 $10,293,098 $3,709,620 $12,141,782 $805,966 $2,370,837 $11,651,256
($3,027,609) ($910,454) ($1,593,720) ($134,625) ($54,882) ($627,496) ($208,995) ($103,692) ($28,479) ($399,128) ($1,227,432) ($1,227,944) ($1,416,345) ($6,619,237) ($1,621,285) ($217,701) ($5,015,996) ($89,022) ($38,057) ($106,561) ($685,849) ($1,303,067) ($146,731) ($799,628) ($131,438) ($3,360,256) ($2,232,945) ($890,264) ($319,996) ($1,053,697) ($11,792) ($31,505) ($728,088)
Current Law (SB 1 HB 3646 - FY13 821CS) FY13 Total M&O Revenue per HB 3646 WADA $4,989 $5,053 $5,666 $5,157 $5,556 $5,418 $5,087 $5,219 $5,151 $5,171 $6,332 $5,753 $4,877 $5,244 $5,102 $5,570 $5,196 $5,197 $5,150 $6,685 $5,436 $5,723 $5,178 $5,595 $5,049 $5,177 $5,342 $5,128 $5,672 $6,006 $5,579 $5,609 $5,133
FY13
Change in Total Total M&O M&O Revenue Revenue per HB per HB3646 3646 WADA WADA $5,462 $5,335 $6,179 $5,652 $5,627 $5,925 $5,465 $5,371 $5,267 $5,590 $6,907 $6,257 $5,268 $5,345 $5,471 $5,743 $5,457 $5,539 $5,279 $7,292 $5,941 $6,222 $5,252 $5,789 $5,324 $5,439 $5,837 $5,614 $6,208 $6,576 $5,662 $5,685 $5,475
($473) ($282) ($513) ($495) ($70) ($508) ($378) ($151) ($116) ($420) ($575) ($503) ($392) ($101) ($368) ($173) ($260) ($343) ($128) ($606) ($505) ($499) ($75) ($195) ($275) ($262) ($495) ($486) ($535) ($571) ($83) ($76) ($342)
Page 5 of 38
Comparison of Total M&O Revenue for School Districts and Charter Schools - LBB Model 887 FISCAL YEAR 2013 Note: All figures below are estimates and are subject to change based on actual and final student counts, property values, and tax effort. Amounts reflect available statewide estimates and may differ from local projections. M&O revenue amounts below are based on district entitlement for a full year, and do not reflect a payment deferral or any other actual or potential change to the distribution schedule of that entitlement.
Fiscal Year 2013 District Name
CALALLEN ISD CALDWELL ISD CALHOUN COUNTY ISD CALLISBURG ISD CALVERT ISD CALVIN NELMS CHARTER SCHOOLS CAMERON ISD CAMPBELL ISD CANADIAN ISD CANTON ISD CANUTILLO ISD CANYON ISD CARLISLE ISD CARRIZO SPRINGS CONS ISD CARROLL ISD CARROLLTON-FARMERS BRANCH ISD CARTHAGE ISD CASTLEBERRY ISD CAYUGA ISD CEDAR HILL ISD CEDARS INTERNATIONAL ACADEMY CELESTE ISD CELINA ISD CENTER ISD CENTER POINT ISD CENTERVILLE ISD (Leon) CENTERVILLE ISD (Trinity) CENTRAL HEIGHTS ISD CENTRAL ISD CHANNELVIEW ISD CHANNING ISD CHAPEL HILL ACADEMY CHAPEL HILL ISD (Smith)
Legislative Budget Board - Model 887
County District Number
County Name
178903 026901 029901 049905 198902 101837 166901 116910 106901 234902 071907 191901 201913 064903 220919 057903 183902 220917 001902 057904 227817 116902 043903 210901 133901 145902 228904 174908 003907 101905 103901 220815 212909
NUECES BURLESON CALHOUN COOKE ROBERTSON HARRIS MILAM HUNT HEMPHILL VAN ZANDT EL PASO RANDALL RUSK DIMMIT TARRANT DALLAS PANOLA TARRANT ANDERSON DALLAS TRAVIS HUNT COLLIN SHELBY KERR LEON TRINITY NACOGDOCHES ANGELINA HARRIS HARTLEY TARRANT SMITH
HB3646 WADA
4,564 2,429 5,293 1,656 302 458 2,154 648 1,308 2,585 7,842 10,363 1,058 2,988 8,565 33,574 3,398 4,882 929 11,010 353 814 2,849 3,526 1,000 1,152 243 1,299 1,995 11,565 301 330 4,384
Current Law (SB 1 821CS) - FY13
Total M&O Revenue
$25,847,192 $12,892,909 $28,590,895 $9,690,784 $1,483,773 $2,448,644 $11,076,962 $3,300,042 $8,982,256 $13,237,673 $41,144,643 $53,039,343 $5,677,559 $16,464,812 $49,123,058 $181,724,327 $21,019,350 $27,642,420 $5,266,431 $57,170,044 $1,888,878 $4,574,178 $15,753,570 $19,242,722 $5,161,244 $5,840,142 $1,358,334 $6,362,303 $11,318,125 $60,436,144 $1,689,638 $1,683,918 $23,781,279
Fiscal Year: 2013
HB 3646 - FY13
FY13
Total M&O Revenue
Change in Total M&O Revenue
$26,583,686 $14,105,711 $31,184,019 $10,597,982 $1,553,510 $2,660,573 $11,551,014 $3,496,994 $9,771,387 $14,301,550 $42,099,214 $56,348,922 $5,812,273 $16,884,759 $53,883,035 $199,003,397 $22,956,720 $28,054,739 $5,768,855 $60,091,010 $2,063,849 $4,635,502 $17,177,391 $19,515,945 $5,597,601 $6,031,838 $1,411,804 $6,716,876 $11,478,981 $62,339,849 $1,847,432 $1,828,924 $24,880,116
($736,495) ($1,212,803) ($2,593,124) ($907,198) ($69,737) ($211,929) ($474,052) ($196,953) ($789,131) ($1,063,877) ($954,571) ($3,309,579) ($134,714) ($419,947) ($4,759,977) ($17,279,070) ($1,937,371) ($412,319) ($502,424) ($2,920,967) ($174,971) ($61,324) ($1,423,821) ($273,223) ($436,357) ($191,696) ($53,470) ($354,573) ($160,856) ($1,903,705) ($157,794) ($145,006) ($1,098,837)
Current Law (SB 1 HB 3646 - FY13 821CS) FY13 Total M&O Revenue per HB 3646 WADA $5,663 $5,308 $5,402 $5,851 $4,908 $5,350 $5,142 $5,090 $6,866 $5,120 $5,246 $5,118 $5,365 $5,509 $5,735 $5,413 $6,186 $5,662 $5,671 $5,193 $5,349 $5,623 $5,530 $5,457 $5,160 $5,071 $5,598 $4,898 $5,673 $5,226 $5,611 $5,095 $5,424
FY13
Change in Total Total M&O M&O Revenue Revenue per HB per HB3646 3646 WADA WADA $5,825 $5,807 $5,891 $6,399 $5,138 $5,813 $5,362 $5,394 $7,469 $5,532 $5,368 $5,437 $5,493 $5,650 $6,291 $5,927 $6,756 $5,746 $6,212 $5,458 $5,845 $5,698 $6,030 $5,535 $5,596 $5,238 $5,818 $5,171 $5,754 $5,390 $6,135 $5,534 $5,675
($161) ($499) ($490) ($548) ($231) ($463) ($220) ($304) ($603) ($411) ($122) ($319) ($127) ($141) ($556) ($515) ($570) ($84) ($541) ($265) ($495) ($75) ($500) ($77) ($436) ($166) ($220) ($273) ($81) ($165) ($524) ($439) ($251)
Page 6 of 38
Comparison of Total M&O Revenue for School Districts and Charter Schools - LBB Model 887 FISCAL YEAR 2013 Note: All figures below are estimates and are subject to change based on actual and final student counts, property values, and tax effort. Amounts reflect available statewide estimates and may differ from local projections. M&O revenue amounts below are based on district entitlement for a full year, and do not reflect a payment deferral or any other actual or potential change to the distribution schedule of that entitlement.
Fiscal Year 2013 District Name
CHAPEL HILL ISD (Titus) CHARLOTTE ISD CHEROKEE ISD CHESTER ISD CHICO ISD CHILDREN FIRST ACADEMY OF DALL CHILDREN FIRST ACADEMY OF HOUS CHILDRESS ISD CHILLICOTHE ISD CHILTON ISD CHINA SPRING ISD CHIRENO ISD CHISUM ISD CHRISTOVAL ISD CISCO ISD CITY CENTER HEALTH CAREERS CITY VIEW ISD CLARENDON ISD CLARKSVILLE ISD CLAUDE ISD CLEAR CREEK ISD CLEBURNE ISD CLEVELAND ISD CLIFTON ISD CLINT ISD CLYDE CONS ISD COAHOMA ISD COLDSPRING-OAKHURST CONS ISD COLEMAN ISD COLLEGE STATION ISD COLLINSVILLE ISD COLMESNEIL ISD COLORADO ISD
Legislative Budget Board - Model 887
County District Number
County Name
225906 007901 206903 229906 249904 057811 101823 038901 099902 073901 161920 174901 139905 226901 067902 015832 243906 065901 194904 006902 084910 126903 146901 018901 071901 030902 114902 204901 042901 021901 091902 229901 168901
TITUS ATASCOSA SAN SABA TYLER WISE DALLAS HARRIS CHILDRESS HARDEMAN FALLS MCLENNAN NACOGDOCHES LAMAR TOM GREEN EASTLAND BEXAR WICHITA DONLEY RED RIVER ARMSTRONG GALVESTON JOHNSON LIBERTY BOSQUE EL PASO CALLAHAN HOWARD SAN JACINTO COLEMAN BRAZOS GRAYSON TYLER MITCHELL
HB3646 WADA
1,357 867 234 308 849 411 579 1,681 330 874 2,952 541 1,191 743 1,278 98 1,329 901 1,203 542 46,118 8,512 4,940 1,502 15,483 1,986 1,235 2,220 1,306 12,486 800 810 1,645
Current Law (SB 1 821CS) - FY13
Total M&O Revenue
$6,908,293 $4,366,279 $1,298,721 $1,557,314 $5,162,099 $2,147,545 $3,013,024 $8,564,800 $1,837,178 $4,492,045 $14,988,441 $2,844,917 $6,330,220 $3,872,035 $7,265,582 $504,302 $7,319,294 $4,655,488 $6,397,195 $2,849,676 $250,932,188 $45,402,571 $25,812,055 $7,547,479 $81,454,979 $10,063,022 $6,188,571 $11,831,625 $7,194,728 $68,336,516 $4,313,059 $4,013,284 $9,216,939
Fiscal Year: 2013
HB 3646 - FY13
FY13
Total M&O Revenue
Change in Total M&O Revenue
$7,244,575 $4,693,563 $1,326,631 $1,578,746 $5,641,734 $2,348,021 $3,228,198 $8,949,251 $2,004,161 $4,548,754 $16,374,273 $2,914,966 $6,889,589 $4,065,843 $7,929,305 $546,927 $7,429,586 $5,071,080 $6,946,364 $3,105,190 $275,098,090 $49,726,476 $27,127,482 $8,124,541 $82,677,822 $10,343,792 $6,775,532 $12,699,301 $7,675,374 $75,180,697 $4,675,897 $4,071,059 $9,393,675
($336,281) ($327,284) ($27,910) ($21,432) ($479,635) ($200,476) ($215,174) ($384,451) ($166,983) ($56,710) ($1,385,832) ($70,049) ($559,369) ($193,808) ($663,723) ($42,625) ($110,291) ($415,593) ($549,169) ($255,513) ($24,165,902) ($4,323,905) ($1,315,426) ($577,062) ($1,222,843) ($280,770) ($586,961) ($867,676) ($480,646) ($6,844,181) ($362,838) ($57,775) ($176,735)
Current Law (SB 1 HB 3646 - FY13 821CS) FY13 Total M&O Revenue per HB 3646 WADA $5,092 $5,035 $5,547 $5,058 $6,082 $5,226 $5,204 $5,095 $5,572 $5,140 $5,077 $5,258 $5,316 $5,209 $5,683 $5,149 $5,507 $5,168 $5,316 $5,261 $5,441 $5,334 $5,225 $5,026 $5,261 $5,067 $5,013 $5,331 $5,509 $5,473 $5,394 $4,955 $5,603
FY13
Change in Total Total M&O M&O Revenue Revenue per HB per HB3646 3646 WADA WADA $5,340 $5,413 $5,666 $5,127 $6,647 $5,713 $5,576 $5,324 $6,078 $5,205 $5,546 $5,388 $5,786 $5,470 $6,202 $5,584 $5,590 $5,630 $5,773 $5,733 $5,965 $5,842 $5,491 $5,410 $5,340 $5,209 $5,488 $5,722 $5,877 $6,021 $5,847 $5,026 $5,711
($248) ($377) ($119) ($70) ($565) ($488) ($372) ($229) ($506) ($65) ($469) ($129) ($470) ($261) ($519) ($435) ($83) ($461) ($456) ($472) ($524) ($508) ($266) ($384) ($79) ($141) ($475) ($391) ($368) ($548) ($454) ($71) ($107)
Page 7 of 38
Comparison of Total M&O Revenue for School Districts and Charter Schools - LBB Model 887 FISCAL YEAR 2013 Note: All figures below are estimates and are subject to change based on actual and final student counts, property values, and tax effort. Amounts reflect available statewide estimates and may differ from local projections. M&O revenue amounts below are based on district entitlement for a full year, and do not reflect a payment deferral or any other actual or potential change to the distribution schedule of that entitlement.
Fiscal Year 2013 District Name
COLUMBIA-BRAZORIA ISD COLUMBUS ISD COMAL ISD COMANCHE ISD COMFORT ISD COMMERCE ISD COMMUNITY ISD COMO-PICKTON CISD COMQUEST ACADEMY COMSTOCK ISD CONNALLY ISD CONROE ISD COOLIDGE ISD COOPER ISD COPPELL ISD COPPERAS COVE ISD CORPUS CHRISTI ISD CORPUS CHRISTI MONTESSORI SCHO CORRIGAN-CAMDEN ISD CORSICANA ISD COTTON CENTER ISD COTULLA ISD COUPLAND ISD COVINGTON ISD CRANDALL ISD CRANE ISD CRANFILLS GAP ISD CRAWFORD ISD CROCKETT COUNTY CCSD CROCKETT ISD CROSBY ISD CROSBYTON ISD CROSS PLAINS ISD
Legislative Budget Board - Model 887
County District Number
County Name
020907 045902 046902 047901 130902 116903 043918 112908 101842 233903 161921 170902 147901 060902 057922 050910 178904 178807 187904 175903 095902 142901 246914 109903 129901 052901 018908 161901 053001 113901 101906 054901 030901
BRAZORIA COLORADO COMAL COMANCHE KENDALL HUNT COLLIN HOPKINS HARRIS VAL VERDE MCLENNAN MONTGOMERY LIMESTONE DELTA DALLAS CORYELL NUECES NUECES POLK NAVARRO HALE LA SALLE WILLIAMSON HILL KAUFMAN CRANE BOSQUE MCLENNAN CROCKETT HOUSTON HARRIS CROSBY CALLAHAN
HB3646 WADA
3,843 2,119 21,072 1,780 1,750 2,021 2,211 1,209 156 381 3,079 62,092 544 1,183 11,049 9,817 45,547 380 1,432 7,017 249 1,739 224 449 4,012 1,569 236 842 1,258 1,821 6,175 702 648
Current Law (SB 1 821CS) - FY13
Total M&O Revenue
$20,158,269 $10,848,420 $117,035,050 $9,224,741 $9,133,645 $11,191,778 $11,322,797 $6,175,460 $857,105 $2,313,645 $16,028,425 $335,394,693 $2,768,939 $6,654,934 $67,003,683 $51,134,574 $242,195,277 $1,948,476 $7,343,313 $36,083,272 $1,417,398 $9,683,660 $1,146,860 $2,317,414 $20,674,604 $14,469,136 $1,182,008 $4,276,265 $8,891,106 $9,493,730 $35,284,545 $3,706,335 $3,300,244
Fiscal Year: 2013
HB 3646 - FY13
FY13
Total M&O Revenue
Change in Total M&O Revenue
$20,464,411 $11,824,742 $128,377,760 $10,034,416 $9,979,692 $11,347,903 $12,088,063 $6,686,515 $923,705 $2,541,242 $16,243,120 $357,732,833 $2,805,437 $6,743,711 $73,023,892 $53,659,290 $246,374,646 $2,133,761 $7,540,215 $37,331,028 $1,438,023 $10,542,644 $1,259,392 $2,441,531 $21,262,106 $15,827,634 $1,276,412 $4,371,871 $9,685,308 $9,726,563 $37,225,599 $3,972,759 $3,585,718
($306,143) ($976,323) ($11,342,710) ($809,675) ($846,047) ($156,125) ($765,266) ($511,055) ($66,601) ($227,597) ($214,694) ($22,338,139) ($36,498) ($88,777) ($6,020,209) ($2,524,716) ($4,179,369) ($185,286) ($196,901) ($1,247,756) ($20,624) ($858,984) ($112,532) ($124,117) ($587,501) ($1,358,498) ($94,403) ($95,606) ($794,203) ($232,833) ($1,941,054) ($266,424) ($285,474)
Current Law (SB 1 HB 3646 - FY13 821CS) FY13 Total M&O Revenue per HB 3646 WADA $5,245 $5,119 $5,554 $5,182 $5,219 $5,537 $5,122 $5,109 $5,498 $6,072 $5,206 $5,402 $5,087 $5,623 $6,064 $5,209 $5,317 $5,127 $5,129 $5,142 $5,693 $5,568 $5,124 $5,158 $5,153 $9,221 $5,010 $5,077 $7,068 $5,214 $5,714 $5,280 $5,095
FY13
Change in Total Total M&O M&O Revenue Revenue per HB per HB3646 3646 WADA WADA $5,325 $5,579 $6,092 $5,637 $5,702 $5,614 $5,468 $5,532 $5,925 $6,669 $5,275 $5,761 $5,155 $5,698 $6,609 $5,466 $5,409 $5,615 $5,266 $5,320 $5,776 $6,062 $5,627 $5,435 $5,300 $10,086 $5,410 $5,191 $7,699 $5,342 $6,028 $5,659 $5,536
($80) ($461) ($538) ($455) ($483) ($77) ($346) ($423) ($427) ($597) ($70) ($360) ($67) ($75) ($545) ($257) ($92) ($488) ($138) ($178) ($83) ($494) ($503) ($276) ($146) ($866) ($400) ($114) ($631) ($128) ($314) ($380) ($441)
Page 8 of 38
Comparison of Total M&O Revenue for School Districts and Charter Schools - LBB Model 887 FISCAL YEAR 2013 Note: All figures below are estimates and are subject to change based on actual and final student counts, property values, and tax effort. Amounts reflect available statewide estimates and may differ from local projections. M&O revenue amounts below are based on district entitlement for a full year, and do not reflect a payment deferral or any other actual or potential change to the distribution schedule of that entitlement.
Fiscal Year 2013 District Name
CROSS ROADS ISD CROSSTIMBERS ACADEMY CROWELL ISD CROWLEY ISD CRYSTAL CITY ISD CUERO ISD CULBERSON CNTY-ALLAMOORE ISD CUMBERLAND ACADEMY CUMBY ISD CUSHING ISD CYPRESS-FAIRBANKS ISD DAINGERFIELD-LONE STAR ISD DALHART ISD DALLAS CAN ACADEMY CHARTER DALLAS COMMUNITY CHARTER SCHOO DALLAS COUNTY JUVENILE JUSTICE DALLAS ISD DAMON ISD DANBURY ISD DARROUZETT ISD DAWSON ISD (Dawson) DAWSON ISD (Navarro) DAYTON ISD DE LEON ISD DECATUR ISD DEER PARK ISD DEKALB ISD DEL VALLE ISD DELL CITY ISD DENISON ISD DENTON ISD DENVER CITY ISD DESOTO ISD
Legislative Budget Board - Model 887
County District Number
County Name
107904 184801 078901 220912 254901 062901 055901 212801 112905 174902 101907 172902 056901 057804 057805 057814 057905 020910 020904 148905 058902 175904 146902 047902 249905 101908 019901 227910 115903 091903 061901 251901 057906
HENDERSON PARKER FOARD TARRANT ZAVALA DEWITT CULBERSON SMITH HOPKINS NACOGDOCHES HARRIS MORRIS DALLAM DALLAS DALLAS DALLAS DALLAS BRAZORIA BRAZORIA LIPSCOMB DAWSON NAVARRO LIBERTY COMANCHE WISE HARRIS BOWIE TRAVIS HUDSPETH GRAYSON DENTON YOAKUM DALLAS
HB3646 WADA
1,003 201 377 18,669 2,806 2,408 719 389 717 735 137,084 1,697 2,152 2,761 213 909 196,924 290 1,102 262 239 709 5,771 1,042 3,881 15,173 1,113 14,225 259 5,899 31,623 2,006 11,717
Current Law (SB 1 821CS) - FY13
Total M&O Revenue
$5,103,906 $1,079,865 $2,005,544 $95,202,452 $15,815,477 $14,049,308 $4,139,723 $2,001,353 $3,588,597 $5,003,518 $687,307,733 $9,102,145 $10,693,707 $14,724,629 $1,108,546 $4,986,583 $1,047,117,988 $1,630,156 $5,728,230 $1,822,652 $1,840,194 $3,606,225 $30,571,130 $5,265,677 $24,518,239 $86,693,342 $6,018,417 $74,580,056 $1,323,852 $33,411,299 $183,450,643 $15,964,258 $61,242,228
Fiscal Year: 2013
HB 3646 - FY13
FY13
Total M&O Revenue
Change in Total M&O Revenue
$5,566,410 $1,178,369 $2,168,498 $98,588,630 $16,178,846 $15,253,271 $4,508,570 $2,186,136 $3,902,943 $5,480,975 $704,850,456 $9,956,388 $11,413,911 $16,069,443 $1,211,910 $5,428,446 $1,146,154,424 $1,723,657 $6,048,801 $1,985,848 $2,005,165 $3,657,738 $32,537,273 $5,741,946 $26,819,393 $94,992,091 $6,143,914 $81,631,985 $1,345,635 $34,138,361 $201,040,157 $17,424,585 $62,126,049
($462,504) ($98,504) ($162,954) ($3,386,178) ($363,369) ($1,203,963) ($368,847) ($184,783) ($314,346) ($477,458) ($17,542,723) ($854,244) ($720,204) ($1,344,815) ($103,364) ($441,863) ($99,036,436) ($93,501) ($320,571) ($163,196) ($164,971) ($51,513) ($1,966,144) ($476,269) ($2,301,153) ($8,298,749) ($125,497) ($7,051,929) ($21,783) ($727,062) ($17,589,513) ($1,460,326) ($883,821)
Current Law (SB 1 HB 3646 - FY13 821CS) FY13 Total M&O Revenue per HB 3646 WADA $5,091 $5,363 $5,323 $5,100 $5,636 $5,834 $5,761 $5,140 $5,005 $6,803 $5,014 $5,364 $4,970 $5,333 $5,200 $5,487 $5,317 $5,622 $5,196 $6,953 $7,704 $5,085 $5,298 $5,055 $6,317 $5,714 $5,409 $5,243 $5,114 $5,664 $5,801 $7,960 $5,227
FY13
Change in Total Total M&O M&O Revenue Revenue per HB per HB3646 3646 WADA WADA $5,552 $5,852 $5,755 $5,281 $5,766 $6,333 $6,275 $5,614 $5,443 $7,452 $5,142 $5,868 $5,304 $5,820 $5,685 $5,973 $5,820 $5,945 $5,487 $7,575 $8,395 $5,157 $5,638 $5,513 $6,910 $6,261 $5,521 $5,738 $5,198 $5,787 $6,357 $8,688 $5,302
($461) ($489) ($432) ($181) ($129) ($500) ($513) ($475) ($438) ($649) ($128) ($503) ($335) ($487) ($485) ($486) ($503) ($322) ($291) ($623) ($691) ($73) ($341) ($457) ($593) ($547) ($113) ($496) ($84) ($123) ($556) ($728) ($75)
Page 9 of 38
Comparison of Total M&O Revenue for School Districts and Charter Schools - LBB Model 887 FISCAL YEAR 2013 Note: All figures below are estimates and are subject to change based on actual and final student counts, property values, and tax effort. Amounts reflect available statewide estimates and may differ from local projections. M&O revenue amounts below are based on district entitlement for a full year, and do not reflect a payment deferral or any other actual or potential change to the distribution schedule of that entitlement.
Fiscal Year 2013 District Name
DETROIT ISD DEVERS ISD DEVINE ISD DEW ISD DEWEYVILLE ISD D'HANIS ISD DIBOLL ISD DICKINSON ISD DILLEY ISD DIME BOX ISD DIMMITT ISD DIVIDE ISD DODD CITY ISD DONNA ISD DOSS CONS CSD DOUGLASS ISD DR M L GARZA-GONZALEZ CHARTER DRAW ACADEMY DRIPPING SPRINGS ISD DRISCOLL ISD DUBLIN ISD DUMAS ISD DUNCANVILLE ISD EAGLE MT-SAGINAW ISD EAGLE PASS ISD EANES ISD EARLY ISD EAST BERNARD ISD EAST CENTRAL ISD EAST CHAMBERS ISD EAST FORT WORTH MONTESSORI ACA EAST TEXAS CHARTER SCHOOLS EASTLAND ISD
Legislative Budget Board - Model 887
County District Number
County Name
194905 146903 163901 081906 176903 163902 003905 084901 082902 144903 035901 133905 074904 108902 086024 174911 178801 101856 105904 178905 072902 171901 057907 220918 159901 227909 025909 241902 015911 036903 220811 092801 067903
RED RIVER LIBERTY MEDINA FREESTONE NEWTON MEDINA ANGELINA GALVESTON FRIO LEE CASTRO KERR FANNIN HIDALGO GILLESPIE NACOGDOCHES NUECES HARRIS HAYS NUECES ERATH MOORE DALLAS TARRANT MAVERICK TRAVIS BROWN WHARTON BEXAR CHAMBERS TARRANT GREGG EASTLAND
HB3646 WADA
745 254 2,532 198 927 578 2,676 12,180 1,525 281 1,824 85 483 21,371 108 553 366 475 5,368 390 1,683 5,635 16,400 23,865 19,371 8,476 1,684 1,347 12,059 1,871 574 239 1,592
Current Law (SB 1 821CS) - FY13
Total M&O Revenue
$4,099,176 $1,883,319 $14,312,177 $1,574,794 $4,887,493 $2,950,308 $13,602,819 $63,416,011 $8,334,564 $1,715,770 $9,362,594 $423,784 $2,474,545 $120,159,838 $477,282 $3,222,984 $1,918,582 $2,442,636 $30,896,640 $3,542,683 $8,724,862 $31,351,220 $86,696,734 $132,860,350 $99,658,505 $52,644,893 $8,569,404 $7,922,428 $64,223,792 $9,361,076 $2,984,386 $1,273,254 $8,008,449
Fiscal Year: 2013
HB 3646 - FY13
FY13
Total M&O Revenue
Change in Total M&O Revenue
$4,171,746 $2,051,510 $14,806,715 $1,705,727 $5,347,677 $3,051,090 $13,791,399 $67,560,395 $8,451,858 $1,863,208 $9,497,123 $461,435 $2,513,464 $121,894,180 $498,526 $3,536,373 $2,088,619 $2,667,699 $33,917,385 $3,886,823 $9,496,549 $34,319,172 $87,868,140 $145,019,428 $102,326,683 $57,637,243 $9,357,232 $8,044,642 $66,258,619 $10,215,511 $3,261,421 $1,387,564 $8,556,575
($72,569) ($168,191) ($494,538) ($130,933) ($460,184) ($100,781) ($188,580) ($4,144,384) ($117,294) ($147,438) ($134,529) ($37,652) ($38,919) ($1,734,342) ($21,244) ($313,389) ($170,037) ($225,064) ($3,020,745) ($344,140) ($771,687) ($2,967,951) ($1,171,405) ($12,159,078) ($2,668,178) ($4,992,350) ($787,828) ($122,213) ($2,034,827) ($854,435) ($277,034) ($114,310) ($548,126)
Current Law (SB 1 HB 3646 - FY13 821CS) FY13 Total M&O Revenue per HB 3646 WADA $5,499 $7,427 $5,652 $7,971 $5,274 $5,107 $5,084 $5,206 $5,466 $6,116 $5,133 $5,011 $5,124 $5,623 $4,416 $5,824 $5,246 $5,140 $5,756 $9,091 $5,184 $5,563 $5,287 $5,567 $5,145 $6,211 $5,089 $5,879 $5,326 $5,004 $5,195 $5,320 $5,031
FY13
Change in Total Total M&O M&O Revenue Revenue per HB per HB3646 3646 WADA WADA $5,596 $8,090 $5,847 $8,634 $5,771 $5,281 $5,154 $5,547 $5,543 $6,642 $5,207 $5,456 $5,205 $5,704 $4,613 $6,391 $5,711 $5,614 $6,318 $9,974 $5,643 $6,090 $5,358 $6,077 $5,283 $6,800 $5,557 $5,970 $5,495 $5,461 $5,677 $5,797 $5,375
($97) ($663) ($195) ($663) ($497) ($174) ($70) ($340) ($77) ($526) ($74) ($445) ($81) ($81) ($197) ($566) ($465) ($474) ($563) ($883) ($459) ($527) ($71) ($509) ($138) ($589) ($468) ($91) ($169) ($457) ($482) ($478) ($344)
Page 10 of 38
Comparison of Total M&O Revenue for School Districts and Charter Schools - LBB Model 887 FISCAL YEAR 2013 Note: All figures below are estimates and are subject to change based on actual and final student counts, property values, and tax effort. Amounts reflect available statewide estimates and may differ from local projections. M&O revenue amounts below are based on district entitlement for a full year, and do not reflect a payment deferral or any other actual or potential change to the distribution schedule of that entitlement.
Fiscal Year 2013 District Name
ECTOR COUNTY ISD ECTOR ISD EDCOUCH-ELSA ISD EDEN CONS ISD EDEN PARK ACADEMY EDGEWOOD ISD (Bexar) EDGEWOOD ISD (Van Zandt) EDINBURG CISD EDNA ISD EDUCATION CENTER EDUCATION CENTER INTERNATIONAL EHRHART SCHOOL EL CAMPO ISD EL PASO ACADEMY EL PASO ISD EL PASO SCHOOL OF EXCELLENCE ELECTRA ISD ELGIN ISD ELKHART ISD ELYSIAN FIELDS ISD ENCINO SCHOOL ENNIS ISD ERA ISD ERATH EXCELS ACADEMY INC ETOILE ISD EULA ISD EUSTACE ISD EVADALE ISD EVANT ISD EVERMAN ISD EVOLUTION ACADEMY CHARTER SCHO EXCEL ACADEMY EXCELSIOR ISD
Legislative Budget Board - Model 887
County District Number
County Name
068901 074905 108903 048901 227803 015905 234903 108904 120901 061802 057833 123805 241903 071804 071902 071805 243902 011902 001903 102906 024801 070903 049906 072802 174910 030906 107905 121906 050901 220904 057834 101811 210906
ECTOR FANNIN HIDALGO CONCHO TRAVIS BEXAR VAN ZANDT HIDALGO JACKSON DENTON DALLAS JEFFERSON WHARTON EL PASO EL PASO EL PASO WICHITA BASTROP ANDERSON HARRISON BROOKS ELLIS COOKE ERATH NACOGDOCHES CALLAHAN HENDERSON JASPER CORYELL TARRANT DALLAS HARRIS SHELBY
HB3646 WADA
33,187 405 7,112 485 320 14,979 1,406 45,549 1,954 1,750 403 262 4,490 632 77,188 187 709 5,081 1,718 1,413 31 7,306 707 258 184 584 1,905 657 358 6,773 447 865 190
Current Law (SB 1 821CS) - FY13
Total M&O Revenue
$167,680,685 $2,261,661 $36,980,269 $2,530,113 $1,710,760 $85,478,369 $7,038,517 $240,974,518 $11,025,190 $9,170,378 $2,086,985 $1,381,205 $25,541,312 $3,341,353 $404,519,408 $962,309 $3,851,293 $26,391,060 $9,372,099 $7,979,959 $165,546 $38,463,895 $3,706,876 $1,363,621 $941,782 $3,174,493 $9,117,179 $3,695,921 $1,851,027 $34,978,565 $2,449,606 $4,615,989 $1,029,936
Fiscal Year: 2013
HB 3646 - FY13
FY13
Total M&O Revenue
Change in Total M&O Revenue
$182,554,461 $2,292,123 $37,502,538 $2,768,838 $1,871,040 $86,683,294 $7,648,266 $245,119,344 $12,077,449 $10,029,903 $2,285,279 $1,509,979 $27,853,066 $3,642,666 $420,806,331 $1,051,204 $4,162,128 $26,844,444 $9,729,118 $8,716,753 $181,133 $39,849,658 $3,860,553 $1,481,999 $957,693 $3,382,806 $9,817,856 $3,910,958 $2,020,381 $35,485,923 $2,671,020 $5,019,078 $1,108,384
($14,873,775) ($30,462) ($522,270) ($238,725) ($160,280) ($1,204,925) ($609,748) ($4,144,826) ($1,052,258) ($859,525) ($198,294) ($128,774) ($2,311,753) ($301,314) ($16,286,923) ($88,895) ($310,835) ($453,384) ($357,020) ($736,794) ($15,587) ($1,385,763) ($153,677) ($118,378) ($15,911) ($208,313) ($700,678) ($215,036) ($169,354) ($507,358) ($221,414) ($403,089) ($78,447)
Current Law (SB 1 HB 3646 - FY13 821CS) FY13 Total M&O Revenue per HB 3646 WADA $5,053 $5,585 $5,200 $5,213 $5,351 $5,707 $5,006 $5,290 $5,643 $5,240 $5,173 $5,263 $5,689 $5,285 $5,241 $5,154 $5,434 $5,194 $5,457 $5,648 $5,360 $5,265 $5,243 $5,289 $5,113 $5,433 $4,785 $5,622 $5,167 $5,165 $5,479 $5,335 $5,433
FY13
Change in Total Total M&O M&O Revenue Revenue per HB per HB3646 3646 WADA WADA $5,501 $5,660 $5,273 $5,704 $5,852 $5,787 $5,440 $5,381 $6,181 $5,731 $5,664 $5,754 $6,204 $5,762 $5,452 $5,631 $5,872 $5,283 $5,665 $6,169 $5,864 $5,454 $5,461 $5,748 $5,199 $5,789 $5,152 $5,949 $5,640 $5,240 $5,975 $5,801 $5,847
($448) ($75) ($73) ($492) ($501) ($80) ($434) ($91) ($539) ($491) ($491) ($491) ($515) ($477) ($211) ($476) ($439) ($89) ($208) ($521) ($505) ($190) ($217) ($459) ($86) ($357) ($368) ($327) ($473) ($75) ($495) ($466) ($414)
Page 11 of 38
Comparison of Total M&O Revenue for School Districts and Charter Schools - LBB Model 887 FISCAL YEAR 2013 Note: All figures below are estimates and are subject to change based on actual and final student counts, property values, and tax effort. Amounts reflect available statewide estimates and may differ from local projections. M&O revenue amounts below are based on district entitlement for a full year, and do not reflect a payment deferral or any other actual or potential change to the distribution schedule of that entitlement.
Fiscal Year 2013 District Name
EZZELL ISD FABENS ISD FAIRFIELD ISD FAITH FAMILY ACADEMY OF OAK CL FALLS CITY ISD FANNINDEL ISD FARMERSVILLE ISD FARWELL ISD FAYETTEVILLE ISD FERRIS ISD FLATONIA ISD FLORENCE ISD FLORESVILLE ISD FLOUR BLUFF ISD FLOYDADA ISD FOCUS LEARNING ACADEMY FOLLETT ISD FORESTBURG ISD FORNEY ISD FORSAN ISD FORT BEND ISD FORT ELLIOTT CISD FORT STOCKTON ISD FORT WORTH ACADEMY OF FINE ART FORT WORTH CAN ACADEMY FORT WORTH ISD FRANKLIN ISD FRANKSTON ISD FREDERICKSBURG ISD FREER ISD FRENSHIP ISD FRIENDSWOOD ISD FRIONA ISD
Legislative Budget Board - Model 887
County District Number
County Name
143906 071903 081902 057815 128904 060914 043904 185902 075906 070905 075901 246902 247901 178914 077901 057817 148902 169910 129902 114904 079907 242906 186902 220809 220804 220905 198903 001904 086901 066903 152907 084911 185903
LAVACA EL PASO FREESTONE DALLAS KARNES DELTA COLLIN PARMER FAYETTE ELLIS FAYETTE WILLIAMSON WILSON NUECES FLOYD DALLAS LIPSCOMB MONTAGUE KAUFMAN HOWARD FORT BEND WHEELER PECOS TARRANT TARRANT TARRANT ROBERTSON ANDERSON GILLESPIE DUVAL LUBBOCK GALVESTON PARMER
HB3646 WADA
120 3,491 2,312 1,933 498 341 1,862 849 338 3,388 820 1,442 4,856 6,480 1,278 1,047 264 328 10,018 969 84,007 287 3,164 668 838 100,045 1,511 1,170 3,691 1,295 9,528 6,776 823
Current Law (SB 1 821CS) - FY13
Total M&O Revenue
$603,148 $18,343,506 $14,769,128 $10,240,434 $2,547,200 $1,932,678 $10,376,715 $4,241,634 $1,907,081 $17,589,724 $4,526,036 $7,516,912 $24,834,628 $34,249,204 $7,261,617 $5,442,771 $1,971,001 $1,709,867 $52,480,876 $5,661,882 $443,079,915 $3,266,256 $20,237,755 $3,488,050 $4,418,942 $529,661,151 $14,038,834 $5,745,980 $22,450,079 $6,794,423 $49,803,568 $35,814,675 $4,423,286
Fiscal Year: 2013
HB 3646 - FY13
FY13
Total M&O Revenue
Change in Total M&O Revenue
$658,852 $18,589,751 $16,083,005 $11,176,109 $2,632,413 $1,985,400 $10,899,754 $4,517,542 $2,092,818 $17,960,940 $4,916,813 $8,177,597 $26,469,415 $37,494,975 $7,359,463 $5,932,657 $2,154,376 $1,799,691 $57,407,916 $6,208,888 $460,956,799 $3,495,431 $22,183,682 $3,824,234 $4,769,225 $539,239,786 $15,243,200 $6,274,391 $24,503,439 $7,438,339 $54,384,308 $37,733,266 $4,767,893
($55,705) ($246,245) ($1,313,877) ($935,675) ($85,213) ($52,723) ($523,038) ($275,907) ($185,737) ($371,216) ($390,777) ($660,685) ($1,634,787) ($3,245,771) ($97,847) ($489,886) ($183,375) ($89,824) ($4,927,039) ($547,006) ($17,876,884) ($229,175) ($1,945,926) ($336,184) ($350,283) ($9,578,635) ($1,204,366) ($528,411) ($2,053,360) ($643,916) ($4,580,741) ($1,918,591) ($344,608)
Current Law (SB 1 HB 3646 - FY13 821CS) FY13 Total M&O Revenue per HB 3646 WADA $5,012 $5,255 $6,389 $5,297 $5,115 $5,669 $5,572 $4,995 $5,650 $5,192 $5,522 $5,213 $5,114 $5,286 $5,682 $5,201 $7,467 $5,206 $5,239 $5,842 $5,274 $11,365 $6,396 $5,223 $5,276 $5,294 $9,291 $4,910 $6,082 $5,248 $5,227 $5,285 $5,377
FY13
Change in Total Total M&O M&O Revenue Revenue per HB per HB3646 3646 WADA WADA $5,475 $5,326 $6,958 $5,781 $5,286 $5,824 $5,853 $5,320 $6,200 $5,301 $5,999 $5,671 $5,451 $5,786 $5,759 $5,669 $8,162 $5,479 $5,730 $6,407 $5,487 $12,162 $7,011 $5,726 $5,694 $5,390 $10,089 $5,361 $6,638 $5,745 $5,708 $5,568 $5,796
($463) ($71) ($568) ($484) ($171) ($155) ($281) ($325) ($550) ($110) ($477) ($458) ($337) ($501) ($77) ($468) ($695) ($273) ($492) ($564) ($213) ($797) ($615) ($503) ($418) ($96) ($797) ($452) ($556) ($497) ($481) ($283) ($419)
Page 12 of 38
Comparison of Total M&O Revenue for School Districts and Charter Schools - LBB Model 887 FISCAL YEAR 2013 Note: All figures below are estimates and are subject to change based on actual and final student counts, property values, and tax effort. Amounts reflect available statewide estimates and may differ from local projections. M&O revenue amounts below are based on district entitlement for a full year, and do not reflect a payment deferral or any other actual or potential change to the distribution schedule of that entitlement.
Fiscal Year 2013 District Name
FRISCO ISD FROST ISD FRUIT OF EXCELLENCE FRUITVALE ISD FT DAVIS ISD FT HANCOCK ISD FT SAM HOUSTON ISD GABRIEL TAFOLLA ACADEMY GAINESVILLE ISD GALENA PARK ISD GALVESTON ISD GANADO ISD GARLAND ISD GARNER ISD GARRISON ISD GARY ISD GATESVILLE ISD GATEWAY (STUDENT ALTERNATIVE P GATEWAY CHARTER ACADEMY GAUSE ISD GEORGE GERVIN ACADEMY GEORGE I SANCHEZ CHARTER GEORGE I SANCHEZ CHARTER HS SA GEORGE WEST ISD GEORGETOWN ISD GHOLSON ISD GIDDINGS ISD GILMER ISD GIRLS & BOYS PREP ACADEMY GLADEWATER ISD GLASSCOCK COUNTY ISD GLEN ROSE ISD GODLEY ISD
Legislative Budget Board - Model 887
County District Number
County Name
043905 175905 227812 234909 122901 115901 015914 232801 049901 101910 084902 120902 057909 184911 174903 183904 050902 240801 057831 166902 015802 101804 015812 149901 246904 161925 144901 230902 101805 092901 087901 213901 126911
COLLIN NAVARRO TRAVIS VAN ZANDT JEFF DAVIS HUDSPETH BEXAR UVALDE COOKE HARRIS GALVESTON JACKSON DALLAS PARKER NACOGDOCHES PANOLA CORYELL WEBB DALLAS MILAM BEXAR HARRIS BEXAR LIVE OAK WILLIAMSON MCLENNAN LEE UPSHUR HARRIS GREGG GLASSCOCK SOMERVELL JOHNSON
HB3646 WADA
49,190 554 37 687 553 917 1,834 128 3,267 27,966 8,367 971 72,054 335 1,047 639 3,617 1,113 1,478 262 1,273 1,007 167 1,587 12,318 250 2,495 3,037 937 2,596 488 2,145 2,180
Current Law (SB 1 821CS) - FY13
Total M&O Revenue
$287,339,440 $3,057,794 $246,045 $3,646,745 $3,207,786 $4,539,979 $8,969,894 $667,701 $17,034,003 $158,359,751 $48,134,032 $5,023,109 $381,801,041 $1,851,201 $6,364,393 $4,043,987 $18,491,185 $5,864,704 $7,843,897 $1,402,954 $6,772,478 $5,338,418 $883,644 $8,208,225 $72,129,189 $1,299,601 $13,053,263 $16,181,111 $4,937,568 $13,749,653 $3,399,358 $17,474,654 $14,802,907
Fiscal Year: 2013
HB 3646 - FY13
FY13
Total M&O Revenue
Change in Total M&O Revenue
$314,256,970 $3,183,721 $259,854 $3,720,712 $3,504,233 $4,938,510 $9,109,888 $728,048 $17,275,192 $160,489,488 $52,690,723 $5,136,201 $389,890,728 $2,030,372 $6,949,969 $4,402,612 $20,176,826 $6,375,124 $8,570,550 $1,536,789 $7,404,561 $5,819,788 $960,810 $8,764,674 $79,062,616 $1,419,462 $13,989,333 $17,675,140 $5,392,960 $14,918,967 $3,686,282 $19,002,527 $16,179,187
($26,917,530) ($125,927) ($13,809) ($73,967) ($296,447) ($398,531) ($139,994) ($60,347) ($241,190) ($2,129,737) ($4,556,691) ($113,091) ($8,089,687) ($179,171) ($585,576) ($358,625) ($1,685,641) ($510,421) ($726,653) ($133,835) ($632,084) ($481,370) ($77,166) ($556,449) ($6,933,427) ($119,861) ($936,070) ($1,494,029) ($455,392) ($1,169,314) ($286,924) ($1,527,873) ($1,376,280)
Current Law (SB 1 HB 3646 - FY13 821CS) FY13 Total M&O Revenue per HB 3646 WADA $5,841 $5,519 $6,577 $5,307 $5,801 $4,950 $4,892 $5,233 $5,214 $5,663 $5,753 $5,175 $5,299 $5,521 $6,080 $6,326 $5,112 $5,269 $5,309 $5,350 $5,319 $5,301 $5,284 $5,173 $5,856 $5,203 $5,233 $5,329 $5,271 $5,296 $6,966 $8,148 $6,789
FY13
Change in Total Total M&O M&O Revenue Revenue per HB per HB3646 3646 WADA WADA $6,389 $5,746 $6,946 $5,415 $6,337 $5,385 $4,968 $5,706 $5,288 $5,739 $6,297 $5,292 $5,411 $6,055 $6,639 $6,887 $5,579 $5,727 $5,800 $5,860 $5,815 $5,779 $5,745 $5,524 $6,419 $5,683 $5,608 $5,821 $5,757 $5,746 $7,554 $8,860 $7,420
($547) ($227) ($369) ($108) ($536) ($435) ($76) ($473) ($74) ($76) ($545) ($117) ($112) ($534) ($559) ($561) ($466) ($459) ($492) ($510) ($496) ($478) ($461) ($351) ($563) ($480) ($375) ($492) ($486) ($450) ($588) ($712) ($631)
Page 13 of 38
Comparison of Total M&O Revenue for School Districts and Charter Schools - LBB Model 887 FISCAL YEAR 2013 Note: All figures below are estimates and are subject to change based on actual and final student counts, property values, and tax effort. Amounts reflect available statewide estimates and may differ from local projections. M&O revenue amounts below are based on district entitlement for a full year, and do not reflect a payment deferral or any other actual or potential change to the distribution schedule of that entitlement.
Fiscal Year 2013 District Name
GOLD BURG ISD GOLDEN RULE CHARTER SCHOOL GOLDTHWAITE ISD GOLIAD ISD GONZALES ISD GOODRICH ISD GOOSE CREEK CISD GORDON ISD GORMAN ISD GRADY ISD GRAFORD ISD GRAHAM ISD GRANBURY ISD GRAND PRAIRIE ISD GRAND SALINE ISD GRANDFALLS-ROYALTY ISD GRANDVIEW ISD GRANDVIEW-HOPKINS ISD GRANGER ISD GRAPE CREEK ISD GRAPELAND ISD GRAPEVINE-COLLEYVILLE ISD GREENVILLE ISD GREENWOOD ISD GREGORY-PORTLAND ISD GROESBECK ISD GROOM ISD GROVETON ISD GRUVER ISD GUARDIAN ANGEL PERFORMANCE ART GUNTER ISD GUSTINE ISD GUTHRIE CSD
Legislative Budget Board - Model 887
County District Number
County Name
169906 057835 167901 088902 089901 187903 101911 182901 067904 156905 182902 252901 111901 057910 234904 238904 126904 090905 246905 226907 113902 220906 116905 165902 205902 147902 033901 228901 098901 015813 091917 047903 135001
MONTAGUE DALLAS MILLS GOLIAD GONZALES POLK HARRIS PALO PINTO EASTLAND MARTIN PALO PINTO YOUNG HOOD DALLAS VAN ZANDT WARD JOHNSON GRAY WILLIAMSON TOM GREEN HOUSTON TARRANT HUNT MIDLAND SAN PATRICIO LIMESTONE CARSON TRINITY HANSFORD BEXAR GRAYSON COMANCHE KING
HB3646 WADA
242 1,657 866 1,966 3,281 398 26,620 345 569 314 497 3,138 7,893 33,225 1,517 246 1,522 91 653 1,501 730 15,305 6,076 2,117 4,943 2,058 221 1,241 754 10 1,218 362 268
Current Law (SB 1 821CS) - FY13
Total M&O Revenue
$1,262,247 $8,524,647 $4,289,591 $13,141,636 $17,442,228 $1,976,524 $147,367,582 $2,006,684 $2,891,966 $2,645,258 $3,215,977 $16,335,274 $47,896,339 $174,404,496 $8,554,718 $1,657,988 $8,048,105 $882,469 $3,396,193 $8,453,711 $3,976,177 $84,828,856 $31,115,080 $12,136,288 $26,736,082 $12,823,900 $1,218,112 $6,365,605 $5,217,366 $51,095 $7,072,784 $1,864,235 $3,163,565
Fiscal Year: 2013
HB 3646 - FY13
FY13
Total M&O Revenue
Change in Total M&O Revenue
$1,333,113 $9,312,972 $4,655,712 $14,365,516 $18,988,512 $2,131,555 $161,372,235 $2,194,765 $2,991,160 $2,857,040 $3,488,774 $17,359,746 $52,335,102 $176,976,007 $9,348,619 $1,816,870 $8,818,084 $964,625 $3,480,439 $8,604,457 $4,338,170 $92,794,589 $31,909,158 $13,236,808 $28,332,173 $14,084,603 $1,335,875 $6,454,936 $5,713,167 $55,735 $7,656,568 $1,925,155 $3,469,035
($70,866) ($788,325) ($366,121) ($1,223,880) ($1,546,284) ($155,031) ($14,004,653) ($188,081) ($99,194) ($211,783) ($272,797) ($1,024,472) ($4,438,762) ($2,571,511) ($793,900) ($158,881) ($769,979) ($82,157) ($84,246) ($150,746) ($361,992) ($7,965,733) ($794,078) ($1,100,520) ($1,596,090) ($1,260,703) ($117,762) ($89,331) ($495,800) ($4,640) ($583,784) ($60,919) ($305,471)
Current Law (SB 1 HB 3646 - FY13 821CS) FY13 Total M&O Revenue per HB 3646 WADA $5,218 $5,144 $4,951 $6,684 $5,316 $4,960 $5,536 $5,815 $5,083 $8,422 $6,473 $5,206 $6,068 $5,249 $5,639 $6,738 $5,287 $9,742 $5,199 $5,630 $5,446 $5,542 $5,121 $5,731 $5,409 $6,232 $5,502 $5,131 $6,921 $5,092 $5,809 $5,145 $11,793
FY13
Change in Total Total M&O M&O Revenue Revenue per HB per HB3646 3646 WADA WADA $5,511 $5,620 $5,373 $7,306 $5,787 $5,349 $6,062 $6,360 $5,257 $9,096 $7,022 $5,532 $6,631 $5,327 $6,162 $7,384 $5,792 $10,649 $5,328 $5,731 $5,942 $6,063 $5,252 $6,251 $5,732 $6,845 $6,034 $5,203 $7,578 $5,554 $6,289 $5,313 $12,932
($293) ($476) ($423) ($622) ($471) ($389) ($526) ($545) ($174) ($674) ($549) ($326) ($562) ($77) ($523) ($646) ($506) ($907) ($129) ($100) ($496) ($520) ($131) ($520) ($323) ($613) ($532) ($72) ($658) ($462) ($479) ($168) ($1,139)
Page 14 of 38
Comparison of Total M&O Revenue for School Districts and Charter Schools - LBB Model 887 FISCAL YEAR 2013 Note: All figures below are estimates and are subject to change based on actual and final student counts, property values, and tax effort. Amounts reflect available statewide estimates and may differ from local projections. M&O revenue amounts below are based on district entitlement for a full year, and do not reflect a payment deferral or any other actual or potential change to the distribution schedule of that entitlement.
Fiscal Year 2013 District Name
HALE CENTER ISD HALLETTSVILLE ISD HALLSBURG ISD HALLSVILLE ISD HAMILTON ISD HAMLIN ISD HAMPTON PREPARATORY HAMSHIRE-FANNETT ISD HAPPY ISD HARDIN ISD HARDIN-JEFFERSON ISD HARLANDALE ISD HARLETON ISD HARLINGEN CONS ISD HARMONY ISD HARMONY SCHOOL OF EXCELLENCE HARMONY SCHOOL OF SCIENCE - HO HARMONY SCIENCE ACAD (EL PASO) HARMONY SCIENCE ACAD (FORT WOR HARMONY SCIENCE ACAD (LUBBOCK) HARMONY SCIENCE ACAD (SAN ANTO HARMONY SCIENCE ACAD (WACO) HARMONY SCIENCE ACADEMY HARMONY SCIENCE ACADEMY - BROW HARMONY SCIENCE ACADEMY - LARE HARMONY SCIENCE ACADEMY (AUSTI HARPER ISD HARROLD ISD HART ISD HARTLEY ISD HARTS BLUFF ISD HASKELL CISD HAWKINS ISD
Legislative Budget Board - Model 887
County District Number
County Name
095903 143901 161924 102904 097902 127903 057843 123914 219901 146904 100905 015904 102905 031903 230905 101858 101862 071806 220813 152805 015828 161807 101846 031803 240804 227816 086902 244901 035902 103902 225907 104901 250902
HALE LAVACA MCLENNAN HARRISON HAMILTON JONES DALLAS JEFFERSON SWISHER LIBERTY HARDIN BEXAR HARRISON CAMERON UPSHUR HARRIS HARRIS EL PASO TARRANT LUBBOCK BEXAR MCLENNAN HARRIS CAMERON WEBB TRAVIS GILLESPIE WILBARGER CASTRO HARTLEY TITUS HASKELL WOOD
HB3646 WADA
1,016 1,397 148 5,859 1,294 773 680 2,180 437 1,613 2,516 18,233 1,119 24,128 1,512 1,686 799 1,405 2,408 493 1,003 572 7,421 509 750 3,556 1,027 151 473 431 671 1,111 1,117
Current Law (SB 1 821CS) - FY13
Total M&O Revenue
$5,167,336 $8,152,799 $798,169 $34,733,314 $6,605,362 $4,291,106 $3,548,313 $12,595,782 $2,221,887 $8,698,652 $13,846,792 $103,427,628 $5,870,906 $127,775,060 $8,064,530 $8,719,945 $4,115,201 $7,253,201 $12,438,968 $2,561,954 $5,200,033 $2,969,769 $38,755,594 $2,627,324 $3,869,752 $18,457,993 $5,446,966 $867,386 $2,435,289 $2,193,172 $3,525,073 $6,121,293 $6,619,383
Fiscal Year: 2013
HB 3646 - FY13
FY13
Total M&O Revenue
Change in Total M&O Revenue
$5,235,239 $8,903,662 $875,994 $38,047,549 $6,962,263 $4,352,628 $3,881,547 $13,170,683 $2,389,733 $9,520,007 $15,177,775 $104,904,514 $6,381,926 $130,384,577 $8,739,488 $9,560,144 $4,511,014 $7,943,791 $13,633,315 $2,803,246 $5,691,934 $3,251,017 $42,443,247 $2,876,707 $4,241,003 $20,222,212 $5,936,985 $949,576 $2,517,459 $2,396,583 $3,852,584 $6,212,178 $7,200,073
($67,903) ($750,863) ($77,825) ($3,314,235) ($356,901) ($61,522) ($333,234) ($574,901) ($167,845) ($821,355) ($1,330,983) ($1,476,886) ($511,020) ($2,609,517) ($674,958) ($840,199) ($395,813) ($690,590) ($1,194,347) ($241,291) ($491,901) ($281,247) ($3,687,653) ($249,383) ($371,251) ($1,764,219) ($490,019) ($82,190) ($82,171) ($203,411) ($327,511) ($90,885) ($580,691)
Current Law (SB 1 HB 3646 - FY13 821CS) FY13 Total M&O Revenue per HB 3646 WADA $5,086 $5,836 $5,392 $5,928 $5,104 $5,554 $5,218 $5,777 $5,083 $5,394 $5,504 $5,672 $5,247 $5,296 $5,335 $5,173 $5,151 $5,164 $5,165 $5,192 $5,186 $5,190 $5,223 $5,165 $5,159 $5,191 $5,302 $5,753 $5,146 $5,088 $5,252 $5,508 $5,926
FY13
Change in Total Total M&O M&O Revenue Revenue per HB per HB3646 3646 WADA WADA $5,152 $6,373 $5,918 $6,494 $5,380 $5,633 $5,708 $6,040 $5,467 $5,903 $6,033 $5,753 $5,704 $5,404 $5,781 $5,672 $5,646 $5,655 $5,661 $5,681 $5,677 $5,681 $5,719 $5,655 $5,654 $5,687 $5,779 $6,299 $5,320 $5,560 $5,739 $5,590 $6,446
($67) ($537) ($526) ($566) ($276) ($80) ($490) ($264) ($384) ($509) ($529) ($81) ($457) ($108) ($446) ($498) ($495) ($492) ($496) ($489) ($491) ($491) ($497) ($490) ($495) ($496) ($477) ($545) ($174) ($472) ($488) ($82) ($520)
Page 15 of 38
Comparison of Total M&O Revenue for School Districts and Charter Schools - LBB Model 887 FISCAL YEAR 2013 Note: All figures below are estimates and are subject to change based on actual and final student counts, property values, and tax effort. Amounts reflect available statewide estimates and may differ from local projections. M&O revenue amounts below are based on district entitlement for a full year, and do not reflect a payment deferral or any other actual or potential change to the distribution schedule of that entitlement.
Fiscal Year 2013 District Name
HAWLEY ISD HAYS CONS ISD HEARNE ISD HEDLEY ISD HEMPHILL ISD HEMPSTEAD ISD HENDERSON ISD HENRIETTA ISD HENRY FORD ACADEMY SAN ANTONIO HEREFORD ISD HERMLEIGH ISD HICO ISD HIDALGO ISD HIGGINS ISD HIGGS CARTER KING GIFTED & TAL HIGH ISLAND ISD HIGHLAND ISD HIGHLAND PARK ISD (Dallas) HIGHLAND PARK ISD (Potter) HILLSBORO ISD HITCHCOCK ISD HOLLAND ISD HOLLIDAY ISD HONDO ISD HONEY GROVE ISD HONORS ACADEMY HOOKS ISD HOUSTON ALTERNATIVE PREPARATOR HOUSTON CAN ACADEMY CHARTER SC HOUSTON GATEWAY ACADEMY INC HOUSTON HEIGHTS HIGH SCHOOL HOUSTON HEIGHTS LEARNING ACADE HOUSTON ISD
Legislative Budget Board - Model 887
County District Number
County Name
127904 105906 198905 065902 202903 237902 201902 039902 015833 059901 208901 097903 108905 148903 015803 084903 177905 057911 188903 109904 084908 014905 005902 163904 074907 057825 019902 101851 101812 101828 101821 101829 101912
JONES HAYS ROBERTSON DONLEY SABINE WALLER RUSK CLAY BEXAR DEAF SMITH SCURRY HAMILTON HIDALGO LIPSCOMB BEXAR GALVESTON NOLAN DALLAS POTTER HILL GALVESTON BELL ARCHER MEDINA FANNIN DALLAS BOWIE HARRIS HARRIS HARRIS HARRIS HARRIS HARRIS
HB3646 WADA
1,133 20,410 1,485 281 1,491 2,174 4,219 1,336 109 5,621 409 874 4,763 145 1,001 276 351 7,350 1,388 2,705 1,830 863 1,237 2,903 893 1,668 1,393 308 1,028 1,468 301 174 259,008
Current Law (SB 1 821CS) - FY13
Total M&O Revenue
$6,279,548 $113,939,305 $7,554,855 $1,431,277 $7,579,937 $11,081,572 $23,021,565 $6,851,287 $574,371 $28,560,300 $2,318,310 $5,028,840 $27,575,306 $1,142,349 $5,275,588 $1,673,413 $2,277,817 $44,709,274 $7,989,612 $15,000,317 $9,599,937 $4,383,766 $6,333,446 $14,919,292 $4,585,534 $9,242,973 $7,641,070 $1,640,060 $5,431,631 $7,572,903 $1,628,996 $907,535 $1,339,048,386
Fiscal Year: 2013
HB 3646 - FY13
FY13
Total M&O Revenue
Change in Total M&O Revenue
$6,370,870 $124,788,924 $8,033,359 $1,559,094 $8,027,202 $11,459,652 $25,215,290 $7,201,294 $619,030 $28,952,160 $2,535,491 $5,455,341 $27,950,079 $1,241,898 $5,768,291 $1,822,127 $2,473,855 $48,833,141 $8,718,264 $15,206,296 $10,454,485 $4,680,893 $6,663,767 $15,234,876 $4,789,769 $10,093,068 $8,328,674 $1,788,853 $5,926,588 $8,275,257 $1,775,616 $991,465 $1,465,980,046
($91,323) ($10,849,619) ($478,504) ($127,817) ($447,265) ($378,080) ($2,193,724) ($350,007) ($44,659) ($391,860) ($217,181) ($426,500) ($374,774) ($99,549) ($492,702) ($148,714) ($196,039) ($4,123,868) ($728,652) ($205,979) ($854,548) ($297,127) ($330,321) ($315,584) ($204,235) ($850,095) ($687,604) ($148,792) ($494,957) ($702,354) ($146,621) ($83,930) ($126,931,660)
Current Law (SB 1 HB 3646 - FY13 821CS) FY13 Total M&O Revenue per HB 3646 WADA $5,541 $5,582 $5,087 $5,086 $5,082 $5,097 $5,457 $5,127 $5,279 $5,081 $5,666 $5,751 $5,789 $7,869 $5,268 $6,070 $6,483 $6,083 $5,758 $5,546 $5,245 $5,078 $5,120 $5,139 $5,137 $5,542 $5,485 $5,332 $5,286 $5,158 $5,404 $5,216 $5,170
FY13
Change in Total Total M&O M&O Revenue Revenue per HB per HB3646 3646 WADA WADA $5,621 $6,114 $5,410 $5,540 $5,382 $5,271 $5,977 $5,389 $5,689 $5,150 $6,197 $6,239 $5,868 $8,555 $5,760 $6,609 $7,041 $6,644 $6,283 $5,622 $5,712 $5,422 $5,387 $5,247 $5,366 $6,052 $5,979 $5,816 $5,767 $5,637 $5,890 $5,698 $5,660
($81) ($532) ($322) ($454) ($300) ($174) ($520) ($262) ($410) ($70) ($531) ($488) ($79) ($686) ($492) ($539) ($558) ($561) ($525) ($76) ($467) ($344) ($267) ($109) ($229) ($510) ($494) ($484) ($482) ($478) ($486) ($482) ($490)
Page 16 of 38
Comparison of Total M&O Revenue for School Districts and Charter Schools - LBB Model 887 FISCAL YEAR 2013 Note: All figures below are estimates and are subject to change based on actual and final student counts, property values, and tax effort. Amounts reflect available statewide estimates and may differ from local projections. M&O revenue amounts below are based on district entitlement for a full year, and do not reflect a payment deferral or any other actual or potential change to the distribution schedule of that entitlement.
Fiscal Year 2013 District Name
HOWE ISD HUBBARD ISD (Bowie) HUBBARD ISD (Hill) HUCKABAY ISD HUDSON ISD HUFFMAN ISD HUGHES SPRINGS ISD HULL-DAISETTA ISD HUMBLE ISD HUNT ISD HUNTINGTON ISD HUNTSVILLE ISD HURST-EULESS-BEDFORD ISD HUTTO ISD IDALOU ISD IDEA PUBLIC SCHOOLS INDUSTRIAL ISD INGLESIDE ISD INGRAM ISD INSPIRED VISION ACADEMY IOLA ISD IOWA PARK CONS ISD IRA ISD IRAAN-SHEFFIELD ISD IREDELL ISD IRION COUNTY ISD IRVING ISD ITALY ISD ITASCA ISD JACKSBORO ISD JACKSONVILLE ISD JAMIE'S HOUSE CHARTER SCHOOL JARRELL ISD
Legislative Budget Board - Model 887
County District Number
County Name
091905 019913 109905 072908 003902 101925 034903 146905 101913 133902 003904 236902 220916 246906 152910 108807 120905 205903 133904 057830 093903 243903 208903 186903 018906 118902 057912 070907 109907 119902 037904 101822 246907
GRAYSON BOWIE HILL ERATH ANGELINA HARRIS CASS LIBERTY HARRIS KERR ANGELINA WALKER TARRANT WILLIAMSON LUBBOCK HIDALGO JACKSON SAN PATRICIO KERR DALLAS GRIMES WICHITA SCURRY PECOS BOSQUE IRION DALLAS ELLIS HILL JACK CHEROKEE HARRIS WILLIAMSON
HB3646 WADA
1,482 213 576 303 3,366 3,882 1,522 752 44,019 248 2,221 7,485 27,414 7,165 1,343 12,946 1,612 2,547 1,321 2,105 751 2,236 442 1,264 235 555 43,282 967 1,164 1,467 6,394 346 1,443
Current Law (SB 1 821CS) - FY13
Total M&O Revenue
$7,710,004 $1,086,243 $3,286,415 $1,608,905 $18,594,368 $20,527,692 $8,985,665 $4,444,764 $254,505,763 $1,742,784 $12,037,694 $39,566,331 $145,538,276 $37,875,808 $7,261,136 $67,198,041 $8,537,304 $12,912,110 $6,694,672 $11,047,574 $3,851,072 $11,527,792 $2,824,181 $9,285,128 $1,205,346 $3,689,412 $226,764,751 $5,374,260 $6,647,808 $9,339,420 $33,261,681 $1,881,255 $9,074,125
Fiscal Year: 2013
HB 3646 - FY13
FY13
Total M&O Revenue
Change in Total M&O Revenue
$7,821,364 $1,111,972 $3,597,255 $1,763,313 $19,471,321 $21,032,954 $9,796,547 $4,837,301 $259,415,271 $1,902,876 $12,211,849 $40,572,700 $159,199,601 $41,501,352 $7,664,602 $73,124,183 $9,358,336 $14,145,550 $7,093,077 $12,081,879 $4,201,914 $11,980,759 $3,098,302 $10,104,106 $1,275,119 $4,031,906 $230,031,366 $5,453,681 $6,736,036 $10,229,573 $34,090,799 $2,039,445 $9,950,947
($111,361) ($25,729) ($310,840) ($154,408) ($876,953) ($505,261) ($810,882) ($392,537) ($4,909,508) ($160,092) ($174,155) ($1,006,369) ($13,661,325) ($3,625,544) ($403,466) ($5,926,142) ($821,032) ($1,233,440) ($398,406) ($1,034,305) ($350,843) ($452,967) ($274,120) ($818,979) ($69,774) ($342,494) ($3,266,615) ($79,421) ($88,228) ($890,153) ($829,118) ($158,190) ($876,822)
Current Law (SB 1 HB 3646 - FY13 821CS) FY13 Total M&O Revenue per HB 3646 WADA $5,204 $5,106 $5,708 $5,314 $5,524 $5,287 $5,903 $5,911 $5,782 $7,040 $5,421 $5,286 $5,309 $5,286 $5,405 $5,191 $5,295 $5,069 $5,066 $5,248 $5,128 $5,156 $6,384 $7,346 $5,127 $6,653 $5,239 $5,558 $5,712 $6,365 $5,202 $5,433 $6,289
FY13
Change in Total Total M&O M&O Revenue Revenue per HB per HB3646 3646 WADA WADA $5,279 $5,227 $6,248 $5,824 $5,785 $5,417 $6,435 $6,433 $5,893 $7,687 $5,499 $5,421 $5,807 $5,792 $5,706 $5,648 $5,804 $5,554 $5,368 $5,739 $5,596 $5,358 $7,003 $7,994 $5,424 $7,271 $5,315 $5,640 $5,788 $6,971 $5,331 $5,890 $6,897
($75) ($121) ($540) ($510) ($261) ($130) ($533) ($522) ($112) ($647) ($78) ($134) ($498) ($506) ($300) ($458) ($509) ($484) ($302) ($491) ($467) ($203) ($620) ($648) ($297) ($618) ($75) ($82) ($76) ($607) ($130) ($457) ($608)
Page 17 of 38
Comparison of Total M&O Revenue for School Districts and Charter Schools - LBB Model 887 FISCAL YEAR 2013 Note: All figures below are estimates and are subject to change based on actual and final student counts, property values, and tax effort. Amounts reflect available statewide estimates and may differ from local projections. M&O revenue amounts below are based on district entitlement for a full year, and do not reflect a payment deferral or any other actual or potential change to the distribution schedule of that entitlement.
Fiscal Year 2013 District Name
JASPER ISD JAYTON-GIRARD ISD JEAN MASSIEU ACADEMY JEFFERSON ISD JIM HOGG COUNTY ISD JIM NED CONS ISD JOAQUIN ISD JOHN H WOOD JR PUBLIC CHARTER JOHNSON CITY ISD JONESBORO ISD JOSHUA ISD JOURDANTON ISD JUAN B GALAVIZ CHARTER SCHOOL JUBILEE ACADEMIC CENTER JUDSON ISD JUNCTION ISD KARNACK ISD KARNES CITY ISD KATHERINE ANNE PORTER SCHOOL KATY ISD KAUFMAN ISD KEENE ISD KELLER ISD KELTON ISD KEMP ISD KENEDY COUNTYWIDE CSD KENEDY ISD KENNARD ISD KENNEDALE ISD KERENS ISD KERMIT ISD KERRVILLE ISD KILGORE ISD
Legislative Budget Board - Model 887
County District Number
County Name
121904 132902 057819 155901 124901 221911 210902 015808 016901 050909 126905 007902 101852 015822 015916 134901 102901 128901 105801 101914 129903 126906 220907 242905 129904 131001 128902 113906 220914 175907 248901 133903 092902
JASPER KENT DALLAS MARION JIM HOGG TAYLOR SHELBY BEXAR BLANCO CORYELL JOHNSON ATASCOSA HARRIS BEXAR BEXAR KIMBLE HARRISON KARNES HAYS HARRIS KAUFMAN JOHNSON TARRANT WHEELER KAUFMAN KENEDY KARNES HOUSTON TARRANT NAVARRO WINKLER KERR GREGG
HB3646 WADA
3,721 296 114 1,747 1,702 1,500 1,128 1,047 1,181 232 5,865 1,737 91 1,431 28,432 1,104 267 1,449 198 76,191 4,946 1,315 40,555 377 2,088 160 1,012 608 4,021 1,005 1,782 5,816 4,744
Current Law (SB 1 821CS) - FY13
Total M&O Revenue
$20,589,891 $3,137,139 $688,348 $9,118,754 $8,739,685 $8,687,385 $5,996,970 $5,548,699 $6,793,534 $1,277,457 $33,318,334 $9,773,798 $493,950 $7,355,655 $149,153,935 $5,087,111 $1,522,169 $7,281,508 $1,111,845 $421,842,998 $28,260,065 $7,314,740 $213,319,004 $3,747,561 $11,437,834 $1,672,047 $5,225,725 $3,555,117 $22,587,817 $5,105,019 $10,224,312 $32,394,918 $23,768,035
Fiscal Year: 2013
HB 3646 - FY13
FY13
Total M&O Revenue
Change in Total M&O Revenue
$20,874,478 $3,406,581 $740,892 $9,924,318 $9,480,577 $9,505,356 $6,532,256 $6,016,172 $7,404,467 $1,335,615 $34,789,935 $10,401,407 $539,658 $8,002,561 $155,483,564 $5,551,405 $1,661,436 $7,807,064 $1,213,602 $446,889,556 $28,680,295 $7,418,154 $228,456,218 $4,082,592 $11,931,233 $1,776,441 $5,298,285 $3,871,027 $22,945,459 $5,553,726 $11,201,716 $35,491,436 $26,020,207
($284,587) ($269,442) ($52,544) ($805,564) ($740,893) ($817,971) ($535,286) ($467,473) ($610,933) ($58,158) ($1,471,601) ($627,609) ($45,708) ($646,906) ($6,329,629) ($464,293) ($139,268) ($525,556) ($101,757) ($25,046,557) ($420,230) ($103,414) ($15,137,214) ($335,031) ($493,399) ($104,394) ($72,560) ($315,910) ($357,642) ($448,706) ($977,404) ($3,096,519) ($2,252,173)
Current Law (SB 1 HB 3646 - FY13 821CS) FY13 Total M&O Revenue per HB 3646 WADA $5,534 $10,598 $6,051 $5,221 $5,136 $5,791 $5,315 $5,302 $5,754 $5,501 $5,681 $5,628 $5,447 $5,139 $5,246 $4,607 $5,704 $5,024 $5,607 $5,537 $5,714 $5,564 $5,260 $9,932 $5,478 $10,459 $5,161 $5,845 $5,617 $5,081 $5,737 $5,570 $5,010
FY13
Change in Total Total M&O M&O Revenue Revenue per HB per HB3646 3646 WADA WADA $5,610 $11,508 $6,513 $5,682 $5,571 $6,336 $5,789 $5,749 $6,272 $5,751 $5,931 $5,990 $5,951 $5,591 $5,469 $5,027 $6,226 $5,386 $6,120 $5,865 $5,799 $5,643 $5,633 $10,820 $5,714 $11,112 $5,233 $6,364 $5,706 $5,528 $6,286 $6,103 $5,485
($76) ($910) ($462) ($461) ($435) ($545) ($474) ($447) ($517) ($250) ($251) ($361) ($504) ($452) ($223) ($420) ($522) ($363) ($513) ($329) ($85) ($79) ($373) ($888) ($236) ($653) ($72) ($519) ($89) ($447) ($548) ($532) ($475)
Page 18 of 38
Comparison of Total M&O Revenue for School Districts and Charter Schools - LBB Model 887 FISCAL YEAR 2013 Note: All figures below are estimates and are subject to change based on actual and final student counts, property values, and tax effort. Amounts reflect available statewide estimates and may differ from local projections. M&O revenue amounts below are based on district entitlement for a full year, and do not reflect a payment deferral or any other actual or potential change to the distribution schedule of that entitlement.
Fiscal Year 2013 District Name
KILLEEN ISD KINGSVILLE ISD KIPP ASPIRE ACADEMY KIPP AUSTIN PUBLIC SCHOOLS INC KIPP INC CHARTER KIPP SOUTHEAST HOUSTON KIPP TRUTH ACADEMY KIRBYVILLE ISD KLEIN ISD KLONDIKE ISD KNIPPA ISD KNOX CITY-O'BRIEN ISD KOPPERL ISD KOUNTZE ISD KRESS ISD KRUM ISD LA ACADEMIA DE ESTRELLAS LA AMISTAD LOVE & LEARNING ACA LA ESCUELA DE LAS AMERICAS LA FE PREPARATORY SCHOOL LA FERIA ISD LA GLORIA ISD LA GRANGE ISD LA JOYA ISD LA MARQUE ISD LA PORTE ISD LA PRYOR ISD LA VEGA ISD LA VERNIA ISD LA VILLA ISD LACKLAND ISD LAGO VISTA ISD LAKE DALLAS ISD
Legislative Budget Board - Model 887
County District Number
County Name
014906 137901 015826 227820 101813 101860 057837 121905 101915 058905 232901 138902 018907 100903 219905 061905 057839 101833 015811 071807 031905 125906 075902 108912 084904 101916 254902 161906 247903 108914 015913 227912 061912
BELL KLEBERG BEXAR TRAVIS HARRIS HARRIS DALLAS JASPER HARRIS DAWSON UVALDE KNOX BOSQUE HARDIN SWISHER DENTON DALLAS HARRIS BEXAR EL PASO CAMERON JIM WELLS FAYETTE HIDALGO GALVESTON HARRIS ZAVALA MCLENNAN WILSON HIDALGO BEXAR TRAVIS DENTON
HB3646 WADA
48,566 4,726 1,232 1,653 9,450 1,166 563 2,025 55,252 433 316 472 394 1,772 344 2,373 568 462 64 208 4,814 173 2,483 38,387 3,983 9,290 952 3,770 4,002 992 1,375 1,559 5,085
Current Law (SB 1 821CS) - FY13
Total M&O Revenue
$248,191,443 $24,728,481 $6,343,311 $8,655,310 $49,230,032 $6,016,948 $2,911,054 $10,201,604 $293,878,495 $3,127,210 $1,583,426 $2,627,003 $2,010,336 $8,969,613 $1,925,029 $15,405,498 $2,899,346 $2,387,832 $327,905 $1,062,441 $24,782,945 $873,763 $14,361,918 $223,044,563 $21,005,624 $50,506,076 $5,313,598 $21,140,171 $20,877,856 $5,194,141 $6,704,243 $9,598,911 $29,328,632
Fiscal Year: 2013
HB 3646 - FY13
FY13
Total M&O Revenue
Change in Total M&O Revenue
$265,938,908 $25,460,314 $6,934,430 $9,464,993 $53,818,908 $6,583,454 $3,182,317 $10,345,976 $299,637,988 $3,414,255 $1,722,849 $2,663,316 $2,122,183 $9,268,501 $1,973,855 $16,897,240 $3,146,397 $2,610,015 $358,267 $1,152,041 $26,502,547 $933,336 $15,735,379 $226,222,404 $22,541,740 $55,308,989 $5,385,126 $21,630,515 $21,383,044 $5,264,181 $6,817,036 $10,512,176 $30,275,869
($17,747,465) ($731,833) ($591,119) ($809,683) ($4,588,876) ($566,506) ($271,263) ($144,372) ($5,759,493) ($287,046) ($139,424) ($36,314) ($111,847) ($298,888) ($48,827) ($1,491,742) ($247,051) ($222,182) ($30,362) ($89,600) ($1,719,602) ($59,573) ($1,373,461) ($3,177,842) ($1,536,116) ($4,802,914) ($71,528) ($490,343) ($505,188) ($70,040) ($112,792) ($913,265) ($947,236)
Current Law (SB 1 HB 3646 - FY13 821CS) FY13 Total M&O Revenue per HB 3646 WADA $5,110 $5,233 $5,148 $5,237 $5,209 $5,161 $5,174 $5,037 $5,319 $7,219 $5,018 $5,563 $5,105 $5,061 $5,589 $6,491 $5,109 $5,170 $5,128 $5,110 $5,148 $5,062 $5,783 $5,810 $5,274 $5,436 $5,583 $5,608 $5,217 $5,234 $4,875 $6,158 $5,768
FY13
Change in Total Total M&O M&O Revenue Revenue per HB per HB3646 3646 WADA WADA $5,476 $5,388 $5,628 $5,727 $5,695 $5,647 $5,656 $5,109 $5,423 $7,882 $5,460 $5,640 $5,389 $5,229 $5,730 $7,119 $5,544 $5,651 $5,603 $5,541 $5,505 $5,407 $6,336 $5,893 $5,659 $5,953 $5,659 $5,738 $5,344 $5,304 $4,957 $6,743 $5,954
($365) ($155) ($480) ($490) ($486) ($486) ($482) ($71) ($104) ($663) ($442) ($77) ($284) ($169) ($142) ($629) ($435) ($481) ($475) ($431) ($357) ($345) ($553) ($83) ($386) ($517) ($75) ($130) ($126) ($71) ($82) ($586) ($186)
Page 19 of 38
Comparison of Total M&O Revenue for School Districts and Charter Schools - LBB Model 887 FISCAL YEAR 2013 Note: All figures below are estimates and are subject to change based on actual and final student counts, property values, and tax effort. Amounts reflect available statewide estimates and may differ from local projections. M&O revenue amounts below are based on district entitlement for a full year, and do not reflect a payment deferral or any other actual or potential change to the distribution schedule of that entitlement.
Fiscal Year 2013 District Name
LAKE TRAVIS ISD LAKE WORTH ISD LAMAR CONSOLIDATED ISD LAMESA ISD LAMPASAS ISD LANCASTER ISD LANEVILLE ISD LAPOYNOR ISD LAREDO ISD LASARA ISD LATEXO ISD LAZBUDDIE ISD LEAKEY ISD LEANDER ISD LEARY ISD LEFORS ISD LEGGETT ISD LEON ISD LEONARD ISD LEVELLAND ISD LEVERETTS CHAPEL ISD LEWISVILLE ISD LEXINGTON ISD LIBERTY HILL ISD LIBERTY ISD LIBERTY-EYLAU ISD LIFE SCHOOL LIGHTHOUSE CHARTER SCHOOL LINDALE ISD LINDEN-KILDARE CONS ISD LINDSAY ISD LINGLEVILLE ISD LIPAN ISD
Legislative Budget Board - Model 887
County District Number
County Name
227913 220910 079901 058906 141901 057913 201903 107910 240901 245901 113905 185904 193902 246913 019914 090902 187906 145911 074909 110902 201904 061902 144902 246908 146906 019908 057807 015825 212903 034905 049907 072909 111902
TRAVIS TARRANT FORT BEND DAWSON LAMPASAS DALLAS RUSK HENDERSON WEBB WILLACY HOUSTON PARMER REAL WILLIAMSON BOWIE GRAY POLK LEON FANNIN HOCKLEY RUSK DENTON LEE WILLIAMSON LIBERTY BOWIE DALLAS BEXAR SMITH CASS COOKE ERATH HOOD
HB3646 WADA
8,389 3,981 31,537 2,438 4,262 7,928 292 710 31,835 911 656 266 468 40,380 191 262 293 1,210 1,341 3,994 418 60,469 1,300 3,560 2,633 3,646 7,153 309 4,774 1,184 727 352 408
Current Law (SB 1 821CS) - FY13
Total M&O Revenue
$49,599,580 $22,333,474 $167,137,746 $13,906,711 $23,684,074 $41,236,281 $1,548,944 $4,025,017 $161,109,558 $4,732,154 $3,381,717 $1,539,901 $2,731,852 $234,574,034 $946,751 $2,018,273 $1,545,269 $8,824,414 $7,416,624 $22,607,103 $2,336,995 $336,604,677 $6,809,008 $18,645,968 $13,914,624 $20,378,185 $36,811,192 $1,605,092 $25,230,168 $6,713,552 $3,886,975 $1,818,936 $2,313,987
Fiscal Year: 2013
HB 3646 - FY13
FY13
Total M&O Revenue
Change in Total M&O Revenue
$54,356,085 $23,976,688 $183,509,284 $14,102,691 $25,718,320 $43,421,902 $1,680,567 $4,409,961 $175,506,236 $5,109,013 $3,603,626 $1,674,065 $2,983,246 $256,785,794 $1,011,707 $2,212,864 $1,687,882 $9,641,565 $7,793,587 $24,684,716 $2,370,729 $369,131,267 $7,443,693 $20,375,149 $14,697,185 $20,664,518 $40,275,284 $1,753,670 $26,719,005 $6,798,925 $4,248,904 $1,986,286 $2,425,576
($4,756,505) ($1,643,214) ($16,371,538) ($195,980) ($2,034,246) ($2,185,621) ($131,623) ($384,944) ($14,396,677) ($376,859) ($221,909) ($134,164) ($251,394) ($22,211,759) ($64,956) ($194,591) ($142,613) ($817,151) ($376,963) ($2,077,614) ($33,734) ($32,526,590) ($634,685) ($1,729,181) ($782,561) ($286,333) ($3,464,092) ($148,578) ($1,488,837) ($85,373) ($361,929) ($167,350) ($111,589)
Current Law (SB 1 HB 3646 - FY13 821CS) FY13 Total M&O Revenue per HB 3646 WADA $5,912 $5,610 $5,300 $5,704 $5,557 $5,202 $5,308 $5,668 $5,061 $5,194 $5,158 $5,787 $5,839 $5,809 $4,951 $7,692 $5,279 $7,292 $5,530 $5,660 $5,588 $5,567 $5,238 $5,237 $5,285 $5,589 $5,147 $5,188 $5,285 $5,671 $5,347 $5,174 $5,677
FY13
Change in Total Total M&O M&O Revenue Revenue per HB per HB3646 3646 WADA WADA $6,479 $6,022 $5,819 $5,785 $6,035 $5,477 $5,759 $6,210 $5,513 $5,608 $5,497 $6,291 $6,377 $6,359 $5,290 $8,433 $5,766 $7,967 $5,811 $6,180 $5,669 $6,104 $5,727 $5,723 $5,582 $5,667 $5,631 $5,668 $5,597 $5,743 $5,845 $5,650 $5,951
($567) ($413) ($519) ($80) ($477) ($276) ($451) ($542) ($452) ($414) ($338) ($504) ($537) ($550) ($340) ($742) ($487) ($675) ($281) ($520) ($81) ($538) ($488) ($486) ($297) ($79) ($484) ($480) ($312) ($72) ($498) ($476) ($274)
Page 20 of 38
Comparison of Total M&O Revenue for School Districts and Charter Schools - LBB Model 887 FISCAL YEAR 2013 Note: All figures below are estimates and are subject to change based on actual and final student counts, property values, and tax effort. Amounts reflect available statewide estimates and may differ from local projections. M&O revenue amounts below are based on district entitlement for a full year, and do not reflect a payment deferral or any other actual or potential change to the distribution schedule of that entitlement.
Fiscal Year 2013 District Name
LITTLE CYPRESS-MAURICEVILLE CI LITTLE ELM ISD LITTLEFIELD ISD LIVINGSTON ISD LLANO ISD LOCKHART ISD LOCKNEY ISD LOHN ISD LOMETA ISD LONDON ISD LONE OAK ISD LONGVIEW ISD LOOP ISD LORAINE ISD LORENA ISD LORENZO ISD LOS FRESNOS CONS ISD LOUISE ISD LOVEJOY ISD LOVELADY ISD LUBBOCK ISD LUBBOCK-COOPER ISD LUEDERS-AVOCA ISD LUFKIN ISD LULING ISD LUMBERTON ISD LYFORD CISD LYTLE ISD MABANK ISD MADISONVILLE CONS ISD MAGNOLIA ISD MAINLAND PREPARATORY ACADEMY MALAKOFF ISD
Legislative Budget Board - Model 887
County District Number
County Name
181908 061914 140904 187907 150901 028902 077902 160905 141902 178906 116906 092903 083902 168902 161907 054902 031906 241906 043919 113903 152901 152906 127905 003903 028903 100907 245902 007904 129905 154901 170906 084801 107906
ORANGE DENTON LAMB POLK LLANO CALDWELL FLOYD MCCULLOCH LAMPASAS NUECES HUNT GREGG GAINES MITCHELL MCLENNAN CROSBY CAMERON WHARTON COLLIN HOUSTON LUBBOCK LUBBOCK JONES ANGELINA CALDWELL HARDIN WILLACY ATASCOSA KAUFMAN MADISON MONTGOMERY GALVESTON HENDERSON
HB3646 WADA
4,406 8,396 1,910 5,111 2,489 6,069 815 252 521 660 1,455 10,371 255 276 2,004 516 13,228 779 4,225 867 34,819 5,580 242 10,770 1,835 4,832 2,223 2,313 4,095 3,073 15,261 502 1,757
Current Law (SB 1 821CS) - FY13
Total M&O Revenue
$22,318,756 $43,792,521 $9,783,325 $26,725,418 $15,427,272 $31,939,276 $4,495,768 $1,283,428 $2,654,103 $4,023,887 $7,348,888 $56,791,113 $2,013,273 $1,516,187 $11,042,194 $2,621,958 $70,876,106 $4,366,065 $30,543,624 $4,491,539 $180,736,850 $30,007,868 $1,376,737 $56,126,090 $9,352,244 $24,922,376 $12,953,102 $12,980,311 $21,545,845 $15,938,176 $81,391,408 $2,604,343 $9,916,097
Fiscal Year: 2013
HB 3646 - FY13
FY13
Total M&O Revenue
Change in Total M&O Revenue
$22,944,156 $47,962,769 $10,023,486 $27,506,580 $16,754,884 $33,426,040 $4,560,418 $1,311,688 $2,708,879 $4,407,558 $7,933,165 $62,159,205 $2,182,442 $1,549,701 $11,473,888 $2,839,267 $73,044,086 $4,560,825 $33,536,979 $4,901,551 $183,600,270 $32,738,875 $1,498,584 $56,858,150 $10,162,351 $27,192,689 $13,128,928 $13,176,710 $22,460,491 $16,604,728 $87,546,100 $2,850,590 $10,829,794
($625,400) ($4,170,248) ($240,161) ($781,163) ($1,327,612) ($1,486,764) ($64,650) ($28,259) ($54,775) ($383,671) ($584,276) ($5,368,092) ($169,169) ($33,514) ($431,694) ($217,309) ($2,167,980) ($194,760) ($2,993,355) ($410,012) ($2,863,419) ($2,731,007) ($121,847) ($732,061) ($810,107) ($2,270,313) ($175,826) ($196,399) ($914,646) ($666,551) ($6,154,692) ($246,247) ($913,698)
Current Law (SB 1 HB 3646 - FY13 821CS) FY13 Total M&O Revenue per HB 3646 WADA $5,065 $5,216 $5,123 $5,229 $6,199 $5,263 $5,519 $5,100 $5,091 $6,094 $5,050 $5,476 $7,906 $5,493 $5,509 $5,081 $5,358 $5,606 $7,229 $5,181 $5,191 $5,378 $5,684 $5,211 $5,097 $5,158 $5,828 $5,613 $5,261 $5,186 $5,333 $5,186 $5,645
FY13
Change in Total Total M&O M&O Revenue Revenue per HB per HB3646 3646 WADA WADA $5,207 $5,712 $5,249 $5,382 $6,733 $5,508 $5,598 $5,213 $5,196 $6,675 $5,451 $5,993 $8,570 $5,615 $5,725 $5,502 $5,522 $5,856 $7,937 $5,654 $5,273 $5,867 $6,187 $5,279 $5,539 $5,628 $5,907 $5,698 $5,485 $5,403 $5,737 $5,676 $6,165
($142) ($497) ($126) ($153) ($533) ($245) ($79) ($112) ($105) ($581) ($401) ($518) ($664) ($121) ($215) ($421) ($164) ($250) ($708) ($473) ($82) ($489) ($503) ($68) ($442) ($470) ($79) ($85) ($223) ($217) ($403) ($490) ($520)
Page 21 of 38
Comparison of Total M&O Revenue for School Districts and Charter Schools - LBB Model 887 FISCAL YEAR 2013 Note: All figures below are estimates and are subject to change based on actual and final student counts, property values, and tax effort. Amounts reflect available statewide estimates and may differ from local projections. M&O revenue amounts below are based on district entitlement for a full year, and do not reflect a payment deferral or any other actual or potential change to the distribution schedule of that entitlement.
Fiscal Year 2013 District Name
MALONE ISD MALTA ISD MANARA ACADEMY MANOR ISD MANSFIELD ISD MARATHON ISD MARBLE FALLS ISD MARFA ISD MARION ISD MARLIN ISD MARSHALL ISD MART ISD MARTINS MILL ISD MARTINSVILLE ISD MASON ISD MATAGORDA ISD MATHIS ISD MAUD ISD MAY ISD MAYPEARL ISD MCALLEN ISD MCCAMEY ISD MCDADE ISD MCGREGOR ISD MCKINNEY ISD MCLEAN ISD MCLEOD ISD MCMULLEN COUNTY ISD MEADOW ISD MEADOWLAND CHARTER SCHOOL MEDICAL CENTER CHARTER SCHOOL MEDINA ISD MEDINA VALLEY ISD
Legislative Budget Board - Model 887
County District Number
County Name
109908 019910 057844 227907 220908 022902 027904 189901 094904 073903 102902 161908 234905 174909 157901 158904 205904 019903 025905 070915 108906 231901 011905 161909 043907 090903 034906 162904 223902 130801 101801 010901 163908
HILL BOWIE DALLAS TRAVIS TARRANT BREWSTER BURNET PRESIDIO GUADALUPE FALLS HARRISON MCLENNAN VAN ZANDT NACOGDOCHES MASON MATAGORDA SAN PATRICIO BOWIE BROWN ELLIS HIDALGO UPTON BASTROP MCLENNAN COLLIN GRAY CASS MCMULLEN TERRY KENDALL HARRIS BANDERA MEDINA
HB3646 WADA
157 141 330 10,913 39,551 232 4,990 667 1,612 1,676 7,203 886 786 566 1,168 212 2,110 828 410 1,673 34,475 902 304 1,838 28,827 387 674 291 529 177 245 602 4,601
Current Law (SB 1 821CS) - FY13
Total M&O Revenue
$783,668 $741,537 $1,725,849 $60,773,971 $209,080,040 $1,265,391 $28,783,380 $3,430,532 $8,819,985 $8,355,971 $36,096,067 $4,602,128 $3,988,427 $2,798,657 $6,458,469 $1,348,935 $12,062,727 $4,459,250 $2,181,575 $8,667,294 $183,200,871 $6,214,335 $1,523,879 $9,630,959 $160,130,067 $2,337,988 $3,548,230 $2,982,997 $2,930,792 $921,183 $1,260,230 $3,143,238 $23,980,022
Fiscal Year: 2013
HB 3646 - FY13
FY13
Total M&O Revenue
Change in Total M&O Revenue
$855,785 $769,115 $1,866,758 $66,432,464 $221,415,253 $1,312,780 $31,507,455 $3,756,073 $9,068,975 $8,707,790 $38,372,652 $5,015,324 $4,238,665 $2,848,126 $6,959,948 $1,465,781 $12,233,436 $4,768,848 $2,376,025 $8,894,366 $185,896,124 $6,767,327 $1,669,647 $10,537,462 $175,654,925 $2,562,081 $3,871,252 $3,244,483 $2,976,573 $984,877 $1,377,712 $3,420,443 $25,563,331
($72,118) ($27,578) ($140,909) ($5,658,493) ($12,335,212) ($47,390) ($2,724,076) ($325,542) ($248,991) ($351,819) ($2,276,585) ($413,196) ($250,238) ($49,468) ($501,479) ($116,846) ($170,709) ($309,598) ($194,450) ($227,072) ($2,695,253) ($552,992) ($145,768) ($906,503) ($15,524,858) ($224,094) ($323,022) ($261,486) ($45,782) ($63,694) ($117,482) ($277,205) ($1,583,309)
Current Law (SB 1 HB 3646 - FY13 821CS) FY13 Total M&O Revenue per HB 3646 WADA $4,979 $5,256 $5,230 $5,569 $5,286 $5,456 $5,768 $5,145 $5,471 $4,987 $5,011 $5,194 $5,072 $4,944 $5,529 $6,361 $5,716 $5,386 $5,315 $5,180 $5,314 $6,891 $5,008 $5,238 $5,555 $6,049 $5,263 $10,254 $5,538 $5,218 $5,145 $5,217 $5,212
FY13
Change in Total Total M&O M&O Revenue Revenue per HB per HB3646 3646 WADA WADA $5,437 $5,452 $5,657 $6,087 $5,598 $5,661 $6,314 $5,634 $5,625 $5,197 $5,327 $5,661 $5,390 $5,031 $5,959 $6,912 $5,797 $5,760 $5,788 $5,316 $5,392 $7,504 $5,487 $5,732 $6,093 $6,629 $5,742 $11,153 $5,624 $5,579 $5,624 $5,677 $5,556
($458) ($195) ($427) ($518) ($312) ($204) ($546) ($488) ($154) ($210) ($316) ($466) ($318) ($87) ($429) ($551) ($81) ($374) ($474) ($136) ($78) ($613) ($479) ($493) ($539) ($580) ($479) ($899) ($87) ($361) ($480) ($460) ($344)
Page 22 of 38
Comparison of Total M&O Revenue for School Districts and Charter Schools - LBB Model 887 FISCAL YEAR 2013 Note: All figures below are estimates and are subject to change based on actual and final student counts, property values, and tax effort. Amounts reflect available statewide estimates and may differ from local projections. M&O revenue amounts below are based on district entitlement for a full year, and do not reflect a payment deferral or any other actual or potential change to the distribution schedule of that entitlement.
Fiscal Year 2013 District Name
MELISSA ISD MEMPHIS ISD MENARD ISD MERCEDES ISD MERIDIAN ISD MERKEL ISD MESQUITE ISD METRO ACADEMY OF MATH AND SCIE MEXIA ISD MEYERPARK ELEMENTARY MEYERSVILLE ISD MIAMI ISD MIDLAND ACADEMY CHARTER SCHOOL MIDLAND ISD MIDLOTHIAN ISD MID-VALLEY ACADEMY MIDWAY ISD (Clay) MIDWAY ISD (McLennan) MILANO ISD MILDRED ISD MILES ISD MILFORD ISD MILLER GROVE ISD MILLSAP ISD MINEOLA ISD MINERAL WELLS ISD MISSION CONS ISD MONAHANS-WICKETT-PYOTE ISD MONTAGUE ISD MONTE ALTO ISD MONTGOMERY ISD MOODY ISD MORAN ISD
Legislative Budget Board - Model 887
County District Number
County Name
043908 096904 164901 108907 018902 221904 057914 220808 147903 101855 062906 197902 165802 165901 070908 108804 039905 161903 166903 175910 200902 070909 112907 184904 250903 182903 108908 238902 169908 108915 170903 161910 209902
COLLIN HALL MENARD HIDALGO BOSQUE TAYLOR DALLAS TARRANT LIMESTONE HARRIS DEWITT ROBERTS MIDLAND MIDLAND ELLIS HIDALGO CLAY MCLENNAN MILAM NAVARRO RUNNELS ELLIS HOPKINS PARKER WOOD PALO PINTO HIDALGO WARD MONTAGUE HIDALGO MONTGOMERY MCLENNAN SHACKELFORD
HB3646 WADA
2,395 1,006 605 7,433 819 1,653 49,607 453 2,896 320 244 293 836 25,199 9,448 603 244 8,325 681 1,083 587 428 419 1,080 2,064 4,531 20,468 2,565 152 1,534 8,276 989 290
Current Law (SB 1 821CS) - FY13
Total M&O Revenue
$12,972,240 $5,069,332 $3,140,371 $39,364,526 $4,429,020 $9,573,697 $260,110,566 $2,333,117 $14,837,212 $1,662,252 $1,478,408 $2,552,066 $4,355,482 $131,709,456 $50,726,190 $3,184,615 $1,296,246 $48,193,159 $3,530,567 $6,128,099 $3,335,255 $2,228,615 $2,244,169 $6,062,987 $11,469,555 $23,559,874 $109,038,571 $15,312,270 $846,877 $7,889,414 $47,941,711 $5,378,387 $1,505,462
Fiscal Year: 2013
HB 3646 - FY13
FY13
Total M&O Revenue
Change in Total M&O Revenue
$14,239,627 $5,540,051 $3,227,660 $39,929,717 $4,821,726 $10,458,294 $264,802,108 $2,549,508 $15,033,116 $1,818,146 $1,622,859 $2,779,638 $4,749,986 $144,371,399 $55,614,844 $3,439,406 $1,419,593 $52,633,025 $3,576,660 $6,685,860 $3,477,265 $2,328,278 $2,276,121 $6,249,431 $12,026,718 $24,481,498 $110,575,731 $16,714,453 $917,667 $8,239,455 $52,490,258 $5,867,786 $1,640,359
($1,267,387) ($470,719) ($87,289) ($565,191) ($392,706) ($884,598) ($4,691,542) ($216,392) ($195,904) ($155,894) ($144,451) ($227,571) ($394,504) ($12,661,943) ($4,888,654) ($254,791) ($123,347) ($4,439,866) ($46,093) ($557,761) ($142,011) ($99,663) ($31,952) ($186,444) ($557,163) ($921,624) ($1,537,160) ($1,402,183) ($70,790) ($350,042) ($4,548,548) ($489,399) ($134,897)
Current Law (SB 1 HB 3646 - FY13 821CS) FY13 Total M&O Revenue per HB 3646 WADA $5,417 $5,040 $5,189 $5,296 $5,410 $5,790 $5,243 $5,148 $5,124 $5,193 $6,067 $8,724 $5,208 $5,227 $5,369 $5,278 $5,315 $5,789 $5,184 $5,660 $5,678 $5,205 $5,352 $5,616 $5,558 $5,199 $5,327 $5,970 $5,589 $5,141 $5,793 $5,440 $5,199
FY13
Change in Total Total M&O M&O Revenue Revenue per HB per HB3646 3646 WADA WADA $5,946 $5,508 $5,333 $5,372 $5,890 $6,325 $5,338 $5,625 $5,192 $5,680 $6,660 $9,502 $5,680 $5,729 $5,887 $5,700 $5,821 $6,322 $5,251 $6,175 $5,920 $5,438 $5,429 $5,789 $5,828 $5,403 $5,402 $6,517 $6,056 $5,370 $6,343 $5,935 $5,665
($529) ($468) ($144) ($76) ($480) ($535) ($95) ($477) ($68) ($487) ($593) ($778) ($472) ($502) ($517) ($422) ($506) ($533) ($68) ($515) ($242) ($233) ($76) ($173) ($270) ($203) ($75) ($547) ($467) ($228) ($550) ($495) ($466)
Page 23 of 38
Comparison of Total M&O Revenue for School Districts and Charter Schools - LBB Model 887 FISCAL YEAR 2013 Note: All figures below are estimates and are subject to change based on actual and final student counts, property values, and tax effort. Amounts reflect available statewide estimates and may differ from local projections. M&O revenue amounts below are based on district entitlement for a full year, and do not reflect a payment deferral or any other actual or potential change to the distribution schedule of that entitlement.
Fiscal Year 2013 District Name
MORGAN ISD MORGAN MILL ISD MORTON ISD MOTLEY COUNTY ISD MOULTON ISD MOUNT CALM ISD MOUNT ENTERPRISE ISD MOUNT PLEASANT ISD MOUNT VERNON ISD MUENSTER ISD MULESHOE ISD MULLIN ISD MUMFORD ISD MUNDAY ISD MURCHISON ISD NACOGDOCHES ISD NATALIA ISD NAVARRO ISD NAVASOTA ISD NAZARETH ISD NECHES ISD NEDERLAND ISD NEEDVILLE ISD NEW BOSTON ISD NEW BRAUNFELS ISD NEW CANEY ISD NEW DEAL ISD NEW DIANA ISD NEW FRONTIERS CHARTER SCHOOL NEW HOME ISD NEW SUMMERFIELD ISD NEW WAVERLY ISD NEWCASTLE ISD
Legislative Budget Board - Model 887
County District Number
County Name
018903 072910 040901 173901 143902 109910 201907 225902 080901 049902 009901 167902 198906 138903 107908 174904 163903 094903 093904 035903 001906 123905 079906 019905 046901 170908 152902 230906 015805 153905 037908 236901 252902
BOSQUE ERATH COCHRAN MOTLEY LAVACA HILL RUSK TITUS FRANKLIN COOKE BAILEY MILLS ROBERTSON KNOX HENDERSON NACOGDOCHES MEDINA GUADALUPE GRIMES CASTRO ANDERSON JEFFERSON FORT BEND BOWIE COMAL MONTGOMERY LUBBOCK UPSHUR BEXAR LYNN CHEROKEE WALKER YOUNG
HB3646 WADA
254 171 737 366 490 265 594 6,803 1,999 712 2,038 251 970 560 246 7,641 1,444 2,011 3,985 357 626 6,025 3,324 1,887 9,893 13,613 1,104 1,350 917 310 798 1,307 316
Current Law (SB 1 821CS) - FY13
Total M&O Revenue
$1,316,527 $920,151 $3,784,355 $2,050,102 $2,446,705 $1,439,195 $2,929,494 $34,027,421 $10,958,754 $3,614,053 $10,471,991 $1,270,870 $4,902,231 $3,176,902 $1,192,754 $40,368,185 $8,048,702 $10,973,097 $19,831,952 $1,962,910 $3,047,239 $31,459,927 $17,552,371 $10,456,995 $50,308,917 $72,672,627 $6,147,172 $7,178,725 $4,683,810 $1,731,291 $4,648,744 $6,732,828 $1,768,647
Fiscal Year: 2013
HB 3646 - FY13
FY13
Total M&O Revenue
Change in Total M&O Revenue
$1,354,233 $1,005,531 $4,001,586 $2,119,562 $2,671,691 $1,487,841 $2,973,552 $36,306,441 $11,963,697 $3,907,820 $10,866,649 $1,350,384 $5,262,717 $3,223,669 $1,303,654 $41,635,553 $8,167,707 $11,142,640 $21,561,108 $1,994,576 $3,190,667 $32,227,783 $18,003,014 $11,010,009 $55,180,367 $74,524,166 $6,284,501 $7,493,809 $5,104,754 $1,806,609 $5,080,073 $7,289,018 $1,833,247
($37,706) ($85,380) ($217,232) ($69,460) ($224,986) ($48,646) ($44,057) ($2,279,019) ($1,004,944) ($293,766) ($394,658) ($79,514) ($360,486) ($46,768) ($110,900) ($1,267,368) ($119,005) ($169,544) ($1,729,156) ($31,667) ($143,428) ($767,856) ($450,643) ($553,014) ($4,871,450) ($1,851,539) ($137,329) ($315,084) ($420,944) ($75,318) ($431,329) ($556,190) ($64,600)
Current Law (SB 1 HB 3646 - FY13 821CS) FY13 Total M&O Revenue per HB 3646 WADA $5,190 $5,396 $5,135 $5,606 $4,997 $5,437 $4,932 $5,002 $5,483 $5,079 $5,139 $5,069 $5,054 $5,670 $4,846 $5,283 $5,574 $5,456 $4,977 $5,496 $4,872 $5,221 $5,281 $5,541 $5,085 $5,339 $5,568 $5,317 $5,107 $5,579 $5,825 $5,151 $5,599
FY13
Change in Total Total M&O M&O Revenue Revenue per HB per HB3646 3646 WADA WADA $5,339 $5,897 $5,430 $5,796 $5,457 $5,620 $5,007 $5,337 $5,985 $5,492 $5,332 $5,387 $5,425 $5,753 $5,297 $5,449 $5,657 $5,541 $5,411 $5,585 $5,101 $5,349 $5,416 $5,834 $5,578 $5,475 $5,692 $5,550 $5,566 $5,822 $6,365 $5,577 $5,804
($149) ($501) ($295) ($190) ($460) ($184) ($74) ($335) ($503) ($413) ($194) ($317) ($372) ($83) ($451) ($166) ($82) ($84) ($434) ($89) ($229) ($127) ($136) ($293) ($492) ($136) ($124) ($233) ($459) ($243) ($540) ($426) ($205)
Page 24 of 38
Comparison of Total M&O Revenue for School Districts and Charter Schools - LBB Model 887 FISCAL YEAR 2013 Note: All figures below are estimates and are subject to change based on actual and final student counts, property values, and tax effort. Amounts reflect available statewide estimates and may differ from local projections. M&O revenue amounts below are based on district entitlement for a full year, and do not reflect a payment deferral or any other actual or potential change to the distribution schedule of that entitlement.
Fiscal Year 2013 District Name
NEWTON ISD NIXON-SMILEY CONS ISD NOCONA ISD NORDHEIM ISD NORMANGEE ISD NORTH EAST ISD NORTH FOREST ISD NORTH HILLS PREPARATORY SCHOOL NORTH HOPKINS ISD NORTH HOUSTON H S FOR BUSINESS NORTH LAMAR ISD NORTH ZULCH ISD NORTHSIDE ISD (Bexar) NORTHSIDE ISD (Wilbarger) NORTHWEST ISD NORTHWEST PREPARATORY NOVA ACADEMY NOVA ACADEMY (SOUTHEAST) NOVICE ISD NUECES CANYON CONS ISD NURSERY ISD NYOS CHARTER SCHOOL OAKWOOD ISD ODEM-EDROY ISD O'DONNELL ISD ODYSSEY ACADEMY INC OGLESBY ISD OLFEN ISD OLNEY ISD OLTON ISD ONALASKA ISD ONE STOP MULTISERVICE CHARTER ORANGE GROVE ISD
Legislative Budget Board - Model 887
County District Number
County Name
176902 089903 169902 062902 145906 015910 101909 057803 112906 101834 139911 154903 015915 244905 061911 101848 057809 057827 042906 069902 235904 227804 145907 205905 153903 084802 050904 200906 252903 140905 187910 108801 125903
NEWTON GONZALES MONTAGUE DEWITT LEON BEXAR HARRIS DALLAS HOPKINS HARRIS LAMAR MADISON BEXAR WILBARGER DENTON HARRIS DALLAS DALLAS COLEMAN EDWARDS VICTORIA TRAVIS LEON SAN PATRICIO LYNN GALVESTON CORYELL RUNNELS YOUNG LAMB POLK HIDALGO JIM WELLS
HB3646 WADA
1,750 1,671 1,133 232 871 81,365 8,697 2,134 704 6 3,740 566 120,257 308 21,943 504 387 450 244 542 189 1,256 357 1,544 654 895 273 136 1,249 1,121 1,435 867 2,405
Current Law (SB 1 821CS) - FY13
Total M&O Revenue
$9,087,833 $8,491,401 $5,856,318 $1,425,794 $4,179,599 $443,117,571 $46,420,034 $11,523,967 $3,546,863 $34,403 $19,385,186 $2,958,468 $631,220,235 $1,721,723 $141,319,511 $2,744,364 $2,030,433 $2,367,285 $1,274,201 $2,977,385 $1,177,399 $6,657,101 $1,980,663 $8,803,238 $3,549,155 $4,732,193 $1,609,406 $767,270 $6,898,295 $5,768,300 $7,227,387 $4,567,548 $13,218,823
Fiscal Year: 2013
HB 3646 - FY13
FY13
Total M&O Revenue
Change in Total M&O Revenue
$9,332,066 $9,239,514 $6,043,442 $1,544,863 $4,571,465 $485,632,130 $47,077,762 $12,644,271 $3,761,238 $35,525 $20,271,198 $3,081,009 $681,112,190 $1,748,631 $155,134,983 $2,989,452 $2,219,953 $2,587,105 $1,314,093 $3,227,321 $1,283,656 $7,284,310 $2,168,229 $8,965,891 $3,869,819 $5,172,759 $1,752,349 $821,173 $7,076,342 $5,846,914 $7,657,073 $4,978,174 $13,741,169
($244,233) ($748,113) ($187,124) ($119,069) ($391,866) ($42,514,559) ($657,728) ($1,120,304) ($214,375) ($1,122) ($886,012) ($122,540) ($49,891,955) ($26,909) ($13,815,472) ($245,088) ($189,519) ($219,820) ($39,892) ($249,936) ($106,257) ($627,209) ($187,566) ($162,653) ($320,664) ($440,566) ($142,943) ($53,903) ($178,047) ($78,614) ($429,686) ($410,627) ($522,346)
Current Law (SB 1 HB 3646 - FY13 821CS) FY13 Total M&O Revenue per HB 3646 WADA $5,194 $5,083 $5,169 $6,141 $4,798 $5,446 $5,338 $5,400 $5,039 $6,221 $5,184 $5,230 $5,249 $5,590 $6,440 $5,450 $5,249 $5,258 $5,232 $5,496 $6,227 $5,301 $5,553 $5,703 $5,423 $5,287 $5,895 $5,649 $5,521 $5,145 $5,037 $5,269 $5,496
FY13
Change in Total Total M&O M&O Revenue Revenue per HB per HB3646 3646 WADA WADA $5,334 $5,531 $5,334 $6,654 $5,248 $5,969 $5,413 $5,925 $5,343 $6,424 $5,421 $5,446 $5,664 $5,677 $7,070 $5,937 $5,739 $5,747 $5,395 $5,957 $6,789 $5,800 $6,079 $5,808 $5,913 $5,780 $6,419 $6,045 $5,664 $5,215 $5,336 $5,743 $5,713
($140) ($448) ($165) ($513) ($450) ($523) ($76) ($525) ($305) ($203) ($237) ($217) ($415) ($87) ($630) ($487) ($490) ($488) ($164) ($461) ($562) ($499) ($526) ($105) ($490) ($492) ($524) ($397) ($143) ($70) ($299) ($474) ($217)
Page 25 of 38
Comparison of Total M&O Revenue for School Districts and Charter Schools - LBB Model 887 FISCAL YEAR 2013 Note: All figures below are estimates and are subject to change based on actual and final student counts, property values, and tax effort. Amounts reflect available statewide estimates and may differ from local projections. M&O revenue amounts below are based on district entitlement for a full year, and do not reflect a payment deferral or any other actual or potential change to the distribution schedule of that entitlement.
Fiscal Year 2013 District Name
ORANGEFIELD ISD ORE CITY ISD ORENDA CHARTER SCHOOL OUTREACH ACADEMY OVERTON ISD PADUCAH ISD PAINT CREEK ISD PAINT ROCK ISD PALACIOS ISD PALESTINE ISD PALMER ISD PALO PINTO ISD PAMPA ISD PANHANDLE ISD PANOLA CHARTER SCHOOL PANTHER CREEK CONS ISD PARADIGM ACCELERATED CHARTER S PARADISE ISD PARIS ISD PASADENA ISD PASO DEL NORTE PATTON SPRINGS ISD PAWNEE ISD PEAK PREPARATORY SCHOOL PEARLAND ISD PEARSALL ISD PEASTER ISD PECOS-BARSTOW-TOYAH ISD PEGASUS SCHOOL OF LIBERAL ARTS PENELOPE ISD PERRIN-WHITT CONS ISD PERRYTON ISD PETERSBURG ISD
Legislative Budget Board - Model 887
County District Number
County Name
181905 230903 014804 235801 201908 051901 104907 048903 158905 001907 070910 182906 090904 033902 183801 042905 072801 249906 139909 101917 071803 063906 013902 057838 020908 082903 184908 195901 057802 109914 119903 179901 095904
ORANGE UPSHUR BELL VICTORIA RUSK COTTLE HASKELL CONCHO MATAGORDA ANDERSON ELLIS PALO PINTO GRAY CARSON PANOLA COLEMAN ERATH WISE LAMAR HARRIS EL PASO DICKENS BEE DALLAS BRAZORIA FRIO PARKER REEVES DALLAS HILL JACK OCHILTREE HALE
HB3646 WADA
2,348 1,326 1,404 359 827 431 303 276 2,115 4,061 1,615 159 4,370 1,067 196 332 502 1,524 4,566 68,515 719 289 252 2,290 23,177 3,004 1,457 2,952 1,109 336 583 2,982 427
Current Law (SB 1 821CS) - FY13
Total M&O Revenue
$11,636,945 $6,891,464 $7,254,414 $1,873,672 $4,069,056 $2,291,456 $1,716,753 $1,507,446 $14,202,644 $22,866,484 $9,105,974 $1,209,259 $22,578,779 $5,928,756 $1,069,041 $1,934,007 $2,649,529 $8,931,044 $25,364,960 $360,525,046 $3,797,093 $1,505,762 $1,578,058 $11,928,470 $123,141,232 $16,893,867 $7,747,396 $16,528,814 $5,951,260 $1,896,235 $3,047,728 $15,606,828 $2,380,785
Fiscal Year: 2013
HB 3646 - FY13
FY13
Total M&O Revenue
Change in Total M&O Revenue
$11,810,581 $6,983,993 $7,793,408 $2,048,327 $4,127,538 $2,499,898 $1,740,003 $1,586,807 $15,500,306 $23,486,641 $9,233,998 $1,312,223 $23,679,179 $6,499,775 $1,163,715 $1,958,716 $2,889,633 $9,784,864 $25,732,015 $365,817,413 $4,070,084 $1,527,722 $1,724,795 $13,042,801 $126,735,223 $17,484,396 $8,018,595 $18,095,684 $6,506,126 $1,920,684 $3,244,700 $16,200,031 $2,415,635
($173,636) ($92,529) ($538,994) ($174,654) ($58,482) ($208,442) ($23,251) ($79,361) ($1,297,662) ($620,157) ($128,024) ($102,964) ($1,100,399) ($571,020) ($94,674) ($24,710) ($240,105) ($853,820) ($367,055) ($5,292,366) ($272,992) ($21,959) ($146,737) ($1,114,331) ($3,593,991) ($590,529) ($271,199) ($1,566,870) ($554,866) ($24,449) ($196,972) ($593,203) ($34,850)
Current Law (SB 1 HB 3646 - FY13 821CS) FY13 Total M&O Revenue per HB 3646 WADA $4,956 $5,198 $5,166 $5,214 $4,920 $5,312 $5,663 $5,457 $6,717 $5,631 $5,637 $7,589 $5,167 $5,557 $5,459 $5,820 $5,280 $5,861 $5,556 $5,262 $5,280 $5,216 $6,251 $5,208 $5,313 $5,625 $5,318 $5,599 $5,368 $5,639 $5,232 $5,234 $5,577
FY13
Change in Total Total M&O M&O Revenue Revenue per HB per HB3646 3646 WADA WADA $5,030 $5,268 $5,550 $5,699 $4,991 $5,795 $5,740 $5,745 $7,330 $5,784 $5,716 $8,236 $5,419 $6,092 $5,943 $5,894 $5,759 $6,421 $5,636 $5,339 $5,659 $5,292 $6,832 $5,695 $5,468 $5,821 $5,504 $6,130 $5,869 $5,712 $5,570 $5,432 $5,658
($74) ($70) ($384) ($486) ($71) ($483) ($77) ($287) ($614) ($153) ($79) ($646) ($252) ($535) ($483) ($74) ($479) ($560) ($80) ($77) ($380) ($76) ($581) ($487) ($155) ($197) ($186) ($531) ($501) ($73) ($338) ($199) ($82)
Page 26 of 38
Comparison of Total M&O Revenue for School Districts and Charter Schools - LBB Model 887 FISCAL YEAR 2013 Note: All figures below are estimates and are subject to change based on actual and final student counts, property values, and tax effort. Amounts reflect available statewide estimates and may differ from local projections. M&O revenue amounts below are based on district entitlement for a full year, and do not reflect a payment deferral or any other actual or potential change to the distribution schedule of that entitlement.
Fiscal Year 2013 District Name
PETROLIA ISD PETTUS ISD PEWITT ISD PFLUGERVILLE ISD PHARR-SAN JUAN-ALAMO ISD PHOENIX CHARTER SCHOOL PILOT POINT ISD PINE TREE ISD PINEYWOODS COMMUNITY ACADEMY PITTSBURG ISD PLAINS ISD PLAINVIEW ISD PLANO ISD PLEASANT GROVE ISD PLEASANTON ISD PLEMONS-STINNETT-PHILLIPS CISD POINT ISABEL ISD PONDER ISD POOLVILLE ISD POR VIDA ACADEMY PORT ARANSAS ISD PORT ARTHUR ISD PORT NECHES-GROVES ISD POSITIVE SOLUTIONS CHARTER SCH POST ISD POTEET ISD POTH ISD POTTSBORO ISD PRAIRIE LEA ISD PRAIRIE VALLEY ISD PRAIRILAND ISD PREMONT ISD PRESIDIO ISD
Legislative Budget Board - Model 887
County District Number
County Name
039903 013903 172905 227904 108909 116801 061903 092904 003801 032902 251902 095905 043910 019912 007905 117904 031909 061906 184901 015801 178908 123907 123908 015814 085902 007906 247904 091913 028906 169909 139912 125905 189902
CLAY BEE MORRIS TRAVIS HIDALGO HUNT DENTON GREGG ANGELINA CAMP YOAKUM HALE COLLIN BOWIE ATASCOSA HUTCHINSON CAMERON DENTON PARKER BEXAR NUECES JEFFERSON JEFFERSON BEXAR GARZA ATASCOSA WILSON GRAYSON CALDWELL MONTAGUE LAMAR JIM WELLS PRESIDIO
HB3646 WADA
696 665 1,433 29,119 42,497 816 1,938 5,682 655 3,285 874 7,162 65,598 2,306 4,240 1,039 3,388 1,654 838 422 803 10,829 5,456 209 1,268 2,354 1,189 1,633 380 244 1,638 890 2,272
Current Law (SB 1 821CS) - FY13
Total M&O Revenue
$3,605,761 $3,747,880 $7,234,584 $151,528,613 $225,962,782 $4,356,644 $10,965,391 $29,847,671 $3,359,129 $16,923,300 $5,633,109 $37,027,772 $363,141,657 $12,539,904 $22,032,957 $6,527,945 $19,425,803 $11,237,449 $4,264,309 $2,261,696 $5,924,265 $59,479,023 $28,128,057 $1,104,792 $7,449,134 $12,346,001 $6,030,776 $9,212,248 $2,031,081 $1,534,144 $8,419,739 $4,537,861 $14,539,008
Fiscal Year: 2013
HB 3646 - FY13
FY13
Total M&O Revenue
Change in Total M&O Revenue
$3,657,757 $3,804,695 $7,627,955 $159,972,573 $229,091,701 $4,760,463 $11,168,498 $31,487,353 $3,661,471 $18,417,174 $6,133,108 $37,541,325 $398,255,838 $13,692,567 $22,542,879 $7,103,164 $21,053,732 $12,317,348 $4,655,633 $2,458,868 $6,455,216 $65,078,780 $30,818,960 $1,203,325 $8,113,150 $12,611,447 $6,205,608 $10,072,390 $2,211,541 $1,681,075 $8,604,718 $4,603,119 $15,848,203
($51,996) ($56,814) ($393,370) ($8,443,960) ($3,128,919) ($403,819) ($203,107) ($1,639,683) ($302,342) ($1,493,874) ($499,999) ($513,553) ($35,114,181) ($1,152,663) ($509,922) ($575,219) ($1,627,929) ($1,079,899) ($391,324) ($197,172) ($530,950) ($5,599,756) ($2,690,903) ($98,533) ($664,016) ($265,446) ($174,832) ($860,142) ($180,460) ($146,931) ($184,980) ($65,258) ($1,309,194)
Current Law (SB 1 HB 3646 - FY13 821CS) FY13 Total M&O Revenue per HB 3646 WADA $5,181 $5,640 $5,048 $5,204 $5,317 $5,341 $5,659 $5,253 $5,126 $5,151 $6,445 $5,170 $5,536 $5,437 $5,197 $6,281 $5,733 $6,796 $5,086 $5,359 $7,381 $5,493 $5,156 $5,278 $5,875 $5,245 $5,071 $5,640 $5,347 $6,279 $5,140 $5,100 $6,399
FY13
Change in Total Total M&O M&O Revenue Revenue per HB per HB3646 3646 WADA WADA $5,255 $5,726 $5,323 $5,494 $5,391 $5,836 $5,764 $5,542 $5,587 $5,606 $7,018 $5,242 $6,071 $5,937 $5,317 $6,835 $6,214 $7,449 $5,553 $5,826 $8,042 $6,010 $5,649 $5,749 $6,398 $5,358 $5,218 $6,166 $5,822 $6,880 $5,253 $5,173 $6,975
($75) ($85) ($274) ($290) ($74) ($495) ($105) ($289) ($461) ($455) ($572) ($72) ($535) ($500) ($120) ($553) ($480) ($653) ($467) ($467) ($661) ($517) ($493) ($471) ($524) ($113) ($147) ($527) ($475) ($601) ($113) ($73) ($576)
Page 27 of 38
Comparison of Total M&O Revenue for School Districts and Charter Schools - LBB Model 887 FISCAL YEAR 2013 Note: All figures below are estimates and are subject to change based on actual and final student counts, property values, and tax effort. Amounts reflect available statewide estimates and may differ from local projections. M&O revenue amounts below are based on district entitlement for a full year, and do not reflect a payment deferral or any other actual or potential change to the distribution schedule of that entitlement.
Fiscal Year 2013 District Name
PRIDDY ISD PRINCETON ISD PRINGLE-MORSE CISD PROGRESO ISD PROSPER ISD QUANAH ISD QUEEN CITY ISD QUINLAN ISD QUITMAN ISD RADIANCE ACADEMY OF LEARNING RAINS ISD RALLS ISD RAMIREZ CSD RANCH ACADEMY RANDOLPH FIELD ISD RANGER ISD RANKIN ISD RAPOPORT ACADEMY PUBLIC SCHOOL RAUL YZAGUIRRE SCHOOL FOR SUCC RAVEN SCHOOL RAYMONDVILLE ISD REAGAN COUNTY ISD RECONCILIATION ACADEMY RED LICK ISD RED OAK ISD REDWATER ISD REFUGIO ISD RESPONSIVE EDUCATION SOLUTIONS RICARDO ISD RICE CONS ISD RICE ISD RICHARD MILBURN ACADEMY RICHARD MILBURN ACADEMY (AMARI
Legislative Budget Board - Model 887
County District Number
County Name
167904 043911 098903 108910 043912 099903 034907 116908 250904 015815 190903 054903 066005 234801 015906 067907 231902 161802 101806 236801 245903 192901 057841 019911 070911 019906 196903 221801 137902 045903 175911 123804 188801
MILLS COLLIN HANSFORD HIDALGO COLLIN HARDEMAN CASS HUNT WOOD BEXAR RAINS CROSBY DUVAL VAN ZANDT BEXAR EASTLAND UPTON MCLENNAN HARRIS WALKER WILLACY REAGAN DALLAS BOWIE ELLIS BOWIE REFUGIO TAYLOR KLEBERG COLORADO NAVARRO JEFFERSON POTTER
HB3646 WADA
230 4,551 231 3,415 5,860 988 1,490 3,218 1,592 1,740 2,171 950 95 387 1,487 772 438 850 2,006 385 2,802 1,427 433 630 6,728 1,413 1,192 11,232 949 1,935 1,242 121 407
Current Law (SB 1 821CS) - FY13
Total M&O Revenue
$1,168,299 $23,424,078 $1,658,185 $17,945,868 $43,997,239 $5,023,658 $7,416,564 $16,515,182 $8,491,717 $8,940,908 $11,459,811 $4,751,571 $499,843 $2,024,914 $7,264,831 $3,902,649 $4,551,526 $4,458,693 $10,436,479 $2,125,392 $14,491,828 $9,381,022 $2,216,090 $2,888,373 $38,608,491 $7,741,122 $6,952,319 $59,019,215 $5,028,484 $10,385,087 $6,226,340 $652,410 $2,150,479
Fiscal Year: 2013
HB 3646 - FY13
FY13
Total M&O Revenue
Change in Total M&O Revenue
$1,268,377 $25,101,965 $1,808,479 $18,202,997 $48,153,268 $5,473,303 $7,529,346 $17,217,503 $9,287,366 $9,631,398 $12,505,999 $4,836,353 $508,837 $2,165,774 $7,395,113 $4,110,620 $4,876,498 $4,876,682 $11,395,027 $2,265,117 $15,792,676 $10,200,309 $2,396,618 $3,129,059 $39,344,994 $8,381,908 $7,605,271 $64,552,892 $5,363,097 $11,324,796 $6,531,184 $711,446 $2,309,932
($100,078) ($1,677,887) ($150,294) ($257,128) ($4,156,029) ($449,645) ($112,782) ($702,321) ($795,649) ($690,490) ($1,046,188) ($84,782) ($8,994) ($140,859) ($130,282) ($207,971) ($324,973) ($417,989) ($958,548) ($139,725) ($1,300,848) ($819,286) ($180,528) ($240,687) ($736,503) ($640,786) ($652,952) ($5,533,678) ($334,613) ($939,709) ($304,844) ($59,037) ($159,453)
Current Law (SB 1 HB 3646 - FY13 821CS) FY13 Total M&O Revenue per HB 3646 WADA $5,072 $5,147 $7,172 $5,255 $7,508 $5,085 $4,977 $5,133 $5,335 $5,139 $5,278 $5,003 $5,266 $5,230 $4,886 $5,058 $10,390 $5,248 $5,202 $5,515 $5,171 $6,574 $5,112 $4,586 $5,739 $5,477 $5,833 $5,254 $5,299 $5,367 $5,012 $5,390 $5,278
FY13
Change in Total Total M&O M&O Revenue Revenue per HB per HB3646 3646 WADA WADA $5,506 $5,516 $7,822 $5,330 $8,217 $5,540 $5,052 $5,351 $5,835 $5,536 $5,760 $5,092 $5,361 $5,594 $4,973 $5,328 $11,131 $5,740 $5,679 $5,877 $5,635 $7,148 $5,529 $4,968 $5,848 $5,931 $6,381 $5,747 $5,652 $5,853 $5,257 $5,878 $5,670
($434) ($369) ($650) ($75) ($709) ($455) ($76) ($218) ($500) ($397) ($482) ($89) ($95) ($364) ($88) ($270) ($742) ($492) ($478) ($363) ($464) ($574) ($416) ($382) ($109) ($453) ($548) ($493) ($353) ($486) ($245) ($488) ($391)
Page 28 of 38
Comparison of Total M&O Revenue for School Districts and Charter Schools - LBB Model 887 FISCAL YEAR 2013 Note: All figures below are estimates and are subject to change based on actual and final student counts, property values, and tax effort. Amounts reflect available statewide estimates and may differ from local projections. M&O revenue amounts below are based on district entitlement for a full year, and do not reflect a payment deferral or any other actual or potential change to the distribution schedule of that entitlement.
Fiscal Year 2013 District Name
RICHARD MILBURN ACADEMY (ECTOR RICHARD MILBURN ACADEMY (FORT RICHARD MILBURN ACADEMY (SUBUR RICHARD MILBURN ALTER HIGH SCH RICHARD MILBURN ALTER HIGH SCH RICHARDS ISD RICHARDSON ISD RICHLAND COLLEGIATE HS OF MATH RICHLAND SPRINGS ISD RIESEL ISD RIO GRANDE CITY ISD RIO HONDO ISD RIO VISTA ISD RIPLEY HOUSE CHARTER SCHOOL RISE ACADEMY RISING STAR ISD RIVER ROAD ISD RIVERCREST RIVIERA ISD ROBERT LEE ISD ROBINSON ISD ROBSTOWN ISD ROBY CONS ISD ROCHELLE ISD ROCKDALE ISD ROCKSPRINGS ISD ROCKWALL ISD ROGERS ISD ROMA ISD ROOSEVELT ISD ROPES ISD ROSCOE ISD ROSEBUD-LOTT ISD
Legislative Budget Board - Model 887
County District Number
County Name
068801 220812 101854 014801 178804 093905 057916 057840 206902 161912 214901 031911 126907 101853 152802 067908 188902 194903 137903 041902 161922 178909 076903 160904 166904 069901 199901 014907 214903 152908 110905 177901 073905
ECTOR TARRANT HARRIS BELL NUECES GRIMES DALLAS DALLAS SAN SABA MCLENNAN STARR CAMERON JOHNSON HARRIS LUBBOCK EASTLAND POTTER RED RIVER KLEBERG COKE MCLENNAN NUECES FISHER MCCULLOCH MILAM EDWARDS ROCKWALL BELL STARR LUBBOCK HOCKLEY NOLAN FALLS
HB3646 WADA
1,218 264 507 247 469 230 42,787 474 322 890 14,702 3,080 1,219 2,438 328 364 1,901 1,067 886 458 2,761 3,983 509 405 2,096 518 16,436 1,246 8,186 1,548 520 563 1,197
Current Law (SB 1 821CS) - FY13
Total M&O Revenue
$6,437,777 $1,405,665 $2,680,689 $1,301,032 $2,480,823 $1,462,586 $220,068,119 $2,517,514 $1,797,482 $4,454,344 $84,932,193 $17,711,960 $6,509,035 $12,555,034 $1,679,231 $2,000,367 $9,771,281 $6,001,639 $4,564,127 $2,443,597 $15,478,970 $22,873,084 $2,654,178 $2,053,041 $11,216,131 $3,228,469 $95,515,134 $6,452,139 $46,899,185 $8,115,792 $2,917,015 $3,039,938 $5,989,614
Fiscal Year: 2013
HB 3646 - FY13
FY13
Total M&O Revenue
Change in Total M&O Revenue
$7,022,208 $1,534,664 $2,923,733 $1,407,598 $2,677,801 $1,602,687 $241,057,579 $2,716,852 $1,832,784 $4,521,141 $86,018,724 $17,958,958 $7,093,736 $13,722,450 $1,834,804 $2,078,254 $9,924,566 $6,522,756 $4,991,984 $2,670,521 $15,935,994 $23,180,765 $2,692,651 $2,134,310 $11,364,045 $3,535,704 $104,803,155 $6,662,771 $47,547,966 $8,424,445 $2,966,454 $3,306,387 $6,502,213
($584,431) ($128,998) ($243,044) ($106,565) ($196,978) ($140,101) ($20,989,461) ($199,338) ($35,302) ($66,798) ($1,086,531) ($246,998) ($584,701) ($1,167,416) ($155,572) ($77,887) ($153,285) ($521,117) ($427,856) ($226,924) ($457,024) ($307,681) ($38,473) ($81,269) ($147,914) ($307,235) ($9,288,021) ($210,632) ($648,781) ($308,654) ($49,439) ($266,449) ($512,598)
Current Law (SB 1 HB 3646 - FY13 821CS) FY13 Total M&O Revenue per HB 3646 WADA $5,285 $5,320 $5,283 $5,275 $5,285 $6,366 $5,143 $5,315 $5,577 $5,007 $5,777 $5,751 $5,340 $5,151 $5,127 $5,501 $5,140 $5,626 $5,152 $5,338 $5,606 $5,742 $5,214 $5,074 $5,351 $6,229 $5,811 $5,180 $5,729 $5,244 $5,614 $5,400 $5,005
FY13
Change in Total Total M&O M&O Revenue Revenue per HB per HB3646 3646 WADA WADA $5,764 $5,808 $5,762 $5,707 $5,704 $6,976 $5,634 $5,736 $5,686 $5,082 $5,851 $5,831 $5,819 $5,629 $5,602 $5,716 $5,221 $6,115 $5,634 $5,834 $5,772 $5,820 $5,289 $5,275 $5,421 $6,822 $6,377 $5,349 $5,809 $5,443 $5,709 $5,874 $5,433
($480) ($488) ($479) ($432) ($420) ($610) ($491) ($421) ($110) ($75) ($74) ($80) ($480) ($479) ($475) ($214) ($81) ($489) ($483) ($496) ($166) ($77) ($76) ($201) ($71) ($593) ($565) ($169) ($79) ($199) ($95) ($473) ($428)
Page 29 of 38
Comparison of Total M&O Revenue for School Districts and Charter Schools - LBB Model 887 FISCAL YEAR 2013 Note: All figures below are estimates and are subject to change based on actual and final student counts, property values, and tax effort. Amounts reflect available statewide estimates and may differ from local projections. M&O revenue amounts below are based on district entitlement for a full year, and do not reflect a payment deferral or any other actual or potential change to the distribution schedule of that entitlement.
Fiscal Year 2013 District Name
ROTAN ISD ROUND ROCK ISD ROUND TOP-CARMINE ISD ROXTON ISD ROYAL ISD ROYSE CITY ISD RULE ISD RUNGE ISD RUSK ISD S AND S CONS ISD SABINAL ISD SABINE ISD SABINE PASS ISD SAINT JO ISD SALADO ISD SALTILLO ISD SAM RAYBURN ISD SAMNORWOOD ISD SAN ANGELO ISD SAN ANTONIO CAN HIGH SCHOOL SAN ANTONIO ISD SAN ANTONIO PREPARATORY ACADEM SAN ANTONIO SCHOOL FOR INQUIRY SAN ANTONIO TECHNOLOGY ACADEM SAN AUGUSTINE ISD SAN BENITO CONS ISD SAN DIEGO ISD SAN ELIZARIO ISD SAN FELIPE-DEL RIO CONS ISD SAN ISIDRO ISD SAN MARCOS CONS ISD SAN PERLITA ISD SAN SABA ISD
Legislative Budget Board - Model 887
County District Number
County Name
076904 246909 075908 139908 237905 199902 104903 128903 037907 091914 232902 092906 123913 169911 014908 112909 074917 044904 226903 015817 015907 015824 015820 015823 203901 031912 066902 071904 233901 214902 105902 245904 206901
FISHER WILLIAMSON FAYETTE LAMAR WALLER ROCKWALL HASKELL KARNES CHEROKEE GRAYSON UVALDE GREGG JEFFERSON MONTAGUE BELL HOPKINS FANNIN COLLINGSWORTH TOM GREEN BEXAR BEXAR BEXAR BEXAR BEXAR SAN AUGUSTINE CAMERON DUVAL EL PASO VAL VERDE STARR HAYS WILLACY SAN SABA
HB3646 WADA
554 52,478 391 330 2,863 5,996 251 488 2,813 1,162 856 1,727 584 477 1,710 434 671 188 17,366 484 68,004 1,659 861 104 1,277 14,797 1,859 5,431 12,614 492 9,008 536 1,160
Current Law (SB 1 821CS) - FY13
Total M&O Revenue
$3,099,762 $299,156,937 $2,327,939 $1,669,559 $14,821,271 $35,292,963 $1,398,604 $2,474,598 $14,578,000 $6,040,177 $4,134,380 $9,137,946 $3,985,575 $2,724,901 $9,264,940 $2,233,299 $3,744,292 $971,503 $85,086,886 $2,565,772 $356,893,745 $8,548,562 $4,480,827 $558,109 $6,914,517 $84,932,850 $9,722,778 $29,529,941 $63,934,634 $2,968,490 $49,797,929 $2,360,123 $5,791,138
Fiscal Year: 2013
HB 3646 - FY13
FY13
Total M&O Revenue
Change in Total M&O Revenue
$3,142,090 $328,106,075 $2,547,238 $1,697,614 $16,222,768 $38,373,189 $1,418,632 $2,674,830 $14,791,176 $6,496,824 $4,511,527 $10,009,680 $4,361,347 $2,966,340 $10,128,822 $2,425,098 $3,893,306 $1,055,505 $90,571,341 $2,800,106 $361,788,321 $9,286,043 $4,863,032 $608,853 $7,006,298 $86,089,282 $9,864,397 $29,948,940 $64,868,119 $3,244,985 $54,510,791 $2,587,935 $6,101,618
($42,327) ($28,949,139) ($219,299) ($28,055) ($1,401,497) ($3,080,226) ($20,028) ($200,232) ($213,176) ($456,648) ($377,147) ($871,734) ($375,772) ($241,439) ($863,883) ($191,799) ($149,014) ($84,002) ($5,484,455) ($234,334) ($4,894,576) ($737,481) ($382,205) ($50,744) ($91,781) ($1,156,432) ($141,619) ($418,999) ($933,484) ($276,495) ($4,712,861) ($227,812) ($310,481)
Current Law (SB 1 HB 3646 - FY13 821CS) FY13 Total M&O Revenue per HB 3646 WADA $5,594 $5,701 $5,959 $5,060 $5,176 $5,887 $5,563 $5,069 $5,182 $5,199 $4,830 $5,293 $6,822 $5,716 $5,418 $5,143 $5,578 $5,162 $4,900 $5,297 $5,248 $5,152 $5,202 $5,357 $5,413 $5,740 $5,231 $5,437 $5,069 $6,036 $5,528 $4,404 $4,992
FY13
Change in Total Total M&O M&O Revenue Revenue per HB per HB3646 3646 WADA WADA $5,671 $6,252 $6,521 $5,145 $5,666 $6,400 $5,642 $5,479 $5,258 $5,592 $5,271 $5,798 $7,466 $6,223 $5,923 $5,585 $5,800 $5,608 $5,215 $5,781 $5,320 $5,596 $5,646 $5,844 $5,485 $5,818 $5,307 $5,514 $5,143 $6,598 $6,051 $4,829 $5,260
($76) ($552) ($561) ($85) ($489) ($514) ($80) ($410) ($76) ($393) ($441) ($505) ($643) ($506) ($505) ($442) ($222) ($446) ($316) ($484) ($72) ($444) ($444) ($487) ($72) ($78) ($76) ($77) ($74) ($562) ($523) ($425) ($268)
Page 30 of 38
Comparison of Total M&O Revenue for School Districts and Charter Schools - LBB Model 887 FISCAL YEAR 2013 Note: All figures below are estimates and are subject to change based on actual and final student counts, property values, and tax effort. Amounts reflect available statewide estimates and may differ from local projections. M&O revenue amounts below are based on district entitlement for a full year, and do not reflect a payment deferral or any other actual or potential change to the distribution schedule of that entitlement.
Fiscal Year 2013 District Name
SAN VICENTE ISD SANDS CISD SANFORD ISD SANGER ISD SANTA ANNA ISD SANTA FE ISD SANTA GERTRUDIS ISD SANTA MARIA ISD SANTA ROSA ISD SANTO ISD SAVOY ISD SCHERTZ-CIBOLO-U CITY ISD SCHLEICHER ISD SCHOOL OF EXCELLENCE IN EDUCAT SCHOOL OF SCIENCE AND TECHNOLO SCHOOL OF SCIENCE AND TECHNOLO SCHOOL OF SCIENCE AND TECHNOLO SCHULENBURG ISD SCURRY-ROSSER ISD SEAGRAVES ISD SEALY ISD SEASHORE LEARNING CTR CHARTER SEASHORE MIDDLE ACAD SEGUIN ISD SEMINOLE ISD SER-NINOS CHARTER SCHOOL SEYMOUR ISD SHALLOWATER ISD SHAMROCK ISD SHARYLAND ISD SHEKINAH RADIANCE ACADEMY SHELBYVILLE ISD SHELDON ISD
Legislative Budget Board - Model 887
County District Number
County Name
022903 058909 117903 061908 042903 084909 137904 031913 031914 182904 074911 094902 207901 015806 015827 015831 178809 075903 129910 083901 008902 178802 178808 094901 083903 101802 012901 152909 242902 108911 015819 210903 101924
BREWSTER DAWSON HUTCHINSON DENTON COLEMAN GALVESTON KLEBERG CAMERON CAMERON PALO PINTO FANNIN GUADALUPE SCHLEICHER BEXAR BEXAR BEXAR NUECES FAYETTE KAUFMAN GAINES AUSTIN NUECES NUECES GUADALUPE GAINES HARRIS BAYLOR LUBBOCK WHEELER HIDALGO BEXAR SHELBY HARRIS
HB3646 WADA
127 407 1,197 3,294 530 5,416 652 1,124 1,754 768 490 15,557 1,045 2,905 1,428 441 384 1,056 1,295 937 3,411 289 182 9,013 3,268 1,054 984 2,001 515 12,764 1,862 1,067 9,242
Current Law (SB 1 821CS) - FY13
Total M&O Revenue
$630,353 $2,609,537 $5,956,907 $16,962,838 $2,738,215 $28,797,748 $4,570,746 $5,881,727 $9,273,476 $4,209,501 $2,459,353 $81,864,272 $5,929,375 $14,921,314 $7,461,115 $2,286,279 $1,980,653 $5,421,318 $6,666,078 $6,346,478 $18,328,351 $1,495,951 $939,895 $47,210,941 $20,307,239 $5,462,675 $4,986,810 $11,285,931 $2,639,838 $67,426,529 $9,561,887 $6,140,382 $57,557,446
Fiscal Year: 2013
HB 3646 - FY13
FY13
Total M&O Revenue
Change in Total M&O Revenue
$687,217 $2,849,726 $6,321,966 $18,418,445 $2,812,703 $29,454,827 $5,012,808 $5,966,878 $9,403,087 $4,398,284 $2,507,040 $89,743,854 $6,475,384 $16,133,583 $8,179,553 $2,503,076 $2,167,728 $5,912,629 $6,760,969 $6,915,634 $19,995,021 $1,640,980 $1,030,567 $47,873,489 $22,043,044 $5,968,107 $5,306,566 $11,766,745 $2,886,397 $72,375,412 $10,398,105 $6,666,962 $63,085,700
($56,864) ($240,189) ($365,059) ($1,455,607) ($74,487) ($657,079) ($442,062) ($85,151) ($129,611) ($188,783) ($47,688) ($7,879,581) ($546,009) ($1,212,269) ($718,438) ($216,796) ($187,075) ($491,311) ($94,891) ($569,156) ($1,666,670) ($145,029) ($90,672) ($662,548) ($1,735,805) ($505,431) ($319,757) ($480,814) ($246,559) ($4,948,883) ($836,218) ($526,581) ($5,528,253)
Current Law (SB 1 HB 3646 - FY13 821CS) FY13 Total M&O Revenue per HB 3646 WADA $4,976 $6,408 $4,976 $5,149 $5,167 $5,317 $7,011 $5,232 $5,286 $5,480 $5,018 $5,262 $5,674 $5,136 $5,223 $5,179 $5,155 $5,131 $5,147 $6,771 $5,373 $5,177 $5,166 $5,238 $6,213 $5,184 $5,070 $5,640 $5,127 $5,282 $5,135 $5,755 $6,228
FY13
Change in Total Total M&O M&O Revenue Revenue per HB per HB3646 3646 WADA WADA $5,425 $6,998 $5,280 $5,591 $5,308 $5,439 $7,689 $5,307 $5,360 $5,725 $5,115 $5,769 $6,196 $5,553 $5,726 $5,671 $5,642 $5,596 $5,221 $7,378 $5,862 $5,679 $5,664 $5,312 $6,744 $5,664 $5,395 $5,881 $5,606 $5,670 $5,584 $6,249 $6,826
($449) ($590) ($305) ($442) ($141) ($121) ($678) ($76) ($74) ($246) ($97) ($506) ($522) ($417) ($503) ($491) ($487) ($465) ($73) ($607) ($489) ($502) ($498) ($74) ($531) ($480) ($325) ($240) ($479) ($388) ($449) ($494) ($598)
Page 31 of 38
Comparison of Total M&O Revenue for School Districts and Charter Schools - LBB Model 887 FISCAL YEAR 2013 Note: All figures below are estimates and are subject to change based on actual and final student counts, property values, and tax effort. Amounts reflect available statewide estimates and may differ from local projections. M&O revenue amounts below are based on district entitlement for a full year, and do not reflect a payment deferral or any other actual or potential change to the distribution schedule of that entitlement.
Fiscal Year 2013 District Name
SHEPHERD ISD SHERMAN ISD SHINER ISD SIDNEY ISD SIERRA BLANCA ISD SILSBEE ISD SILVERTON ISD SIMMS ISD SINTON ISD SIVELLS BEND ISD SKIDMORE-TYNAN ISD SLATON ISD SLIDELL ISD SLOCUM ISD SMITHVILLE ISD SMYER ISD SNOOK ISD SNYDER ISD SOCORRO ISD SOMERSET ISD SOMERVILLE ISD SONORA ISD SOUTH PLAINS SOUTH SAN ANTONIO ISD SOUTH TEXAS ISD SOUTHLAND ISD SOUTHSIDE ISD SOUTHWEST ISD SOUTHWEST PREPARATORY SCHOOL SOUTHWEST SCHOOL SPEARMAN ISD SPLENDORA ISD SPRING BRANCH ISD
Legislative Budget Board - Model 887
County District Number
County Name
204904 091906 143903 047905 115902 100904 023902 019909 205906 049909 013905 152903 249908 001909 011904 110906 026903 208902 071909 015909 026902 218901 152803 015908 031916 085903 015917 015912 015807 101838 098904 170907 101920
SAN JACINTO GRAYSON LAVACA COMANCHE HUDSPETH HARDIN BRISCOE BOWIE SAN PATRICIO COOKE BEE LUBBOCK WISE ANDERSON BASTROP HOCKLEY BURLESON SCURRY EL PASO BEXAR BURLESON SUTTON LUBBOCK BEXAR CAMERON GARZA BEXAR BEXAR BEXAR HARRIS HANSFORD MONTGOMERY HARRIS
HB3646 WADA
2,574 8,424 822 234 317 3,714 383 896 2,708 121 1,228 1,848 349 675 2,220 581 771 3,637 54,979 4,977 727 1,419 259 12,810 4,869 270 6,738 15,043 818 2,589 1,332 4,634 40,748
Current Law (SB 1 821CS) - FY13
Total M&O Revenue
$13,013,920 $43,042,998 $4,227,897 $1,161,124 $1,639,391 $21,220,057 $2,009,595 $4,833,008 $14,729,214 $693,779 $6,479,440 $10,443,954 $2,166,349 $3,281,533 $11,282,827 $3,164,187 $4,001,155 $25,715,904 $264,173,707 $26,182,343 $3,670,356 $10,063,715 $1,365,014 $67,198,374 $26,076,480 $1,537,100 $37,556,456 $79,002,823 $4,372,912 $13,527,895 $7,480,249 $24,636,657 $217,496,793
Fiscal Year: 2013
HB 3646 - FY13
FY13
Total M&O Revenue
Change in Total M&O Revenue
$13,472,869 $45,476,333 $4,425,898 $1,263,111 $1,663,324 $21,626,098 $2,186,497 $5,253,350 $14,938,834 $756,124 $6,697,273 $10,586,263 $2,361,945 $3,574,860 $11,959,630 $3,355,708 $4,269,339 $28,144,535 $286,712,402 $26,729,065 $3,943,962 $11,017,359 $1,464,722 $68,141,069 $26,392,482 $1,605,918 $38,097,096 $84,212,962 $4,763,807 $14,762,180 $8,194,785 $25,001,166 $238,376,321
($458,949) ($2,433,335) ($198,002) ($101,986) ($23,933) ($406,041) ($176,903) ($420,343) ($209,620) ($62,345) ($217,833) ($142,308) ($195,596) ($293,327) ($676,803) ($191,521) ($268,184) ($2,428,630) ($22,538,696) ($546,723) ($273,606) ($953,644) ($99,707) ($942,695) ($316,002) ($68,818) ($540,639) ($5,210,140) ($390,895) ($1,234,284) ($714,536) ($364,508) ($20,879,527)
Current Law (SB 1 HB 3646 - FY13 821CS) FY13 Total M&O Revenue per HB 3646 WADA $5,057 $5,110 $5,145 $4,965 $5,167 $5,713 $5,244 $5,394 $5,440 $5,713 $5,276 $5,651 $6,205 $4,863 $5,082 $5,449 $5,190 $7,072 $4,805 $5,261 $5,052 $7,092 $5,276 $5,246 $5,356 $5,703 $5,574 $5,252 $5,344 $5,225 $5,617 $5,317 $5,338
FY13
Change in Total Total M&O M&O Revenue Revenue per HB per HB3646 3646 WADA WADA $5,235 $5,398 $5,385 $5,401 $5,242 $5,823 $5,706 $5,863 $5,517 $6,226 $5,453 $5,728 $6,765 $5,298 $5,387 $5,779 $5,538 $7,739 $5,215 $5,371 $5,428 $7,764 $5,662 $5,319 $5,421 $5,958 $5,654 $5,598 $5,821 $5,702 $6,154 $5,396 $5,850
($178) ($289) ($241) ($436) ($75) ($109) ($462) ($469) ($77) ($513) ($177) ($77) ($560) ($435) ($305) ($330) ($348) ($668) ($410) ($110) ($377) ($672) ($385) ($74) ($65) ($255) ($80) ($346) ($478) ($477) ($537) ($79) ($512)
Page 32 of 38
Comparison of Total M&O Revenue for School Districts and Charter Schools - LBB Model 887 FISCAL YEAR 2013 Note: All figures below are estimates and are subject to change based on actual and final student counts, property values, and tax effort. Amounts reflect available statewide estimates and may differ from local projections. M&O revenue amounts below are based on district entitlement for a full year, and do not reflect a payment deferral or any other actual or potential change to the distribution schedule of that entitlement.
Fiscal Year 2013 District Name
SPRING CREEK ISD SPRING HILL ISD SPRING ISD SPRINGLAKE-EARTH ISD SPRINGTOWN ISD SPUR ISD SPURGER ISD ST ANTHONY SCHOOL ST MARY'S ACADEMY CHARTER SCHO STAFFORD MSD STAMFORD ISD STANTON ISD STAR CHARTER SCHOOL STAR ISD STEPHEN F AUSTIN STATE UNIVERS STEPHENVILLE ISD STEPPING STONES CHARTER EL STERLING CITY ISD STOCKDALE ISD STRATFORD ISD STRAWN ISD SUDAN ISD SULPHUR BLUFF ISD SULPHUR SPRINGS ISD SUMMIT INTERNATIONAL PREPARATO SUNDOWN ISD SUNNYVALE ISD SUNRAY ISD SWEENY ISD SWEET HOME ISD SWEETWATER ISD TAFT ISD TAHOKA ISD
Legislative Budget Board - Model 887
County District Number
County Name
117907 092907 101919 140907 184902 063903 229905 057836 013801 079910 127906 156902 227814 167903 174801 072903 101859 216901 247906 211902 182905 140908 112910 112901 220816 110907 057919 171902 020906 143905 177902 205907 153904
HUTCHINSON GREGG HARRIS LAMB PARKER DICKENS TYLER DALLAS BEE FORT BEND JONES MARTIN TRAVIS MILLS NACOGDOCHES ERATH HARRIS STERLING WILSON SHERMAN PALO PINTO LAMB HOPKINS HOPKINS TARRANT HOCKLEY DALLAS MOORE BRAZORIA LAVACA NOLAN SAN PATRICIO LYNN
HB3646 WADA
134 2,311 46,959 679 4,298 532 581 514 666 4,224 993 1,268 392 150 325 4,421 325 405 1,190 974 295 771 367 4,899 854 989 1,619 787 2,435 206 2,942 1,470 1,053
Current Law (SB 1 821CS) - FY13
Total M&O Revenue
$692,068 $11,195,142 $250,577,344 $3,464,919 $21,798,936 $3,314,715 $2,914,525 $2,659,440 $3,460,946 $22,156,508 $5,559,985 $7,304,629 $2,131,421 $794,441 $1,651,010 $22,853,825 $1,660,831 $2,748,650 $6,028,073 $5,478,658 $1,483,611 $4,488,323 $1,968,117 $24,923,210 $4,439,420 $11,286,420 $9,821,077 $4,614,707 $13,432,053 $1,078,235 $15,452,573 $7,292,815 $5,368,080
Fiscal Year: 2013
HB 3646 - FY13
FY13
Total M&O Revenue
Change in Total M&O Revenue
$749,800 $11,511,725 $255,273,124 $3,623,432 $23,221,451 $3,630,345 $3,045,958 $2,911,740 $3,780,642 $24,188,760 $5,637,546 $8,009,473 $2,340,299 $804,803 $1,797,487 $23,619,065 $1,802,355 $2,995,935 $6,374,162 $5,980,327 $1,614,177 $4,894,330 $2,085,675 $27,050,972 $4,856,198 $12,416,495 $10,758,270 $5,048,325 $14,718,554 $1,183,373 $16,250,871 $7,961,445 $5,445,548
($57,732) ($316,583) ($4,695,780) ($158,513) ($1,422,516) ($315,630) ($131,432) ($252,301) ($319,696) ($2,032,252) ($77,561) ($704,844) ($208,878) ($10,362) ($146,477) ($765,240) ($141,524) ($247,284) ($346,090) ($501,668) ($130,565) ($406,007) ($117,558) ($2,127,762) ($416,779) ($1,130,076) ($937,193) ($433,618) ($1,286,501) ($105,138) ($798,298) ($668,630) ($77,468)
Current Law (SB 1 HB 3646 - FY13 821CS) FY13 Total M&O Revenue per HB 3646 WADA $5,151 $4,844 $5,336 $5,105 $5,072 $6,235 $5,017 $5,172 $5,193 $5,245 $5,597 $5,759 $5,434 $5,298 $5,085 $5,169 $5,107 $6,790 $5,067 $5,623 $5,029 $5,820 $5,366 $5,087 $5,201 $11,415 $6,067 $5,862 $5,516 $5,231 $5,252 $4,961 $5,097
FY13
Change in Total Total M&O M&O Revenue Revenue per HB per HB3646 3646 WADA WADA $5,581 $4,980 $5,436 $5,339 $5,403 $6,828 $5,243 $5,663 $5,673 $5,726 $5,675 $6,315 $5,966 $5,367 $5,536 $5,343 $5,542 $7,401 $5,358 $6,138 $5,472 $6,347 $5,687 $5,521 $5,689 $12,558 $6,646 $6,413 $6,044 $5,741 $5,523 $5,416 $5,170
($430) ($137) ($100) ($234) ($331) ($594) ($226) ($491) ($480) ($481) ($78) ($556) ($532) ($69) ($451) ($173) ($435) ($611) ($291) ($515) ($443) ($526) ($321) ($434) ($488) ($1,143) ($579) ($551) ($528) ($510) ($271) ($455) ($74)
Page 33 of 38
Comparison of Total M&O Revenue for School Districts and Charter Schools - LBB Model 887 FISCAL YEAR 2013 Note: All figures below are estimates and are subject to change based on actual and final student counts, property values, and tax effort. Amounts reflect available statewide estimates and may differ from local projections. M&O revenue amounts below are based on district entitlement for a full year, and do not reflect a payment deferral or any other actual or potential change to the distribution schedule of that entitlement.
Fiscal Year 2013 District Name
TARKINGTON ISD TATUM ISD TAYLOR ISD TEAGUE ISD TECHNOLOGY EDUCATION CHARTER H TEKOA ACADEMY OF ACCELERATED S TEMPLE EDUCATION CENTER TEMPLE ISD TENAHA ISD TERLINGUA CSD TERRELL COUNTY ISD TERRELL ISD TEXARKANA ISD TEXAS CITY ISD TEXAS ELEMENTARY SCHOOL OF THE TEXAS EMPOWERMENT ACADEMY TEXAS PREPARATORY SCHOOL TEXAS SERENITY ACADEMY TEXHOMA ISD TEXLINE ISD THE EAST AUSTIN COLLEGE PREP A THE LEGENDS ACADEMY THE RHODES SCHOOL THE VARNETT PUBLIC SCHOOL THORNDALE ISD THRALL ISD THREE RIVERS ISD THREE WAY ISD THROCKMORTON ISD TIDEHAVEN ISD TIMPSON ISD TIOGA ISD TLC ACADEMY
Legislative Budget Board - Model 887
County District Number
County Name
146907 201910 246911 081904 108802 123803 014803 014909 210904 022004 222901 129906 019907 084906 220814 227805 105802 170801 211901 056902 227824 061803 101861 101814 166905 246912 149902 072901 224901 158902 210905 091907 226801
LIBERTY RUSK WILLIAMSON FREESTONE HIDALGO JEFFERSON BELL BELL SHELBY BREWSTER TERRELL KAUFMAN BOWIE GALVESTON TARRANT TRAVIS HAYS MONTGOMERY SHERMAN DALLAM TRAVIS DENTON HARRIS HARRIS MILAM WILLIAMSON LIVE OAK ERATH THROCKMORTON MATAGORDA SHELBY GRAYSON TOM GREEN
HB3646 WADA
2,419 2,142 4,091 1,604 1,396 710 312 10,200 874 263 309 5,125 8,923 7,144 200 335 179 640 131 340 137 143 722 2,445 857 1,002 1,017 127 372 1,336 922 228 1,238
Current Law (SB 1 821CS) - FY13
Total M&O Revenue
$12,501,802 $11,917,898 $21,219,071 $10,799,704 $7,137,618 $3,787,682 $1,607,258 $53,138,878 $4,873,351 $1,410,545 $2,669,115 $29,427,488 $49,995,704 $41,578,083 $1,047,918 $1,783,876 $931,169 $3,318,941 $858,164 $1,930,207 $714,224 $743,485 $3,687,607 $12,713,201 $4,768,370 $5,166,809 $5,816,566 $681,215 $1,964,687 $7,736,358 $5,588,071 $1,248,765 $6,337,195
Fiscal Year: 2013
HB 3646 - FY13
FY13
Total M&O Revenue
Change in Total M&O Revenue
$12,699,610 $13,019,771 $21,533,802 $11,817,127 $7,783,813 $4,140,890 $1,727,547 $54,323,993 $5,326,334 $1,504,999 $2,889,738 $30,057,969 $52,226,322 $45,550,285 $1,149,508 $1,951,734 $1,018,405 $3,602,149 $932,849 $1,960,210 $771,012 $813,501 $3,989,841 $13,901,031 $4,941,540 $5,268,426 $6,354,123 $741,307 $2,148,858 $8,408,097 $6,085,374 $1,365,235 $6,880,481
($197,807) ($1,101,873) ($314,732) ($1,017,423) ($646,195) ($353,208) ($120,290) ($1,185,115) ($452,983) ($94,454) ($220,623) ($630,480) ($2,230,618) ($3,972,202) ($101,590) ($167,858) ($87,235) ($283,208) ($74,685) ($30,003) ($56,788) ($70,016) ($302,235) ($1,187,830) ($173,170) ($101,617) ($537,557) ($60,092) ($184,171) ($671,739) ($497,303) ($116,470) ($543,286)
Current Law (SB 1 HB 3646 - FY13 821CS) FY13 Total M&O Revenue per HB 3646 WADA $5,169 $5,564 $5,186 $6,731 $5,115 $5,338 $5,153 $5,210 $5,575 $5,373 $8,627 $5,742 $5,603 $5,820 $5,237 $5,318 $5,195 $5,184 $6,535 $5,678 $5,209 $5,207 $5,110 $5,199 $5,565 $5,155 $5,718 $5,363 $5,275 $5,790 $6,063 $5,476 $5,118
FY13
Change in Total Total M&O M&O Revenue Revenue per HB per HB3646 3646 WADA WADA $5,250 $6,079 $5,263 $7,365 $5,578 $5,836 $5,539 $5,326 $6,093 $5,732 $9,340 $5,865 $5,853 $6,376 $5,745 $5,818 $5,681 $5,627 $7,103 $5,766 $5,623 $5,697 $5,528 $5,685 $5,767 $5,256 $6,247 $5,836 $5,769 $6,292 $6,602 $5,987 $5,556
($82) ($514) ($77) ($634) ($463) ($498) ($386) ($116) ($518) ($360) ($713) ($123) ($250) ($556) ($508) ($500) ($487) ($442) ($569) ($88) ($414) ($490) ($419) ($486) ($202) ($101) ($528) ($473) ($494) ($503) ($540) ($511) ($439)
Page 34 of 38
Comparison of Total M&O Revenue for School Districts and Charter Schools - LBB Model 887 FISCAL YEAR 2013 Note: All figures below are estimates and are subject to change based on actual and final student counts, property values, and tax effort. Amounts reflect available statewide estimates and may differ from local projections. M&O revenue amounts below are based on district entitlement for a full year, and do not reflect a payment deferral or any other actual or potential change to the distribution schedule of that entitlement.
Fiscal Year 2013 District Name
TOLAR ISD TOM BEAN ISD TOMBALL ISD TORNILLO ISD TRANSFORMATIVE CHARTER ACADEMY TREETOPS SCHOOL INTERNATIONAL TRENT ISD TRENTON ISD TRINIDAD ISD TRINITY BASIN PREPARATORY TRINITY CHARTER SCHOOL TRINITY ISD TROUP ISD TROY ISD TULIA ISD TULOSO-MIDWAY ISD TURKEY-QUITAQUE ISD TWO DIMENSIONS PREPARATORY ACA TYLER ISD UNION GROVE ISD UNION HILL ISD UNITED ISD UNIVERSAL ACADEMY UNIVERSITY OF HOUSTON CHARTER UNIVERSITY OF TEXAS ELEMENTARY UNIVERSITY OF TEXAS UNIVERSITY UTOPIA ISD UVALDE CONS ISD VALENTINE ISD VALLEY MILLS ISD VALLEY VIEW ISD (Cooke) VALLEY VIEW ISD (Hidalgo) VAN ALSTYNE ISD
Legislative Budget Board - Model 887
County District Number
County Name
111903 091918 101921 071908 014802 220801 221905 074912 107907 057813 046802 228903 212904 014910 219903 178912 096905 101840 212905 230908 230904 240903 057808 101807 227819 227806 232904 232903 122902 018904 049903 108916 091908
HOOD GRAYSON HARRIS EL PASO BELL TARRANT TAYLOR FANNIN HENDERSON DALLAS COMAL TRINITY SMITH BELL SWISHER NUECES HALL HARRIS SMITH UPSHUR UPSHUR WEBB DALLAS HARRIS TRAVIS TRAVIS UVALDE UVALDE JEFF DAVIS BOSQUE COOKE HIDALGO GRAYSON
HB3646 WADA
854 1,080 12,741 1,872 104 615 339 867 293 2,310 1,220 1,678 1,471 1,680 1,608 4,506 387 456 22,981 1,041 481 56,633 2,141 169 455 2,105 391 5,877 232 942 984 6,931 1,732
Current Law (SB 1 821CS) - FY13
Total M&O Revenue
$4,419,434 $5,562,598 $75,409,167 $10,146,492 $553,841 $3,195,912 $1,864,149 $4,432,829 $1,575,335 $12,113,217 $6,414,449 $8,351,113 $8,949,343 $8,637,468 $8,849,562 $24,975,921 $1,977,726 $2,342,907 $119,451,455 $6,049,732 $2,488,695 $294,010,844 $11,387,176 $890,464 $2,346,108 $11,017,809 $2,245,520 $28,417,710 $1,193,074 $4,835,301 $5,451,868 $35,750,796 $9,304,564
Fiscal Year: 2013
HB 3646 - FY13
FY13
Total M&O Revenue
Change in Total M&O Revenue
$4,840,173 $5,776,741 $82,670,560 $10,297,193 $603,816 $3,504,158 $1,917,644 $4,805,253 $1,688,611 $13,241,175 $6,931,369 $8,531,438 $9,765,490 $8,784,352 $9,118,072 $25,871,681 $2,018,565 $2,548,975 $129,072,283 $6,576,352 $2,607,593 $320,217,563 $12,465,941 $976,380 $2,564,716 $11,915,321 $2,448,478 $30,237,221 $1,304,225 $4,930,813 $5,528,559 $37,735,547 $9,721,239
($420,739) ($214,143) ($7,261,393) ($150,700) ($49,975) ($308,246) ($53,495) ($372,424) ($113,276) ($1,127,958) ($516,920) ($180,326) ($816,147) ($146,884) ($268,510) ($895,760) ($40,839) ($206,069) ($9,620,828) ($526,620) ($118,898) ($26,206,718) ($1,078,765) ($85,916) ($218,609) ($897,512) ($202,959) ($1,819,511) ($111,151) ($95,511) ($76,691) ($1,984,752) ($416,676)
Current Law (SB 1 HB 3646 - FY13 821CS) FY13 Total M&O Revenue per HB 3646 WADA $5,178 $5,149 $5,918 $5,422 $5,304 $5,201 $5,502 $5,111 $5,377 $5,244 $5,259 $4,978 $6,082 $5,140 $5,503 $5,543 $5,108 $5,135 $5,198 $5,810 $5,171 $5,191 $5,318 $5,278 $5,155 $5,235 $5,745 $4,835 $5,140 $5,135 $5,542 $5,158 $5,371
FY13
Change in Total Total M&O M&O Revenue Revenue per HB per HB3646 3646 WADA WADA $5,671 $5,347 $6,488 $5,502 $5,783 $5,702 $5,660 $5,540 $5,763 $5,732 $5,683 $5,086 $6,637 $5,228 $5,670 $5,742 $5,214 $5,587 $5,617 $6,316 $5,418 $5,654 $5,822 $5,787 $5,636 $5,661 $6,264 $5,145 $5,619 $5,236 $5,620 $5,444 $5,612
($493) ($198) ($570) ($81) ($479) ($502) ($158) ($429) ($387) ($488) ($424) ($107) ($555) ($87) ($167) ($199) ($105) ($452) ($419) ($506) ($247) ($463) ($504) ($509) ($480) ($426) ($519) ($310) ($479) ($101) ($78) ($286) ($241)
Page 35 of 38
Comparison of Total M&O Revenue for School Districts and Charter Schools - LBB Model 887 FISCAL YEAR 2013 Note: All figures below are estimates and are subject to change based on actual and final student counts, property values, and tax effort. Amounts reflect available statewide estimates and may differ from local projections. M&O revenue amounts below are based on district entitlement for a full year, and do not reflect a payment deferral or any other actual or potential change to the distribution schedule of that entitlement.
Fiscal Year 2013 District Name
VAN ISD VAN VLECK ISD VANGUARD ACADEMY VEGA ISD VENUS ISD VERIBEST ISD VERNON ISD VICTORIA ISD VIDOR ISD VYSEHRAD ISD WACO CHARTER SCHOOL WACO ISD WAELDER ISD WALCOTT ISD WALL ISD WALLER ISD WALNUT BEND ISD WALNUT SPRINGS ISD WARREN ISD WASKOM ISD WATER VALLEY ISD WAXAHACHIE FAITH FAMILY ACADEM WAXAHACHIE ISD WEATHERFORD ISD WEBB CISD WEIMAR ISD WELLINGTON ISD WELLMAN-UNION CONS ISD WELLS ISD WESLACO ISD WEST HARDIN COUNTY CONS ISD WEST HOUSTON CHARTER SCHOOL WEST ISD
Legislative Budget Board - Model 887
County District Number
County Name
234906 158906 108808 180902 126908 226908 244903 235902 181907 143904 161801 161914 089905 059902 226906 237904 049908 018905 229904 102903 226905 070801 070912 184903 240904 045905 044902 223904 037909 108913 100908 101803 161916
VAN ZANDT MATAGORDA HIDALGO OLDHAM JOHNSON TOM GREEN WILBARGER VICTORIA ORANGE LAVACA MCLENNAN MCLENNAN GONZALES DEAF SMITH TOM GREEN WALLER COOKE BOSQUE TYLER HARRISON TOM GREEN ELLIS ELLIS PARKER WEBB COLORADO COLLINGSWORTH TERRY CHEROKEE HIDALGO HARDIN HARRIS MCLENNAN
HB3646 WADA
3,121 1,543 3,039 558 2,616 377 3,022 16,894 6,301 157 395 19,302 458 217 1,521 6,831 129 363 1,622 1,229 578 370 9,710 9,494 553 888 974 349 537 24,074 870 439 1,973
Current Law (SB 1 821CS) - FY13
Total M&O Revenue
$16,359,870 $8,213,145 $15,507,725 $2,847,497 $14,989,790 $2,058,038 $15,978,273 $87,894,024 $34,001,255 $942,398 $2,017,373 $99,840,866 $2,310,330 $965,270 $8,428,221 $35,976,613 $698,638 $1,698,060 $8,333,132 $6,418,672 $3,158,767 $1,942,024 $52,095,077 $53,938,421 $6,116,915 $4,799,165 $4,813,650 $2,099,051 $2,753,643 $126,617,935 $4,478,020 $2,277,501 $10,849,662
Fiscal Year: 2013
HB 3646 - FY13
FY13
Total M&O Revenue
Change in Total M&O Revenue
$17,553,639 $8,959,967 $16,808,640 $3,105,318 $15,570,464 $2,087,994 $17,494,333 $90,086,081 $34,486,150 $1,029,474 $2,188,227 $103,611,608 $2,505,095 $1,046,583 $9,240,601 $38,625,000 $766,216 $1,845,666 $9,123,223 $7,020,660 $3,338,578 $2,120,193 $56,973,717 $58,718,388 $6,669,820 $5,221,942 $5,157,935 $2,180,037 $2,792,561 $128,362,170 $4,582,268 $2,494,860 $11,192,724
($1,193,769) ($746,822) ($1,300,915) ($257,821) ($580,674) ($29,956) ($1,516,059) ($2,192,057) ($484,895) ($87,076) ($170,855) ($3,770,742) ($194,765) ($81,313) ($812,380) ($2,648,387) ($67,578) ($147,606) ($790,091) ($601,988) ($179,811) ($178,169) ($4,878,639) ($4,779,967) ($552,905) ($422,778) ($344,284) ($80,986) ($38,918) ($1,744,235) ($104,248) ($217,359) ($343,061)
Current Law (SB 1 HB 3646 - FY13 821CS) FY13 Total M&O Revenue per HB 3646 WADA $5,241 $5,322 $5,103 $5,105 $5,731 $5,457 $5,287 $5,203 $5,396 $6,014 $5,105 $5,173 $5,050 $4,438 $5,540 $5,266 $5,421 $4,681 $5,138 $5,221 $5,465 $5,249 $5,365 $5,682 $11,052 $5,404 $4,944 $6,013 $5,130 $5,259 $5,147 $5,191 $5,499
FY13
Change in Total Total M&O M&O Revenue Revenue per HB per HB3646 3646 WADA WADA $5,624 $5,806 $5,531 $5,568 $5,953 $5,536 $5,789 $5,332 $5,473 $6,570 $5,537 $5,368 $5,475 $4,812 $6,074 $5,654 $5,946 $5,088 $5,625 $5,710 $5,776 $5,731 $5,868 $6,185 $12,051 $5,880 $5,298 $6,245 $5,203 $5,332 $5,267 $5,687 $5,673
($382) ($484) ($428) ($462) ($222) ($79) ($502) ($130) ($77) ($556) ($432) ($195) ($426) ($374) ($534) ($388) ($524) ($407) ($487) ($490) ($311) ($482) ($502) ($503) ($999) ($476) ($354) ($232) ($73) ($72) ($120) ($495) ($174)
Page 36 of 38
Comparison of Total M&O Revenue for School Districts and Charter Schools - LBB Model 887 FISCAL YEAR 2013 Note: All figures below are estimates and are subject to change based on actual and final student counts, property values, and tax effort. Amounts reflect available statewide estimates and may differ from local projections. M&O revenue amounts below are based on district entitlement for a full year, and do not reflect a payment deferral or any other actual or potential change to the distribution schedule of that entitlement.
Fiscal Year 2013 District Name
WEST ORANGE-COVE CISD WEST OSO ISD WEST RUSK ISD WEST SABINE ISD WESTBROOK ISD WESTHOFF ISD WESTLAKE ACADEMY CHARTER SCHOO WESTPHALIA ISD WESTWOOD ISD WHARTON ISD WHEELER ISD WHITE DEER ISD WHITE OAK ISD WHITE SETTLEMENT ISD WHITEFACE CISD WHITEHOUSE ISD WHITESBORO ISD WHITEWRIGHT ISD WHITHARRAL ISD WHITNEY ISD WICHITA FALLS ISD WILDORADO ISD WILLIAMS PREPARATORY WILLIS ISD WILLS POINT ISD WILSON ISD WIMBERLEY ISD WINDTHORST ISD WINFIELD ISD WINFREE ACADEMY CHARTER SCHOOL WINK-LOVING ISD WINNSBORO ISD WINONA ISD
Legislative Budget Board - Model 887
County District Number
County Name
181906 178915 201914 202905 168903 062905 220810 073904 001908 241904 242903 033904 092908 220920 040902 212906 091909 091910 110908 109911 243905 180904 057842 170904 234907 153907 105905 005904 225905 057828 248902 250907 212910
ORANGE NUECES RUSK SABINE MITCHELL DEWITT TARRANT FALLS ANDERSON WHARTON WHEELER CARSON GREGG TARRANT COCHRAN SMITH GRAYSON GRAYSON HOCKLEY HILL WICHITA OLDHAM DALLAS MONTGOMERY VAN ZANDT LYNN HAYS ARCHER TITUS DALLAS WINKLER WOOD SMITH
HB3646 WADA
3,336 2,928 1,299 992 332 122 863 225 2,166 2,937 638 563 1,735 7,477 519 5,462 1,997 1,112 308 2,011 17,320 182 961 8,198 3,449 239 2,489 726 338 2,067 521 1,781 1,484
Current Law (SB 1 821CS) - FY13
Total M&O Revenue
$16,784,648 $15,202,315 $7,327,697 $4,894,544 $4,155,114 $623,307 $4,496,557 $991,315 $11,688,559 $15,488,289 $3,699,186 $3,307,170 $9,100,300 $39,064,357 $4,870,455 $28,316,072 $11,264,025 $6,130,531 $1,849,006 $11,259,623 $89,554,277 $943,466 $5,005,352 $43,735,306 $17,280,027 $1,319,020 $14,540,316 $4,069,836 $1,669,771 $11,009,963 $6,517,281 $9,950,051 $7,648,718
Fiscal Year: 2013
HB 3646 - FY13
FY13
Total M&O Revenue
Change in Total M&O Revenue
$18,245,699 $15,427,035 $8,020,927 $5,147,958 $4,548,538 $681,113 $4,930,170 $1,082,039 $12,671,872 $16,216,311 $4,053,867 $3,614,549 $9,697,363 $40,956,843 $5,311,602 $30,097,088 $11,713,868 $6,308,889 $2,013,780 $11,618,471 $92,111,223 $1,032,688 $5,473,883 $46,879,640 $18,076,298 $1,344,934 $15,926,837 $4,189,270 $1,695,861 $12,016,263 $7,110,577 $10,477,016 $8,092,363
($1,461,051) ($224,720) ($693,230) ($253,414) ($393,424) ($57,805) ($433,613) ($90,724) ($983,313) ($728,022) ($354,682) ($307,379) ($597,063) ($1,892,485) ($441,147) ($1,781,016) ($449,843) ($178,359) ($164,774) ($358,848) ($2,556,946) ($89,222) ($468,531) ($3,144,334) ($796,271) ($25,915) ($1,386,521) ($119,435) ($26,090) ($1,006,300) ($593,296) ($526,965) ($443,645)
Current Law (SB 1 HB 3646 - FY13 821CS) FY13 Total M&O Revenue per HB 3646 WADA $5,031 $5,193 $5,641 $4,936 $12,527 $5,127 $5,210 $4,408 $5,397 $5,273 $5,797 $5,872 $5,245 $5,225 $9,383 $5,184 $5,641 $5,515 $5,994 $5,599 $5,171 $5,175 $5,211 $5,335 $5,009 $5,523 $5,841 $5,607 $4,940 $5,327 $12,509 $5,585 $5,155
FY13
Change in Total Total M&O M&O Revenue Revenue per HB per HB3646 3646 WADA WADA $5,469 $5,269 $6,175 $5,192 $13,713 $5,603 $5,713 $4,812 $5,851 $5,521 $6,353 $6,418 $5,589 $5,478 $10,232 $5,510 $5,867 $5,675 $6,528 $5,777 $5,318 $5,665 $5,698 $5,718 $5,240 $5,632 $6,398 $5,772 $5,018 $5,814 $13,648 $5,881 $5,454
($438) ($77) ($534) ($256) ($1,186) ($476) ($502) ($403) ($454) ($248) ($556) ($546) ($344) ($253) ($850) ($326) ($225) ($160) ($534) ($178) ($148) ($489) ($488) ($384) ($231) ($109) ($557) ($165) ($77) ($487) ($1,139) ($296) ($299)
Page 37 of 38
Comparison of Total M&O Revenue for School Districts and Charter Schools - LBB Model 887 FISCAL YEAR 2013 Note: All figures below are estimates and are subject to change based on actual and final student counts, property values, and tax effort. Amounts reflect available statewide estimates and may differ from local projections. M&O revenue amounts below are based on district entitlement for a full year, and do not reflect a payment deferral or any other actual or potential change to the distribution schedule of that entitlement.
Fiscal Year 2013 District Name
WINTERS ISD WODEN ISD WOLFE CITY ISD WOODSBORO ISD WOODSON ISD WOODVILLE ISD WORTHAM ISD WYLIE ISD (Collin) WYLIE ISD (Taylor) YANTIS ISD YES PREPARATORY PUBLIC SCHOOLS YOAKUM ISD YORKTOWN ISD YSLETA ISD ZAPATA COUNTY ISD ZAVALLA ISD ZEPHYR ISD ZOE LEARNING ACADEMY Statewide Totals
Legislative Budget Board - Model 887
County District Number
County Name
200904 174906 116909 196902 224902 229903 081905 043914 221912 250905 101845 062903 062904 071905 253901 003906 025906 101850
RUNNELS NACOGDOCHES HUNT REFUGIO THROCKMORTON TYLER FREESTONE COLLIN TAYLOR WOOD HARRIS DEWITT DEWITT EL PASO ZAPATA ANGELINA BROWN HARRIS
HB3646 WADA
Current Law (SB 1 821CS) - FY13
Total M&O Revenue
HB 3646 - FY13
FY13
Total M&O Revenue
Change in Total M&O Revenue
Current Law (SB 1 HB 3646 - FY13 821CS) FY13 Total M&O Revenue per HB 3646 WADA
FY13
Change in Total Total M&O M&O Revenue Revenue per HB per HB3646 3646 WADA WADA
1,064 1,189 927 778 245 1,966 793 16,131 3,794 577 8,315 2,070 828 56,912 4,702 724 349 789
$5,607,990 $5,935,770 $4,966,084 $4,382,417 $1,381,852 $11,706,541 $4,072,026 $91,531,575 $20,157,600 $3,398,977 $43,319,810 $10,640,800 $4,209,454 $311,100,475 $31,311,415 $3,850,116 $1,789,743 $4,075,618
$6,123,571 $6,259,262 $5,142,648 $4,569,662 $1,473,590 $12,804,123 $4,459,191 $97,871,376 $21,921,933 $3,710,429 $47,390,637 $11,056,264 $4,499,625 $315,641,293 $34,289,464 $3,904,163 $1,814,148 $4,453,377
($515,580) ($323,492) ($176,564) ($187,245) ($91,739) ($1,097,582) ($387,165) ($6,339,800) ($1,764,334) ($311,452) ($4,070,827) ($415,464) ($290,170) ($4,540,818) ($2,978,049) ($54,047) ($24,405) ($377,759)
$5,270 $4,993 $5,359 $5,635 $5,645 $5,953 $5,138 $5,674 $5,314 $5,887 $5,210 $5,141 $5,087 $5,466 $6,659 $5,321 $5,131 $5,164
$5,755 $5,265 $5,550 $5,876 $6,020 $6,511 $5,627 $6,067 $5,779 $6,427 $5,699 $5,342 $5,437 $5,546 $7,292 $5,396 $5,201 $5,643
($485) ($272) ($191) ($241) ($375) ($558) ($489) ($393) ($465) ($539) ($490) ($201) ($351) ($80) ($633) ($75) ($70) ($479)
6,324,686
34,101,912,724
36,114,094,393
(2,012,181,669)
$5,392
$5,710
($318)
Fiscal Year: 2013
Page 38 of 38