Biological Journal of the Linnean Society, 2009, 98, 646–660. With 8 figures
Ecological and evolutionary factors in the morphological diversification of South American spiny rats S. IVAN PEREZ1,2*, JOSÉ ALEXANDRE FELIZOLA DINIZ-FILHO3, F. JAMES ROHLF4 and SÉRGIO FURTADO DOS REIS1 1
Instituto de Biologia, Departamento de Biologia Animal, Universidade Estadual de Campinas, CP 6109, 13083-970, Campinas, São Paulo, Brazil 2 División Antropología, Museo de La Plata, Universidad Nacional de La Plata, CONICET, Paseo del Bosque s/n, 1900, La Plata, Argentina 3 Departamento de Biologia Geral, ICB, Universidade Federal de Goiás, CP 131, 74001-970, Goiânia, Goiás, Brazil 4 Department of Ecology and Evolution, State University of New York at Stony Brook, Stony Brook, NY 11794-5245, USA Received 5 March 2009; accepted for publication 21 May 2009
bij_1307
646..660
Understanding the processes underlying morphological diversification is a central goal in ecology and evolutionary biology and requires the integration of information about phylogenetic divergence and ecological niche diversity. In the present study, we use geometric morphometrics and comparative methods to investigate morphological diversification in Neotropical spiny rats of the family Echimyidae. Morphological diversification is studied as shape variation in the skull, comprising a structure composed of four distinct units: vault, base, orognathofacial complex, and mandible. We demonstrate association among patterns of variation in shape in different cranial units, levels of phylogenetic divergence, and ecological niche diversification. At the lower level of phylogenetic divergence, there is significant and positive concordance between patterns of phylogenetic divergence and cranial shape variation in all cranial units. This concordance may be attributable to the phylogenetic and shape distances being calculated between species that occupy the same niche. At higher phylogenetic levels of divergence and with ecological niche diversity, there is significant concordance between shape variation in all four cranial units and the ecological niches. In particular, the orognathofacial complex revealed the most significant association between shape variation and ecological niche diversity. This association may be explained by the great functional importance of the orognathofacial complex. © 2009 The Linnean Society of London, Biological Journal of the Linnean Society, 2009, 98, 646–660.
ADDITIONAL KEYWORDS: adaptive radiation – comparative method – echimyid rodents – geometric morphometrics – natural selection – semilandmarks.
INTRODUCTION Understanding the origin and maintenance of diversity remains a central goal for ecology and evolutionary biology (Levin, 1999; Barton et al., 2007). The initial condition of the process of biological diversification is a potentially uniform system: an ancestral *Corresponding author. E-mail:
[email protected]
646
lineage that branches out as evolutionary independent units (i.e. species) under the influence of endogenous and exogenous forces (Levin, 1999; Schluter, 2000). As observed by Levin & Pacala (1997: 271), the evolutionary branching process results in scale displacement, in that ‘each species experiences the environment at its own unique set of spatial and temporal scales and interfaces the biota through unique assemblages of phenotypes’. The process of diversification is
© 2009 The Linnean Society of London, Biological Journal of the Linnean Society, 2009, 98, 646–660
DIVERSIFICATION IN ECHIMYID RODENTS therefore multiscale and takes place simultaneously across the dimensions of lineage multiplication, phenotypic differentiation, and ecological exploration of an array of environments (Levin, 1999; Schluter, 2000; Barton et al., 2007). A fundamental property of multiscale phenomena such as the process of diversification is that each relevant dimension will show characteristic variability (Levin, 1992). Consequently, complex interactions between variable rates of speciation, the potential for phenotypic differentiation, and the capacity to respond to ecological challenges will determine the nature of the association between phylogenetic relationships, the magnitude of phenotypic variation, and the degree of ecological diversification. As is the case with any historical, evolutionary process, the form of this association may take a continuum of possibilities, from complete concordance to the lack thereof (Sober, 1988). The investigation of the nature of this association requires information on the three relevant dimensions. First, phylogenetic relationships can be inferred from the dynamics of state changes in molecules, which involve the replacement of nucleotides over time with rates that are variable and dependent over nucleotide sites (Yang, 2006), using maximum likelihood, Bayesian, or evolutionary distance based methods (Lemey, Salemi & Vandamme, 2009). Second, the magnitude of phenotypic differentiation can be measured from complex morphological structures, which are generated by the processes of morphogenesis and pattern formation (Wolpert, 1996; Carroll, 2005; Murray, 2007), using the geometric morphometric formalism, which quantifies shape variation in complex morphologies (Bookstein, 1991). Finally, the outcome of ecological diversification is defined in terms of the ecological niche (Hutchinson, 1959). This fundamental concept unifies three important aspects: the environmental conditions necessary for persistence of species in space and time; the functional roles of species in food webs and trophic chains; and the dynamics of interactions, which, together with abiotic requirements, defines the position of a species within an ecosystem (Schluter, 2000; Chase & Leibold, 2003). For any given lineage, the integration of information about phylogenetic divergence and phenotypic variation in complex morphological structures with that of ecological diversity (Schluter, 2000; Butler, Sawyer & Losos, 2007; Clabaut et al., 2007) is necessary when assessing the nature of the association between the genealogic, phenotypic, and ecological dimensions (Sober, 1988). Such integration entails questions of detection and a description of pattern, and represents a critical initial step for testing hypotheses about the processes of biological diversification (Levin, 1992; Schluter, 2000).
647
Although ecomorphological studies have suggested that morphological variation is correlated with ecological variation (Losos et al., 1998; Schluter, 2000; Harmon et al., 2005), several studies have demonstrated a concordance between phylogenetic relationships and morphology as well (Polly, 2001; Lockwood, Kimbel & Lynch, 2004). Morphological diversification has been widely investigated across several primate families (Lockwood et al., 2004; Cardini & Elton, 2008), but relatively little work has been performed for other mammalian taxonomic groups, such as rodents. South American spiny rats of the family Echimyidae represent an excellent reference system for investigating morphological diversification in relation to ecological and phylogenetic factors. This family represents a major radiation within the suborder Caviomorpha encompassing 18 genera and approximately 80 species. Starting from a putative forest ground-dwelling ancestor, rapid evolutionary diversification in the Middle Miocene, approximately 13 Mya, produced a striking ecological diversity, with echimyids occupying semi-fossorial, terrestrial, semiaquatic, and arboreal niches (Emmons & Feer, 1997; Eisenberg & Redford, 1999; Galewski et al., 2005). The phylogeny of the Echimyidae was recently estimated by Galewski et al. (2005) using nuclear and extranuclear nucleotide sequences, and demonstrated strong support for the monophyly of this lineage (Galewski et al., 2005; Fig. 1). In the present study, morphological variation is studied as shape variation in the skull, comprising a complex functional and morphological structure composed of four developmentally distinct units: vault, base, orognathofacial complex, and mandible (Sperber, 2001; Willmore et al., 2006; Hallgrímsson et al., 2007). These units are defined in terms of the origin of the developmental tissue, mode of ossification, growth rate, spatial position, and function (Lieberman, Pearson & Mowbray, 2000; Sperber, 2001; Opperman, Gakunga & Carlson, 2005; Hallgrímsson et al., 2007). We predict that species that have independently come to occupy the same ecological niche share a similar cranial shape independent of phylogenetic relationships as a result of ecological factors acting on morphological diversification (Losos et al., 1998; Schluter, 2000; Harmon et al., 2005). The alternative hypothesis is that cranial shape variation is associated only with phylogenetic relationships. However, the four skull units are also relatively independent during ontogeny and are expected to respond differently to ecological and evolutionary factors (Cheverud, 1995; Lieberman et al., 2000; Hallgrímsson et al., 2007). Therefore, we also expect that variation in the shape of the base, which is the most conserved region of the skull (Sperber, 2001), will be most closely associated with phylogenetic
© 2009 The Linnean Society of London, Biological Journal of the Linnean Society, 2009, 98, 646–660
648
S. I. PEREZ ET AL.
Figure 1. Phylogenetic tree for the Echimyidae combining von Willebrand factor, cytochrome b, 12 S, and 16 S rRNAs sequences. Tree defined by Galewski et al. (2005).
relationships (Lockwood et al., 2004). On the other hand, the orognathofacial complex and mandible, which is more related to ecological factors (Cheverud, 1995; Sperber, 2001; Collard & Wood, 2007), will show greater association with the ecological niche.
ary sexual dimorphism was negligible in these taxa compared to the shape variation among genera.
CRANIAL
REGIONS, LANDMARKS,
AND SEMILANDMARKS
MATERIAL AND METHODS SAMPLES The 11 genera (and 15 species) examined were chosen primarily for two reasons. First, because they are a representative sample of the ecological and morphological diversity known to exist in the Echimyidae (Woods et al., 1992; Emmons & Feer, 1997). Second, because they are represented in the molecular phylogeny of Galewski et al. (2005). Five ecological niches as defined in Galewski et al. (2005) are represented: (1) semi-fossorial niche: Clyomys laticeps (N = 6) and Euryzygomatomys spinosus (N = 4); (2) grounddwelling, terrestrial niche: Trinomys sp., Proechimys sp. (N = 4), and Thrichomys apareoides (N = 8); (3) semi-aquatic niche: Myocastor coypus (N = 5); (4) arboreal niche: Phylomys blainvilii (N = 6), Makalata didelphoides (N = 4), and Mesomys hispidus (N = 3); (5) arboreal-bamboo niche: Dactylomys sp. (N = 4) and Kannabateomys amblyonyx (N = 7). Within the genus Trinomys, we examined the species: Trinomys dimidiatus (N = 5), Trinomys eliasi (N = 4), Trinomys iheringi (N = 5), Trinomys paratus (N = 4), and Trinomys setosus (N = 5). The specimens included in the study were adults defined by the presence of a developed third molar with formed occlusal surfaces. Males and females were pooled in the analyses because second-
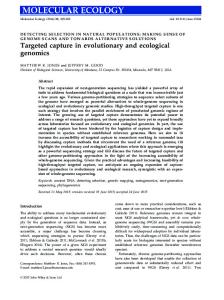
The four cranial units defined in this work are: cranial vault (i.e. formed by the frontal and parietal bones); cranial base (i.e. composed of the auditory bulla, basisphenoid, the condylar portion of occipital, and basioccipital bones); orognathofacial complex [i.e. composed of the premaxilla, maxilla, jugal, squamosal and temporal bones, including zygomatic, temporal (regions most directly affected by the masseter and temporal muscles), alveolar, olfactory, and respiratory regions]; mandible (i.e. consisting of condylar, coronoid, angular, masseter, anterior and posterior alveolar components) (Ackermann & Cheverud, 2004; Hallgrímsson et al., 2007; Fig. 2). For each specimen, we used an Olympus SP-350 digital camera to obtain images of the skulls. Images were standardized for skull position, camera lens plane, and camera lens–skull distance. The standardized images were used to capture two-dimensional coordinates in dorsal (vault), lateral (orognathofacial complex), and ventral (base) views. Mandible images were captured as two-dimensional coordinates in the lateral view (Fig. 2). We recorded coordinates for eight landmarks and 12 semilandmarks describing vault bones in the dorsal view (Fig. 2A), 13 landmarks and ten semilandmarks describing the base bones in the ventral view (Fig. 2B), 21 landmarks and 27 semilandmarks describing orognathofacial complex bones in
© 2009 The Linnean Society of London, Biological Journal of the Linnean Society, 2009, 98, 646–660
DIVERSIFICATION IN ECHIMYID RODENTS
649
careful choice of landmarks, two-dimensional landmarks are fairly accurate descriptors of size and shape variation of inherently three-dimensional structures such as the mammalian skull.
STATISTICAL
Figure 2. Dorsal (A), ventral (B), lateral (C), and mandible (D) views of the skull of Trinomys. Dots represent landmarks and crosses represent semilandmarks.
the lateral view (Fig. 2C), and 17 landmarks and 17 semilandmarks describing the mandible in the lateral mandible view (Fig. 2D). Coordinates of landmarks and semilandmarks were recorded using the tpsDIG, version 2.10 (Rohlf, 2007). In the present study, we chose to describe the four cranial units based on configurations of landmarks and semilandmarks obtained from two-dimensional images, following Cardini & Thorington’s (2006) demonstration of statistically significant correlations between measurements of size and shape using two-dimensional (dorsal, lateral, and ventral sides) and threedimensional landmarks of the skull of Marmota. Cardini & Thorington (2006) concluded that, given a
ANALYSIS
The correspondence between cranial shape variation, phylogenetic relationships, and ecological niches was investigated by approaches using Mantel tests, ordination, and regression. The landmark and semilandmark data sets for each cranial unit were used to calculate Procrustes distances between species. The effects of differences in location, scaling, and orientation over landmark and semilandmark configurations were removed with a generalized Procrustes analysis (Rohlf & Slice, 1990; Bookstein, 1991). The skull semilandmarks were aligned by means of the sliding semilandmark method sensu Bookstein (1997); see also Perez, Bernal & Gonzalez (2006). We used tpsRelw, version 1.44 (Rohlf, 2007) to slide the semilandmarks along their respective curves, aiming to minimize the Procrustes distance between the subject and a reference (Bookstein et al., 2002; Perez et al., 2006). Using the aligned coordinates, the Procrustes shape distances were calculated between the consensus configurations of landmarks and semilandmarks for each species (Polly, 2001; Smith, Terhune & Lockwood, 2007; Cardini & Elton, 2008) using tpsSmall, version 1.19 (Rohlf, 2007). Procrustes distance matrices describe the total pattern of variation in cranial shape among species. Although previous studies have used both Mahalanobis and Procrustes distances (Polly, 2001; Smith et al., 2007; Cardini & Elton, 2008), we only used Procrustes distances. Procrustes distances measure the amount of morphological differences between mean shapes, whereas Mahalanobis distances measure the statistical distinctness of two groups using shape means and pooled within-group covariance matrices (Ackermann, 2005; Klingenberg & Monteiro, 2005). This assumes that all groups have similar covariance structures and such an assumption could be not valid for our shape data (Steppan, Houle & Phillips, 2002). For Procrustes distance estimations, the differences in samples sizes (particularly small sample sizes) and covariance structures between species have little influence (Polly, 2003). We tested for correspondence by calculating the association between shape (Procrustes distances) matrices for the four cranial units and phylogenetic distance matrix using a Mantel analysis (Mantel, 1967). This procedure was used to compare our results with those from previous studies (Polly, 2001; Harvati & Weaver, 2006; Cardini & Elton, 2008). The matrix of phylogenetic distances (i.e. patristic distances)
© 2009 The Linnean Society of London, Biological Journal of the Linnean Society, 2009, 98, 646–660
650
S. I. PEREZ ET AL.
Table 1. Results of Mantel tests for analyses of association between Procrustes shape distances, molecular phylogenetic distances, and ecological niches for the four cranial units
Vault Base Orognathofacial complex Mandible
r Phylogeny
r Partial ecology
0.243* 0.237* 0.449** 0.409**
0.586** 0.529** 0.631** 0.381**
r Phylogeny is the correlation coefficient between Procrustes and phylogenetic distances. r Partial ecology is the partial correlation coefficient between Procrustes and the ecological niche matrices with phylogenetic distance held constant. *P ª 0.05, **P < 0.01.
between the Echimyid species was calculated from the maximum likelihood tree generated using a gene supermatrix combining the von Willebrand factor, cytochrome b, 12 S and 16 S rRNAs markers of Galewski et al. (2005). In addition, to determine whether the degree of scatter increased with phylogenetic distance, we performed Mantel analyses against two phylogenetic distance classes (Legendre & Fortin, 1989). Permutation tests for the matrix correlation estimates were calculated with 9999 replications for a one-tailed significance test. Mantel analyses were performed using NTSYSpc, version 2.1. The orognathofacial complex and the mandible showed correlations of 0.449 and 0.409, respectively, and were significant at the 0.01 level (Table 1). Thus, to take phylogenetic effects into account, we included the phylogenetic relationships among echimyid rodents in the remainder of the analyses (Losos, 1999; Garland, Bennett & Rezende, 2005). We tested the ecological concordance in each of the four cranial units. We studied the concordance between the shape (Procrustes distance) matrix for each cranial structure with ecological niche differences using a partial Mantel test (Smouse, Long & Sokal, 1986; Legendre & Fortin, 1989). This analysis tests whether the cranial structures correspond to the five ecological niche categories. We used the partial Mantel test to enable our results to be compared with previous studies in the morphometric literature, although we note that the partial correlation is only a linear correction and does not correspond to performing a phylogenetic generalized least-squares (PGLS; Rohlf, 2001) analysis (as explained below). We generated the ecological niche differences matrix by setting each element equal to one if the two species being compared occupied different ecological niches and zero if they occupied the same ecological niche.
Partial Mantel analyses were performed using NTSYSpc, version 2.1, using 9999 random permutations for a one-tailed significance test. The aligned coordinates were used to perform a Relative Warp (RW) analysis. The method of RWs describes the major trends in variation in cranial shape among species (Bookstein, 1991; Rohlf, 1993, 1996). RWs are principal components of the total shape variation. This includes variation at all spatial scales. An important aspect of this analysis is that variation along the principal component axes can be expressed as intuitive deformation grid diagrams showing differences from the mean form or reference. In addition, RWs can be interpreted as low dimensional axes of Kendall tangent space, proving excellent results when between-group morphological differences are studied (Thalib, Kitching & Bhatti, 1999). The analyses were performed using the tpsRelw, version 1.44 (Rohlf, 2007). A Kernel cluster analysis (Browman & Foster, 1963; Baxter, Beardah & Wright, 1997) was used to visualize the distribution of shape variation in the reduced space of the first and second RWs. Between 73% and 92% of total variation in shape was accounted for by just two dimensions. This was demonstrated by a Procrustes analysis (Peres-Neto & Jackson, 2001) between the first two RWs and all RWs for the vault, base, orognathofacial complex, and mandible, which yielded significant associations of 0.810, 0.914, 0.729, and 0.840, respectively (P < 0.001). These clusters were then inspected for concordance with phylogenetic clades and ecological niches (Fig. 1). Kernel analysis was performed using the KernSmooth, version 2.22 , for R 2.5.0 (R-Development Core Team, 2008). Finally, as an alternative test for ecological niche correspondence, we employed a regression approach using the phylogenetic generalized least-squares analysis to take into account the expected lack of independence in observations as a result of phylogeny (Martins & Hansen, 1997; Rohlf, 2001). We fitted the ecological niche variation (dummy variables defining niche memberships) to the RW scores describing shape variation using the following regression model: S = XB + e, where S is the RW scores matrix describing shape variation, X is the matrix of independent variables, B is the matrix of regression coefficients, and e is the error term. To account for phylogenetic non-independence, PGLS assumes that e has a covariance matrix derived from the phylogenetic tree (Martins & Hansen, 1997; Rohlf, 2001). In a conventional regression analysis, e is assumed to be independent. We used a phylogenetic covariance matrix based on the Ornstein–Uhlenbeck model (DiazUriarte & Garland, 1996; Martins & Hansen, 1997). When a phylogenetic covariance matrix based on the
© 2009 The Linnean Society of London, Biological Journal of the Linnean Society, 2009, 98, 646–660
DIVERSIFICATION IN ECHIMYID RODENTS assumption that evolution is a continuous Brownian motion type of random walk was used (Rohlf, 2001), the results did not change the interpretation. Because of the large number of semilandmarks employed to describe the specimens, we used a matrix of the first two RW scores (RW1 + 2) to test the effects of ecological niche on shape (Sheets et al., 2006). The significance of the regression model was assessed by the F-statistic. PGLS analyses were performed using NTSYSpc, version 2.1.
RESULTS Mantel analyses showed small but significant correlations between molecular phylogenetic distances and Procrustes shape distances derived from the orognathofacial complex and mandible. The correlations between phylogenetic distances and shape distances for the cranial vault and base were even smaller, but still statistically significant (Table 1). The correspondence between Procrustes shape and phylogenetic distances was significant for all cranial units at low phylogenetic scales (less than 0.20 units of expected nucleotide substitutions; Table 2). Conversely, the correspondence was small for all cranial units at high phylogenetic scales (more than 0.20 units of expected nucleotide substitutions; Table 2), showing a characteristic fan distribution (Fig. 3). The partial Mantel analysis demonstrated that the Procrustes shape distances for the four cranial units show significant concordance with the ecological niche matrix (Table 1). The orognathofacial complex, in particular, showed the greatest concordance between Procrustes shape distances and ecological niche (Table 1). The two-dimensional ordination of the 15 echimyid species based on shape variation for the cranial vault is shown in Figures 4A and 5A, where each species is represented by its mean value on the first and second RWs. The Kernel analysis showed three clusters on the two-dimensional ordination generated from the RW analysis, which corresponds to: the semi-fossorial niche and clade D; the terrestrial and arboreal niches
and clades A, B, and C; and the arboreal-bamboo and semi-aquatic niches and clades A and B (Fig. 4A). The deformation grid showed shape variation in both the parietal and frontal bones of the cranial vault, with deformations being global in the former and localized in the latter (Fig. 5B). Of the six kernel clusters generated for the cranial base, only two corresponded uniquely with ecological niches, namely the semiaquatic and arboreal-bamboo niches (Figs 4B, 6A). The observed clusters did not correspond to the phylogenetic clades (Fig. 4B). Deformation grids indicated that shape variation is primarily localized in the bulla region of the base (Fig. 6B). The five kernel clusters obtained for the orognathofacial complex (Figs 4C, 7A) showed a one-to-one correspondence with the ecological niches (Fig. 4C). Of these five clusters, only one was uniquely associated with phylogenetic clade D (Fig. 4C). Shape variation was localized mainly in the zygomatic and premaxilla bones (Fig. 7B). Of the four kernel clusters computed for the mandible, only the semi-fossorial and semi-aquatic were uniquely associated with ecological niches (Figs 4D, 8A). Only one cluster was uniquely associated with phylogenetic clade D (Fig. 4D). Shape variation was localized mainly in the angular and coronid regions of the mandible (Fig. 8B). PGLS analyses demonstrated that the ecological niche has a significant effect on patterns of shape variation calculated with the first two RWs (RW 1 + 2) for all cranial regions (Table 3). However, this test is not very powerful because there are only 15 species, and the phylogeny in Figure 1 shows a number of correspondences with ecology, which means that ecology and phylogeny are not truly independent. The F-statistics and associated P-values were larger for the orognathofacial complex, in agreement with the Kernel analysis based on the projection of the first two relative warps (Fig. 4C).
Table 3. Multivariate multiple regression of the ecological niche on shape variation for the four cranial units with the lack of independence due to phylogeny taken into account
Table 2. Mantel analyses against two phylogenetic distance classes (lags) for the four cranial units
RW 1 + 2
r Phylogeny
Lag
Vault
Base
Orognathofacial complex
0.074 0.222
0.447* -0.382*
0.334* -0.259
0.419* -0.197
Mandible 0.283* -0.049
r, correlation coefficient. *P < 0.025 (Bonferroni correction for a 0.05/2).
651
Vault Base Orognathofacial complex Mandible
F
P
34.094 15.854 74.346 12.777
3.566E-008 1.011E-005 6.095E-011 4.223E-005
Shape is described using the first two relative warps scores (RW 1 + 2). The Ornstein–Uhlenbeck model was used to calculate the phylogenetic covariance matrix.
© 2009 The Linnean Society of London, Biological Journal of the Linnean Society, 2009, 98, 646–660
S. I. PEREZ ET AL.
0.20 0.15 0.05
0.10
Base Shape Distance
0.10 0.08 0.06 0.04
Vault Shape Distance
0.12
652
0.05
0.10
0.15
0.20
0.25
0.05
0.30
0.15
0.20
0.25
0.30
0.20 0.15 0.05
0.10
Mandible Shape Distance
0.14 0.12 0.10 0.08 0.06 0.04
Orog. complex Shape Distance
0.10
Phylogenetic Distance
Phylogenetic Distance
0.05
0.10
0.15
0.20
0.25
0.30
Phylogenetic Distance
0.05
0.10
0.15
0.20
0.25
0.30
Phylogenetic Distance
Figure 3. Scatter plot of Procrustes shape distances versus molecular phylogenetic distances among 15 echimyid species for the four cranial units.
DISCUSSION The results obtained in the present study demonstrate a complex association among patterns of cranial variation in shape, levels of phylogenetic divergence, and ecological niche diversification in spiny rats of the family Echimyidae. At the lower level of phylogenetic divergence (Fig. 3), there is small but statistically significant and positive concordance between patterns of phylogenetic and cranial shape variation in all cranial units: base, vault, orognathofacial complex, and mandible (Fig. 3; Table 2). This concordance may be attributable to the phylogenetic and shape distances being calculated between
species sampled from the same niche such as within ground-dwelling species of Trinomys, within semifossorial Clyomys and Euryzygomatomys, and within arboreal-bamboo rats, Dactylomys and Kannabateomys (Fig. 1). Similar associations between patterns of phylogenetic and morphological variation under conditions of ecological niche homogeneity have been reported at lower levels of phylogenetic divergence. At the population level, craniometric variation and evolutionary relationships (i.e. molecular variation at microsatellite loci) are concordant among human populations only when they occupy relatively homogeneous ecological niches (Roseman, 2004; Harvati & Weaver, 2006). At the species level, Polly (2001)
© 2009 The Linnean Society of London, Biological Journal of the Linnean Society, 2009, 98, 646–660
DIVERSIFICATION IN ECHIMYID RODENTS
A
Figure 4. Kernel density contours defining clusters in the two-dimensional space of the first two relative warps. Ecological niches and phylogenetic clades A–D are indicated (ecological niches and phylogenetic clades are defined in Fig. 1). A, Kernel analysis of the cranial vault. B, Kernel analysis of the cranial base. C, Kernel analysis of the orognathofacial complex. D, Kernel analysis of the mandible. 䉳
Terrestrial Semi-fossorial
Arboreal
D
A, B, C
A, B Arborealbamboo
Semi-aquatic
B
Arborealbamboo
A
Semi-aquatic Arboreal
B, C B
A
Terrestrial
B, D Terrestrial Semi-fossorial
D
Semi-fossorial
C Terrestrial
B, C
Arboreal
A
A
B
Arboreal-bamboo
D Semi-aquatic Semi-fossorial
D
Semi-fossorial
D Semi-aquatic
Arboreal
B
Terrestrial
A, B, C Arborealbamboo
Terrestrial
A, B Arboreal-bamboo
653
demonstrated a significant association between molar shape distance and phylogenetic divergence as estimated from cytochrome b sequences among seven closely-related shrews, which occupy a homogeneous trophic niche. Even at higher levels of phylogenetic divergence, the concordance between phylogenetic relationships and morphological variation may depend on the homogeneity of the ecological niche; in this case, the trophic niche, as recently demonstrated for murine rodents (Renaud, Chevret & Michaux, 2007). At higher phylogenetic levels of divergence (Fig. 3) and also with ecological niche diversity (i.e. semifossorial, terrestrial, semi-aquatic, arboreal-bamboo and arboreal niches; Fig. 1), there is significant concordance between shape variation in all four cranial units and the ecological niches (Tables 1, 3). Consequently, ecological factors are important when accounting for cranial shape variation among echimyid species. The observed concordance between shape variation in the vault and base and ecological niche diversity is nevertheless unexpected based on developmental dynamics. The vault and particularly the base are expected to have little interaction with the environment because they attain adult size and shape early during ontogeny and are related to brain protection, and the base is the site of passage for several vessels and nerves (Sperber, 2001; Opperman et al., 2005). Variation in the base of the skull among echimyid species is primarily associated with differences in the relative size of the auditory bulla, with the bulla being relatively larger in semi-fossorial species and followed in size by arboreal and terrestrial species (Fig. 6). It has been suggested that variation in bulla size is associated with the frequency of acoustic signals, with larger and smaller bullae being associated with rodents that employ low-frequency and high-frequency acoustic signals, respectively (Francescoli, 2000). The larger bulla volume could be interpreted as an adaptation for vocal communication or for detecting predators in subterranean environments (Francescoli, 2000; Schleich & Vassallo, 2003; Mason, 2004). Therefore, the association between morphological variation in the base and ecological niche diversity within Echimyidae appears to be attributable to variation in the form of the bulla as a
© 2009 The Linnean Society of London, Biological Journal of the Linnean Society, 2009, 98, 646–660
654
S. I. PEREZ ET AL.
A
0.050 T. apareoides
RW2 (25.07%)
0.024
-0.002
T. eliasi T. paratus
C. laticeps
E. spinosus
Proechimys sp. T. setosus T. iheringi
M. hispidus T. dimidiatus M. didelphoides P. blainvilii
-0.028
K. amblyonyx M. coypus
-0.054
-0.080 -0.080
Dactylomys sp.
-0.054
-0.028
-0.002
0.024
0.050
RW1 (40.67%)
B
RW1 -
RW1 +
RW2 -
RW2 +
Figure 5. Relative warps analysis of the cranial vault. A, ordination of the 15 echimyid species in the space of the first two relative warps (RW1 and RW2), calculated for the cranial vault. The dots represent the consensus individual for each species. B, cranial shape changes implied by variation along the first two relative warp axes are shown as deformation grids. Grids show shape changes for negative and positive deviations from the mean for RW1 and RW2.
result of ecological factors. It is quite conceivable that, in organisms that do not occupy as heterogeneous an array of ecological niches as the Echimyidae, variation in the base does associate with phylogenetic patterns of divergence. Indeed, in Primates, whose ecological niches are far less heterogeneous than those of the Echimyidae, an association between cranial base and phylogenetic variation has been reported for human populations (Harvati & Weaver, 2006), for apes and humans (Lockwood et al., 2004), and for species of guenons (Cardini & Elton, 2008). Conversely, in the case of the cranial vault, the unexpected association between shape variation among echimyid species and ecological niche may be a consequence of an indirect response to changes in other units of the skull. Evidence for this conjecture is provided by the observation that, in semi-fossorial and semi-aquatic species in which the parietal bone is
relatively small (Fig. 5), the temporal and squamosal bones, which are sites of insertion for muscles such as the masseter temporalis (Woods, 1972), are relatively large (Fig. 7). The concordance between shape variation in the orognathofacial complex and mandible and ecological niche diversity at high phylogenetic scales confirms our original expectation (Figs 7, 8; Tables 1, 3), which was based on developmental dynamics. The orognathofacial complex and mandible attain adult size and shape long after the basicranium and vault, and these regions of the skull are related to muscle insertion for the oromasticatory apparatus (Woods, 1972; Woods & Howland, 1979), as well as for the trophic and sensory apparatuses (Cheverud, 1995; Sperber, 2001). However, the orognathofacial complex and mandible differ in the extent that shape variation is associated with ecological niche diversity because the association
© 2009 The Linnean Society of London, Biological Journal of the Linnean Society, 2009, 98, 646–660
DIVERSIFICATION IN ECHIMYID RODENTS
A
0.10
655
K. amblyonyx Dactylomys sp.
0.05
T. dimidiatus
RW2 (29.82%)
M. coypus
T. iheringi P. blainvilii M. hispidus M. didelphoides T. paratus
Proechimys sp.
0.00
T. setosus
-0.05
T. apareoides
T. eliasi
E. spinosus C. laticeps
-0.10
-0.15 -0.15
-0.10
-0.05
0.00
0.05
0.10
RW1 (53.83%)
B
RW1 -
RW2 -
RW1 +
RW2 +
Figure 6. Relative warps analysis of the cranial base. A, ordination of the 15 echimyid species in the space of the first two relative warps (RW1 and RW2), calculated for the cranial base. The dots represent the consensus individual for each species. B, cranial shape changes implied by variation along the first two relative warp axes are shown as deformation grids. Grids show shape changes for negative and positive deviations from the mean for RW1 and RW2.
is complete in the former and partial in the latter (Figs 7, 8; Tables 1, 3). Shape variation in the orognathofacial complex is related to differences in squamosal, temporal, jugal and maxilla robusticity, premaxilla morphology, and orbit size (Fig. 7). Semifossorial species have the largest areas for muscle attachment, procumbent incisors and reduced orbit size, which are all skull features that are present in
digging species (Stein, 2000; Verzi & Olivares, 2006). It is worth noting that these same features are present in M. coypus which, besides occupying the semi-aquatic niche, is also semi-fossorial (Woods et al., 1992). On the other hand, arboreal and terrestrial species have relatively smaller areas for muscle attachment, lesser procumbent incisors, and increased orbit size (Fig. 7). Shape variation in the
© 2009 The Linnean Society of London, Biological Journal of the Linnean Society, 2009, 98, 646–660
656
S. I. PEREZ ET AL.
A
0.060 Proechimys sp. T. paratus T. iheringi T. apareoides T. eliasi M. didelphoides P. blainvilii M. hispidus Dactylomys sp.
RW2 (23.62%)
0.028
T. setosus T. dimidiatus
-0.004
K. amblyonyx
-0.036 M. coypus
C. laticeps
-0.068
E. spinosus
-0.100 -0.100
-0.068
-0.036
-0.004
0.028
0.060
RW1 (29.45%)
B
RW1 +
RW1 -
RW2 -
RW2 +
Figure 7. Relative warps analysis of the orognathofacial complex. A, ordination of the 15 echimyid species in the space of the first two relative warps (RW1 and RW2), calculated for the orognathofacial complex. The dots represent the consensus individual for each species. B, cranial shape changes implied by variation along the first two relative warp axes are shown as deformation grids. Grids show shape changes for negative and positive deviations from the mean for RW1 and RW2.
mandible separates the semi-fossorial and semiaquatic species on the basis of muscle insertion and articulation regions such as the condylar and angular (i.e. features related to digging activities; Fig. 8). However, there is no clear differentiation between arboreal and terrestrial taxa. The differences in the degree of association between orognathofacial complex and mandible and ecological niche diversity could be related to the greater complexity of function related to the former, suggesting that muscle insertion is not the only factor involved in the orognathofacial complex divergence. In addition, the mandible has a lower association with ecological niche than the cranial base and vault, which is unexpected based on developmental dynamics of these cranial regions. The
higher association of these cranial units with ecological niche diversity within Echimyidae could be related to the ecological importance of the cranial base and the correlated response of the cranial vault, such as that pointed out above. It is conceivable that, in organisms occupying heterogenous ecological niches, variation in the orognathofacial complex and mandible does correspond with ecological diversity (Monteiro & Reis, 2005; Renaud et al., 2007). In several mammalian taxa with different degrees of ecological niche heterogeneity, a correspondence between some dimensions of niches (e.g., hardness of food items) and cranial morphology has been reported (bats: Dumont, 1999; Nogueira et al., 2005; primates: Dumont, 1997).
© 2009 The Linnean Society of London, Biological Journal of the Linnean Society, 2009, 98, 646–660
DIVERSIFICATION IN ECHIMYID RODENTS
A
657
0.15
RW2 (17.28%)
0.12 0.09 E. spinosus
0.06
C. laticeps P. blainvilii
0.03 T. apareoides
M. coypus
M. didelphoides
0.00 K. amblyonyx T. dimidiatus T. iheringi T. eliasi M. hispidus -0.03 T. setosus T. paratus
Dactylomys sp. Proechimys sp.
-0.06 -0.06 -0.03 0.00 0.03 0.06 0.09 0.12 0.15
RW1 (53.44%)
B
RW1 -
RW1 +
RW2 -
RW2 +
Figure 8. Relative warps analysis of the mandible. A, ordination of the 15 echimyid species in the space of the first two relative warps (RW1 and RW2), based on the partial warp and uniform component variables calculated for the mandible. The dots represent the consensus individual for each species. B, cranial shape changes implied by variation along the first two relative warp axes are shown as deformation grids. Grids show shape changes for negative and positive deviations from the mean for RW1 and RW2.
In summary, the results obtained in the present study show that cranial shape variation is related to ecological factors acting on morphological diversification, in support of our original hypothesis. In addition, these results suggest that diversification among echimyid species may be the outcome of a complex interaction between morphology and niche dimensions. The importance of the environment in interspecific morphological diversification is well known
(Losos et al., 1998; Schluter, 2000; Harmon et al., 2005). A comparison of morphological variation, phylogenetic relationships, and niche divergence among echimyid species shows how the interaction between these dimensions evolves during clade diversification (Galewski et al., 2005). Although we cannot provide support for the hypothesis that morphology only shows a significant concordance with phylogeny, phylogenetic relationships are very important for
© 2009 The Linnean Society of London, Biological Journal of the Linnean Society, 2009, 98, 646–660
658
S. I. PEREZ ET AL.
explaining shape variation among ecologically homogeneous species. The results also suggest that, within Echymidae, time of growth cessation or patterns of growth (Cheverud, 1995) of the cranial units do not appear to be important predictors of final phenotypic diversification, as was shown for primates (Lockwood et al., 2004; Cardini & Elton, 2008). The differences in the morphological diversification between Echymidae and primates could be related to the greater ecological diversity of Echymidae.
ACKNOWLEDGEMENTS We thank J. A. de Oliveira (Museo Nacional, Rio de Janeiro, Brasil) for granting us access to the echimyid skeletal collections under his care. We are sincerely grateful to I. Olivares, V. Bernal, and E. G. Martins for their comments on previous versions of the manuscript. Two anonymous reviewers provided excellent comments that helped us to improve the content and clarity of the manuscript. Our research was supported by grants from Fundação de Amparo à Pesquisa do Estado de São Paulo (FAPESP). S. I. Perez is supported by a postdoctoral fellowship from FAPESP. J. A. F. Diniz-Filho and S. F. dos Reis are partially supported by research fellowships from the Conselho Nacional de Desenvolvimento Científico e Tecnológico.
REFERENCES Ackermann RR. 2005. Variation in Neandertals: a response to Harvati (2003). Journal of Human Evolution 48: 643– 646. Ackermann RR, Cheverud JM. 2004. Morphological integration in primate evolution. In: Pigliucci M, Preston K, eds. Phenotypic integration: studying the ecology and evolution of complex phenotypes. Oxford: Oxford University Press, 302– 319. Barton NH, Briggs DEG, Eisen JA, Goldstein DB, Patel NH. 2007. Evolution. New York, NY: Cold Spring Harbor Laboratory Press. Baxter MJ, Beardah CC, Wright RVS. 1997. Some archaeological applications of kernel density estimates. Journal of Archaeological Science 24: 347–354. Bookstein FL. 1991. Morphometric tools for landmark data: geometry and biology. Cambridge: Cambridge University Press. Bookstein FL. 1997. Landmark methods for forms without landmarks: localizing group differences in outline shape. Medical Image Analysis 1: 225–243. Bookstein FL, Streissguth AP, Sampson PD, Connor PD, Barr HM. 2002. Corpus callosum shape and neuropsychological deficits in adult males with heavy fetal alcohol exposure. NeuroImage 15: 233–251. Browman A, Foster P. 1963. Density based exploration of bivariate data. Statistics and Computing 3: 171–177.
Butler MA, Sawyer SA, Losos JB. 2007. Sexual dimorphism and adaptive radiation in Anolis lizards. Nature 447: 202–205. Cardini A, Elton S. 2008. Does the skull carry a phylogenetic signal? Evolution and modularity in the guenons. Biological Journal of the Linnean Society 93: 813–834. Cardini A, Thorington RW Jr. 2006. Postnatal ontogeny of marmot (Rodentia, Sciuridae) crania: allometric trajectories and species divergence. Journal of Mammalogy 87: 201– 215. Carroll SB. 2005. Endless forms most beautiful: The new science of evo devo and the making of the animal kingdom. New York, NY: WW Norton & Company. Chase JM, Leibold MA. 2003. Ecological niches: linking classical and contemporary approaches. Chicago, IL: University of Chicago Press. Cheverud J. 1995. Morphological integration in the saddleback tamarin (Saguinus fuscicollis) cranium. American Naturalist 145: 63–89. Clabaut C, Bunje PME, Salzburger W, Meyer A. 2007. Geometric morphometric analyses provide evidence for the adaptive character of the tanganyikan cichlid fish radiations. Evolution 61: 560–578. Collard M, Wood B. 2007. Hominin homoiology: an assessment of the impact of phenotypic plasticity on phylogenetic analyses of humans and their fossil relatives. Journal of Human Evolution 52: 573–584. Diaz-Uriarte R, Garland T Jr. 1996. Testing hypotheses of correlated evolution using phylogenetically independent contrasts: sensitivity to deviations from Brownian motion. Systematic Biology 45: 27–47. Dumont ER. 1997. Cranial shape in fruit, nectar, and exudate feeders: implications for interpreting the fossil record. American Journal of Physical Anthropology 102: 187–202. Dumont ER. 1999. The effect of food hardness on feeding behaviour in frugivorous bats (Phyllostomidae): an experimental study. Journal of Zoology (London) 248: 219–229. Eisenberg JF, Redford KH. 1999. Mammals of the neotropics: the central Neotropics. Chicago, IL: University of Chicago Press. Emmons L, Feer F. 1997. Neotropical rainforest mammals: a field guide. Chicago. IL: University of Chicago Press. Francescoli G. 2000. Sensory capabilities and communication in subterranean rodents. In: Lacey AE, Patton JL, Cameron GN, eds. Life underground. The biology of subterranean rodents. Chicago, IL: University of Chicago Press, 111–144. Galewski T, Mauffrey JF, Leite YLR, Patton JL, Douzery EJP. 2005. Ecomorphological diversification among South American spiny rats (Rodentia: Echimyidae): a phylogenetic and chronological approach. Molecular Phylogenetics and Evolution 34: 601–615. Garland T Jr, Bennett AF, Rezende EL. 2005. Phylogenetic approaches in comparative physiology. Journal of Experimental Biology 208: 3015–3035. Hallgrímsson B, Lieberman DE, Liu W, FordHutchinson A, Jirik FR. 2007. Epigenetic interactions
© 2009 The Linnean Society of London, Biological Journal of the Linnean Society, 2009, 98, 646–660
DIVERSIFICATION IN ECHIMYID RODENTS and the structure of phenotypic variation in the cranium. Evolution and Development 9: 76–91. Harmon LJ, Kolbe JJ, Cheverud JM, Losos JB. 2005. Convergence and the multidimensional niche. Evolution 59: 409–421. Harvati K, Weaver TD. 2006. Human cranial anatomy and the differential preservation of population history and climate signatures. Anatomical Record Part A 288A: 1225– 1233. Hutchinson GE. 1959. Homage to Santa Rosalia or why are there so many kinds of animals? American Naturalist 93: 145–159. Klingenberg CP, Monteiro LR. 2005. Distances and directions in multidimensional shape spaces: implications for morphometric applications. Systematic Biology 54: 678–688. Legendre P, Fortin MJ. 1989. Spatial pattern and ecological analysis. Vegetatio 80: 107–138. Lemey M, Salemi M, Vandamme A-M. 2009. The phylogenetic handbook: a practical approach to phylogenetic analysis and hypothesis testing. Cambridge: Cambridge University Press. Levin SA. 1992. The problem of pattern and scale in ecology: the Robert H. MacArthur award lecture. Ecology 73: 1943– 1967. Levin SA. 1999. Fragile dominion: complexity and the commons. New York, NY: Basic Books. Levin SA, Pacala SW. 1997. Theories of simplification and scaling of spatially distributed processes. In: Tilman D, Kareiva P, eds. Space ecology: the role of space in population dynamics and interspecific interactions. Princeton, NJ: Princeton University Press, 271–295. Lieberman DE, Pearson OM, Mowbray KM. 2000. Basicranial influence on overall cranial shape. Journal of Human Evolution 38: 291–315. Lockwood CA, Kimbel WH, Lynch JM. 2004. Morphometrics and hominoid phylogeny: support for a chimpanzee– human clade and differentiation among great ape subspecies. Proceedings of the National Academy of Sciences of the United States of America 101: 4356–4360. Losos JB. 1999. Uncertainty in the reconstruction of ancestral character states and limitations on the use of phylogenetic comparative methods. Animal Behaviour 58: 1319–1324. Losos JB, Jackman TR, Larson A, de Queiroz K, Rodríguez-Schettino L. 1998. Adaptive radiations of island lizards contingency and determinism in replicated. Science 279: 2115–2118. Mantel N. 1967. The detection of disease clustering and a generalized regression approach. Cancer Research 27: 209– 220. Martins EP, Hansen TF. 1997. Phylogenies and the comparative method: a general approach to incorporating phylogenetic information into the analysis of interspecific data. American Naturalist 149: 646–667. Mason MJ. 2004. The middle ear apparatus of the tuco-tuco Ctenomys sociabilis (Rodentia, Ctenomyidae). Journal of Mammalogy 85: 797–805. Monteiro LR, Reis SF. 2005. Morphological evolution in the
659
mandible of spiny rats, genus Trinomys (Rodentia: Echimyidae). Journal of Zoological Systematics and Evolutionary. Research 43: 332–338. Murray JD. 2007. Mathematical biology: I. An introduction. New York, NY: Springer Verlag. Nogueira MR, Monteiro LR, Peracchi AL, de Araújo AFB. 2005. Ecomorphological analysis of the masticatory apparatus in the seed-eating bats, genus Chiroderma (Chiroptera: Phyllostomidae). Journal of Zoology (London) 266: 355–364. Opperman LA, Gakunga PT, Carlson DS. 2005. Genetic factors influencing morphogenesis and growth of sutures and synchondroses in the craniofacial complex. Seminars in Orthodontics 11: 199–208. Peres-Neto PR, Jackson DA. 2001. How well do multivariate data sets match? The advantages of a Procrustean superimposition approach over the Mantel test. Oecologia 129: 169–178. Perez SI, Bernal V, Gonzalez P. 2006. Differences between sliding semilandmarks methods: implications for shape analyses of human populations. Journal of Anatomy 208: 769–784. Polly PD. 2001. On morphological clocks and paleophylogeography: towards a timescale for Sorex hybrid zones. Genetica 112–113: 339–357. Polly PD. 2003. Paleophylogeography: the tempo of geographic differentiation in marmots (Marmota). Journal of Mammalogy 84: 369–384. R Development Core Team. 2008. R: a language and environment for statistical computing. Vienna: R Foundation for Statistical Computing. Available at: http://www.Rproject.org Renaud S, Chevret P, Michaux J. 2007. Morphological vs. molecular evolution: ecology and phylogeny both shape the mandible of rodents. Zoologica Scripta 36: 525–535. Rohlf FJ. 1993. Relative warps analysis and an example of its application to Mosquito wings. In: Marcus LF, Bello E, García-Valdecasas A, eds. Contributions to morphometrics. Madrid: Monografías del Museo Nacional de Ciencias Naturales, 132–159. Rohlf FJ. 1996. Mophometric spaces, shape components and the effects of linear transformations. In: Marcus LF, Corti M, Loy A, Slice D, Naylor G, eds. Advances in morphometrics. New York, NY: Plenum Press, 117–129. Rohlf FJ. 2001. Comparative methods for the analysis of continuous variables: geometric interpretations. Evolution 55: 2143–2160. Rohlf FJ. 2007. tps series software. Available at: http// life.bio.sunysb.edu/morph/ Rohlf FJ, Slice DE. 1990. Extensions of the Procrustes method for the optimal superimposition of landmarks. Systematic Zoology 39: 40–59. Roseman CC. 2004. Detecting interregionally diversifying natural selection on modern human cranial form by using matched molecular and morphometric data. Proceedings of the National Academy of Sciences of the United States of America 101: 12824–12829. Schleich CE, Vassallo AI. 2003. Bullar volume in subterra-
© 2009 The Linnean Society of London, Biological Journal of the Linnean Society, 2009, 98, 646–660
660
S. I. PEREZ ET AL.
nean and surface-dwelling caviomorph rodents. Journal of Mammalogy 84: 185–189. Schluter D. 2000. The Ecology of adaptive radiation. Oxford: Oxford University Press. Sheets HD, Covino KM, Panasiewicz JM, Morris SR. 2006. Comparison of geometric morphometric outline methods in the discrimination of age-related differences in feather shape. Frontiers in Zoology 3: 15. Smith HF, Terhune CE, Lockwood CA. 2007. Genetic, geographic, and environmental correlates of human temporal bone variation. American Journal of Physical Anthropology 134: 312–322. Smouse PE, Long JC, Sokal RR. 1986. Multiple regression and correlation extensions of the Mantel test of matrix correspondence. Systematic Zoology 35: 627–632. Sober E. 1988. Reconstructing the past. Parsimony, evolution and inference. Cambridge, MA: The MIT Press. Sperber GH. 2001. Craniofacial development. Hamilton: BC Decker Inc. Stein BR. 2000. Morphology of subterranean rodents. In: Lacey AE, Patton JL, Cameron GN, eds. Life underground. The biology of subterranean rodents. Chicago, IL: University of Chicago Press, 19–61. Steppan SJ, Houle D, Phillips PC. 2002. Comparative quantitative genetics: evolution of the G matrix. Trends in Ecology and Evolution 17: 320–327.
Thalib L, Kitching RL, Bhatti MI. 1999. Principal component analysis for grouped data: a case study. Environmetrics 10: 565–574. Verzi DH, Olivares AI. 2006. Craniomandibular joint in South American burrowing rodents (Ctenomyidae): adaptations and constraints related to a specialized mandibular position in digging. Journal of Zoology (London) 270: 488– 501. Willmore KE, Zelditch ML, Young N, Ah-Seng A, Lozanoff S, Hallgrímsson B. 2006. Canalization and developmental stability in the Brachyrrhine mouse. Journal of Anatomy 208: 361–372. Wolpert L. 1996. One hundred years of positional information. Trends in Genetics 12: 359–364. Woods CA. 1972. Comparative myology of jaw, hyoid, and pectoral appendicular regions of New and Old World hystricomorph rodents. Bulletin of the American Museum of Natural History 147: 115–198. Woods CA, Howland EB. 1979. Adaptive radiation of capromyid rodents: anatomy of the masticatory apparatus. Journal of Mammalogy 60: 95–116. Woods CA, Contreras L, Willner-Chapman G, Whidden HP. 1992. Mammalian species. Washington: The American Society of Mammalogists. Yang Z. 2006. Computational molecular evolution. New York, NY: Oxford University Press.
© 2009 The Linnean Society of London, Biological Journal of the Linnean Society, 2009, 98, 646–660