DYNAMIC GRID SELF-ORGANIZING MAP FOR CLUSTERING OF VISUAL EVOKED POTENTIAL SINGLE TRIALS Maria Stavrinou1, Stergios Papadimitriou1, Anastasios Bezerianos1, P.Papathanasopoulos2 1
Department of Medical Physics, School of Medicine, University of Patras, Patras, Greece
[email protected],
[email protected],
[email protected] 2 Neurology Clinic, Patras University Hospital, Patras, Greece
Abstract: The paper develops a novel learning model of clustering for Evoked Potential Single Trials, called Dynamic Grid SelfOrganized Map (DG-SOM) designed according to the peculiarities of evoked potential data. The DG-SOM determines adaptively the number of clusters with a dynamic extension process which is able to exploit class information whenever exists. Specifically, it accepts available class information to control a dynamical extension process with an entropy criterion. In the case that there is no classification available, a similar dynamical extension is controlled with criteria based on the computation of local variances or resource counts. The results indicate that dynamic expansion can reveal (to a large extent) the many possible routes each of which leads from the input to the final “computation”. We employ these techniques in order to discriminate patterns from evoked potentials single trial data between alcoholic and non-alcoholic patients. From the classes provided, characteristic patterns for each class are extracted which can be valuable in studying the underlying brain dynamics. 1. INTRODUCTION We introduce the model Dynamic Grid Self Organizing Map (DG-SOM) for the analysis of Single Trial Evoked Potential (EP) data. The analysis consists of grouping the waveforms with similar characteristic patterns into clusters. Recently, clustering is applied in many cases of analysis of EEG data [1,2,3,4]. Specifically, our approach modifies the original SOM algorithm [5,6] with a dynamic expansion process controlled by an entropy-based measure whenever waveform functional class information exists. This measure quantifies the degree to which the average waveform of the node is characteristic of its class. The lower the value of the entropy a node has, the more reliable is its average waveform as a characteristic pattern of brain activation for this class. Accordingly, the model is adapted dynamically in order to minimize the entropy within the generated clusters. The entropy criterion concentrates on the resolution of the regions characterized by class ambiguity and therefore it is effective in the determination of class boundaries. Additionally, a special supervised network can be connected with the DG-SOM in order to resolve better at the class boundaries. In this case, the criteria for stopping the network expansion can be expressed either in terms of the approximation or in terms of the classification performance. An unsupervised case is provided as well. The distance threshold between patterns, below which two waveforms can be considered as functionally relevant, (and not similar due to a random event) is estimated. The map in this case is grown automatically until its nodes correspond to waveforms with intercluster distances that do not exceed this limit.
2 EVOKED POTENTIALS DURING OBJECT RECOGNITION TASK In this work, we apply the DG-SOM to analyze data from visual evoked potentials. These data provide new insights to study the neuronal mechanisms that link 0-7803-7503-3/02/$17.00 ©2002 IEEE
vision and memory. The data we use for analysis correspond to two groups of subjects: alcoholic and control. Each subject was exposed to a single stimulus (S1) or to two stimuli (S1 and S2). The stimuli were pictures of objects chosen from the 1980 Snodgrass and Vanderwart picture set. When two stimuli were shown, they were presented in either a matched condition, where S1 was identical to S2 or in a non-matched condition with S1 different from S2. All the selected pictures represent different concrete objects that were easily named. To elicit the EP a modified delayed matching-tosample task was used in which two picture stimuli appeared in succession with a 1.6sec fixed interstimulus interval. The durations of both the first (S1) and of the second (S2) picture stimulus in each test trial was 300msec. The interval between each trial was fixed to 3.2sec. The subjects’ task was to decide whether the second picture (S2) was the same as the first stimulus (S1). They were asked to press a button in one hand if the S2 matched S1 and at the other hand if the S2 differed from S1 after the presentation of S2 on each trial. The designation of the hand indicating match or no match was alternated across subjects. Response accuracy and speed were equally stressed. The present work applies the DG-SOM model in order to extract those characteristic patterns of the signal that reflect alcoholic predisposition.
3. THE DG-SOM MODEL The DG-SOM is based on the standard SOM algorithm, but is dynamically extendable, so that the number of clusters is controlled by a properly defined measure of the algorithm itself, with no need for any a priori specification. Because all the previously mentioned clustering algorithms are purely unsupervised, they ignore any available a priori neurophysiology information. Following the basic design principle to include existing prior knowledge, we manage to simultaneously consider both EP data and class
information (whenever available) at the DG-SOM training algorithms. Specifically, depending on the availability of class information we design two variants of DG-SOM. The first variant, the unsupervised DG-SOM performs node expansion in the absence of class labels by exploiting either a local variance measure that depends on the SOM quantization performance or on node resource counts. These criteria are used also at the Growing Cell Structures (GCS) algorithms for growing cells [7,8]. The expansion process stops when a statistical assessment of the randomness of the distance between EP patterns of the same node reveals that these are significantly correlated. The second variant, the supervised DG-SOM performs the growing by exploiting the class information with an entropy measure. The dynamic growth is based on the criterion of neuron ambiguity (i.e. uncertainty about class assignment), which is quantified with the entropy measure that is defined over the DG-SOM nodes. This approach differs from the local quantization error approach of [9] and of the resource counts of [8] that grow the map at the nodes accumulating the largest local variances and resource context of the unsupervised DGSOM. In the absence of class information these are reasonable and well performing criteria. However, these measures can be large even with no class ambiguity while the entropy measure directly and objectively quantifies the ambiguity. For that reason for the supervised DG-SOM, the entropy based growing technique is preferable. Below we give the DG-SOM learning algorithm structure: Top-level DG-SOM learning algorithm 1.
while do 2. 3. endwhile 4. Where more analytically: 1: The Initialization phase starts with 4 nodes having weight vectors with random numbers within the domain of feature values. 2. The Training Run Adaptation phase has as a purpose to stabilize the current map configuration in order to be able to evaluate its effectiveness and the requirements for further expansion. It takes the following algorithmic form: : MapConverged := false; while MapConverged = false do for all input patterns x k do present x k and adapt the map by applying the map adaptation rules endfor Evaluate map training run convergence condition and set MapConverged accordingly endwhile
During this phase, the input patterns are repeatedly presented and the corresponding self-organization actions are performed until the map converges sufficiently. The map adaptation rules are as follows: i) Determination of the weight vector wi ii) Adaptation of the weight vectors wj only for the four nodes j in the direct neighborhood of the winner I and for the winner itself according to: j ∉ Nk w j ( k ), w j ( k + 1) = w j ( k ) + n ( k ) ⋅ Λ k ( d ( j, i ))( x k − w j ( k )), j ∈ N k Where n (k ) is the learning rate, N k is the neighborhood at the kth learning step and Λ k (d ( j , i )) is the neighborhood function implementing different adaptation rates even within the same neighborhood. Unlike the standard SOM, these parameters do not need to shrink with time and can be kept constant i.e. N k = N 0 , Λ k ( d ( j , i )) = Λ 0 (d ( j, i )) . The evaluation of the map training run convergence condition is done by calculating the reduction of the total quantization error for the unsupervised case and of the total entropy for the supervised one, before and after the presentation of all the input patterns. The map converges when the relative change of the error between successive epochs drops below a threshold value, empirically in the range 0.01-0.02, i.e., |E E | MapConverged := b − a < ConvergenceErrorThreshold Ea
Where Eb and Ea are the errors before and after the presentation of patterns. 3) Expansion phase The dynamic expansion of the DG-SOM depends on the availability of class labels and therefore is referred as supervised expansion when class labels are available and unsupervised expansion if not. i) The Unsupervised Expansion process The unsupervised expansion is based on the detection of the neurons with large local error, i.e. unresolved neurons. The local error LEi , is defined as: LEi =
∑ (p − w )
2
i
p∈S i
Where Si is the set of waveform profiles p i mapped to the node i, w i is the weight vector of node i that corresponds to the average expression profile of Si . Because of the peculiarities of EP data two modifications are introduced: 1) The average local error per patterns is used: AVi =
LEi Si
2) This applies when we have class information available. The frequency ratio of class c is given yt he formula: rc =
r
−1 2 c
# patterns of class c # total patterns
Then the local error is amplified by a factor . Therefore, the representation of the less frequent
classes is improved. The error measure computed after this additional class frequency dependent weighting is
called Class Frequency Average Local Error (CFALE). In the absence of class information the CFALE denotes the same quantity as the average local error. The steps of the unsupervised expansion process are as follows: Unsupervised Expansion Phase: U.1. Computation of the CFALE measures for every node i. repeat U.2. let i = the node with the maximum CFALE measure U.3. if IsBoundaryNode(i) then // expand at the neighbours boundary nodes U.4. JoinSmoothlyNeighbours (i) U.5. elseif IsNearBoundaryNode(i) U.6 RippleWeightsToNeighbours(i) U.7. else InsertWholeColumn(i); endif U.8 Reset the local error measures. U.9. Re-execute the Training Run Adaptation Phase for the expanded map by presenting all the training patterns. until not RandomLikeClustersRemain();
until CurrentApproximationPerformance > ThresholdOnApproximationPerformance S.4 Generate training and testing sets for the supervised expert. Further supervising training will be performed with these sets by the supervising learning algorithm in order to better resolve the ambiguous parts of the state space. Endif 4) Fine Tuning adaptation Phase Being similar to the previous phase, it aims to optimize the final DG-SOM configuration. The Convergence Error Threshold for the fine tuning phase is smaller, approximately 0.00001 and the learning rate is set to 0.01 (or to an even smaller value), in order to allow fine adjustments to the final structure of the map.
ii) The Supervised expansion process This expansion is based on the computation of the class assignment for each node i, and of parameter HN i characterizing the entropy of this assignment. HN ( m ) = −
Nc
∑ pk log pk
k =1
where pk =
Nc
denotes the number of classes and
Vk , is the ratio of votes Vk for class k to the Vtotal
total number of votes Vtotal to neuron m. The supervised expansion phase consists of the following steps: S.1 Computation of the class labels and entropies HN i for the map nodes. The ambiguity of class assignment for the EPs of node i is quantified by HN i . repeat S.2. Evaluation of the map over the whole training set in order to compute the approximation performance CurrentApproximationPerformance S.3 if CurrentApproximationPerformance < ThresholdOnApproximationPerformance then //resolve better the difficult regions of the state space on which classification decisions cannot be deduced easily S.3.1. let i = the node of higher ambiguity (i.e. largest entropy parameter). S.3.2. if IsBoundaryNode(i) then join smoothly the neighbours to the map elseif node i near the boundary then RippleWeightsToNeighbours(i) else InsertWholeColumn(i); endif Reset the node entropy measures. Apply the Map Adaptation phase to the new expanded map. endif
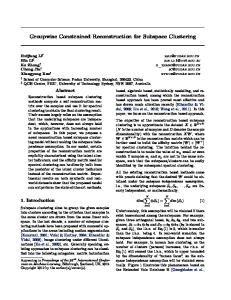
Figure 1 The profiles of the EP waveforms clustered to a DGSOM node of class. A few patterns of the rest classes presenting very similar expression profiles map also to this node.
4.RESULTS AND DISCUSSION We have applied the DG-SOM to analyze visual EP data which were made available by Ingber Lester originally produced by Henri Begleiter at the Neurodynamics laboratory at the State University of New York Health Care at Brooklyn [10]. The program has succeeded in discriminating clusters for all the different cases in the experimental procedure and the two kinds of subjects. The six basic nodes are listed in Table1. Table 1 Control Single Object
Alcoholic Object Control2NoMatch Control2Match Alcoholic2NoMatch Alcoholic2Match
Control subject, one visual stimuli S1 Alcoholic subject, one visual stimuli S1 Control subject, two stimuli, S1≠S2 Control subject, two stimuli, S1=S2 Alcoholic subject, two stimuli, S1≠S2 Alcoholic subject, two stimuli,S1=S2
Furthermore, the value of each cluster is measured by the value of its entropy, so zero entropy indicates greatest similarity between the included patterns.
Our work developed further for the verification of other results obtained by previous works on the same or similar datasets [11,12,13,14]. All datasets mentioned above, belong to the same project for the collaborative study on the predisposition to alcoholism.
The results indicated that the DG-SOM could effectively identify subclasses of single trial activations that correspond to probable different topographic brain activations. In addition, the potentiality to examine to which extent the sequence of upward and downward peaks in the average waveform is an accurate record of the activity sequence in single trials is provided. The incorporation of the presented DG-SOM dynamic growing algorithms as a front end processing within Bayesian network structure learning algorithms [15] is also an open area for future work. REFERENCES
Figure 2 The amplitude of the EP component c247 is significantly smaller in repeated (primed) pictures (bottom subplot) than to the single picture presentations (upper subplot). This result is also supported by [11].
The result of this work support and extend those obtained in [11] on the same dataset. By selecting representative clusters from the categories (i.e. Class Identifiers, as shown in Table 1), “Control Single Object” and “ControlObject2Match”, we obtained the same conclusions as those of Zhang et al [11]. Who found that the amplitude of the EP component (c247) to repeating (primed) pictures of common objects were significally decreased as compared to that elicited by unrepeated (unprimed) pictures. The c247 component named Visual Memory Potential (VMP) reflects the information processed in visual short-term memory. As we can see in Figure 2 the amplitude of ControlObject2Match component c247, which is the main peak seen around 247ms is much lower than of “ControlSingleObject”. Moreover as the same work has revealed, the response time is also significantly decreased for repeated picture stimuli compared to the unrepeated, as it can be seen in Figure 2. 5. CONCLUSIONS A novel feature of the DG-SOM compared with other related approaches is the potentiality for the effective exploitation of the available class information with an entropy-based measure that controls the dynamical extension process. This process extracts information about the structure of the decision boundaries. A supervised network can be connected additionally in order to resolve better at the difficult parts of the state space. This hybrid approach (i.e. unsupervised competitive learning for the simple parts of the state space and supervised for the difficult ones) can compete in performance advanced supervised learning models at a much less computational cost. In essence, the DGSOM can utilize the pure supervised machinery only where it is needed, i.e. for the construction of complex decision boundaries over regions of the state space where patterns cannot be separated easily.
[1] S. L. Joutsiniemi, S. Kaski, A. Larsen, “Self-Organizing Map in Recognition of Topographic Patterns of EEG Spectra”, IEEE Transactions on Biomedical Engineering, vol. 42, (11), pp. 1062-1068, November 1995 [2] A. B. Geva, D. H. Kerem, “Forecasting Generalized Epileptic Seizures from the EEG Signal by Wavelet Analysis and Dynamic Unsupervised Fuzzy Clustering”, IEEE Transactions on Biomedical Engineering, vol. 45 (10), pp.1205-1206, 1998 [3] P. Wahlberg and G. Lantz, “Methods for Robust Clustering of Epileptic EEG Spikes”, IEEE Transactions On Biomedical Engineering, vol. 47 (7), pp. 857-868, July 2000 [4] G. Zouridakis, N., N. Boutros, B. Jansen, “A fuzzy clustering approach to study the auditory P50 component in schizophrenia”, Psychiatry Research, vol. 69, pp. 169-181, 1997 [5] T. Kohonen, Self-Organized Maps, Springer-Verlag, Second Edition, 1997. [6] M.M. Campos, G. A. Carpenter, “S-TREE: self-organizing trees for data clustering and online vector quantization”, Neural Networks, vol. 14, pp. 505-525, 2001 [7] G. Cheng and A. Zells, "Externally Growing Cell Structures for Data Evaluation of Chemical Gas Sensors", Neural Computing & Applications, vol. 10, pp. 89-97, Springer-Verlag, 2001 [8] Fritzke Bernd, "Growing Grid - a self organizing network with constant neighborhood range and adaptation strength", Neural Processing Letters, vol. 2 (5), pp. 9-13, 1995 [9] Alahakoon Damminda, Halgamuge Saman K., Srinivasan Bala, "Dynamic Self-Organizing Maps with Controlled Growth for Knowledge Discovery", IEEE Transactions On Neural Networks, vol. 11 (3), pp. 601-614, May 2000. [10] Lester Ingber, 1997-2001, EEG Data, [Online], Available: http://www.ingber.com/smni97_eeg_data.html [11] X.L Zhang. H. Begleiter, B. Porjesz, W. Wang, A. Litke, “Event Related Potentials during object recognition tasks”, Brain Research Bulletin, vol. 38(6), pp. 531-538, 1995 [12] V. Hasselbrock, H. Begleiter, B. Porjesz, S. O’Connor, L. Bauer, “P300 event-related potential amplitude as an endopenotype of alcoholism – evidence from the collaborative study on the genetics of alcoholism”, J. Biomed. Sci., vol. 8 (1), pp.77-82, Jan-Feb 2001 [13] H. Begleiter , B. Porjesz., W. Wang , “A neurophysiologic correlate of visual-short-term memory in humans”, Electroenceph. Clin. Neurophys.", Jul; vol. 87(1), pp. 46-53, 1993 [14] V.R. Prabu, B. Porjesz, D.B. Cholian , Wang K., Stimus A., Begleiter H., “Visual P3 in female alcoholics”, Alcohol. Clin. Exp. Res., vol. 25 (4), pp. 531-9, Apr. 2001 [15] C. M. Bishop, Neural Networks for Pattern Recognition, Clarendon Press-Oxford, 1996.
Acknowledgements The authors wish to thank the Research Committee of the University of Patras for the partial financial support of this research with the contract Karatheodoris 2459