Dynamic Channel Allocation Using a Genetic Algorithm for a TDD Broadband Fixed Wireless Access Network Shin Horng Wong* and Ian Wassell** Laboratory for Communications Engineering, University of Cambridge, Cambridge CB2 1PZ, United Kingdom Ph: +44 1223 765 151 Fax: +44 1223 766 517 email:
[email protected] * email:
[email protected] ** Abstract— This paper investigates channel allocation methods for a broadband fixed wireless access (BFWA) network. The existing channel allocation methods are categorised in terms of a Channel Allocation Matrix. A novel Dynamic Channel Allocation (DCA) method using a Genetic Algorithm is evaluated and compared with two existing DCA methods namely the Least Interfered (LI) and Channel Segregation (CS). These three methods are chosen from the same category in the proposed Channel Allocation Matrix.
I. INTRODUCTION The rapid increase in the data rate in the Internet backbone is not paralleled with the increase in the data rate in the last mile. This causes a bottleneck for the majority of Internet users that do not enjoy fast access networks. Broadband fixed wireless access (BFWA) networks can be rapidly deployed and provide data rates that current Internet users demand. Typical BFWA network components are the Control Server (CSVR), the Access Point (AP) and the Subscriber Unit (SU) and they are arranged as shown in Fig. 1. The SU is mounted on the subscriber’s site and uses a directional antenna with a horizontal beamwidth of 20° to communicate with its corresponding AP. Each AP has an antenna with a horizontal beamwidth of 60°. A CSVR is connected to K APs. The CSVR is a server that provides configuration, authentication and management systems. Control Server
Access Point
Subscriber Unit
Fig. 1. Broadband fixed wireless access network components.
The number of wireless channels is usually limited and they are reused. Channel reuse causes co-channel and adjacent channel interference, which will degrade the Signal to Noise Ratio (SNR) of received packets and consequently the throughput of a BFWA network. The aim of channel allocation is to allocate channels to each AP such that it minimises these interferences and at the same time meets the traffic demands. This paper is arranged as follows: Section II describes the Channel Allocation Matrix, Section III describes the proposed Dynamic Channel Allocation (DCA) method using the Genetic Algorithm (GA) and two different DCA methods namely the Least Interfered (LI) and Channel Segregation (CS). Section IV presents the simulation and results while Section V gives the conclusions.
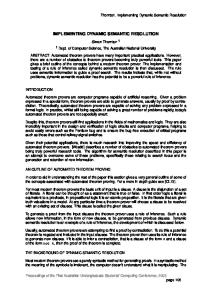
II. CHANNEL ALLOCATION MATRIX Conventionally, channel allocation can be divided into Fixed Channel Allocation (FCA) and Dynamic Channel Allocation (DCA) [1]. In FCA ([2] and [3]) a set of channels are permanently allocated to each cell for its exclusive use while in DCA, the channels are kept in a central pool and are assigned dynamically as calls arrive. The various methods proposed are classified according to the Channel Allocation Matrix shown in Fig. 2. [6], [7]
[13]
[4], [5]
[11], [12]
Centralised
GA Distributed
FCA
LI, CS, [10]
Non-measurement
Measurement
Fig. 2. Channel Allocation Matrix.
The vertical axis in Fig. 2 is a measure of the centralisation required in the channel allocation method. The degree of centralisation is defined as being proportional to the number of APs required to communicate with a central controller in order to allocate a channel. A fully centralised system requires every AP in the entire network to communicate with a central controller while in a fully distributed system, the AP can make the decision to allocate a channel on its own. The more centralised the system the greater is the amount of signaling required, which causes high packet or call set-up delay and may result in system instability. The more distributed the system is, the less global knowledge is present at each AP and so the decision is based on partial knowledge and usually the allocation is made to benefit itself. The horizontal axis in Fig. 2 represents the quantity of measurements (e.g. interference power or SNR) made by the APs and/or SUs prior to a channel allocation. Measurement adds to the complexity of the process and needs to be performed quickly to minimise packet delay. In a nonmeasuring scheme, a-priori knowledge of the network such as the reuse distance and frequency separations between APs within the same reuse distance are required. The Channel Allocation Matrix can be divided into four quadrants: Distributed Non-measurement, Centralised Nonmeasurement, Distributed Measurement and Centralised Measurement. Citations to methods in each quadrant are shown in Fig. 2.
III. DCA METHODS The DCA methods considered are the GA, LI [8] and CS [9] and they fall into the Distributed Measurement quadrant of the Channel Allocation Matrix. Simulations will be used to investigate the performance of the asynchronous BFWA network under consideration. The use of a Packet Reservation Media Access (PRMA) layer utilising asymmetric Time Division Duplex (TDD) is assumed. The MAC frame structure is shown in Fig. 3. A Single MAC Frame SCAN
Downlink
AP transmits
Uplink
SUs transmit
Fig. 3. A single TDD MAC frame.
The Downlink and Uplink portion of the MAC frame is used for packet transmission. The SCAN portion at the beginning of the MAC frame is used by the AP to measure the interference power of several frequency channels. Using the measured interference power, the AP selects a channel – using one of the DCA methods – and this channel is used until the end of the MAC frame. It is assumed that the selected channel is successfully broadcast to all its SUs. This process is repeated for every MAC frame. In the LI method, the AP scans all available channels and selects the channel with the lowest interference power. If more than one channel shares the same lowest interference power, the channel used previously will be selected and if none were used previously, the channel with the lowest number is selected. In the CS method an ordered list is given to each AP and this list is updated according to interference conditions. The AP will scan the interference power for the highest priority channel in the ordered list and if the scanned interference power is below a threshold, this channel will be selected and the scanning process ends. If the highest priority channel does not meet the requirement, the next highest priority channel in the list is considered. If no such channel exists the lowest interfered channel is selected. The priority, P of each channel in the list is updated as follows: N P= A (1) NT Where NA is the number of successful uses of the channel and NT is the total number of trials for the channel. The initial priority list can be arbitrary and is set to follow the channel number. When the system converges the amount of scanning can be reduced to one channel for every MAC frame. The GA method has two subsystems – one responsible for scanning and selecting a channel and the other responsible for ranking the channels in a priority list of NS channels per AP (a percentage of the available channels). In the first
subsystem, the AP scans a fixed number of channels NS and selects the highest priority channel on the basis that the interference power is below a threshold. If no such channel is found, the lowest interfered channel is chosen. The measured interference powers of these NS channels are sent to the CSVR. The CSVR uses a genetic algorithm to select NS channels out of the total number of available channels and ranks these selected channels for each AP. The set of ordered lists are sent to the corresponding APs. The APs do not wait for updates from the CSVR to make a decision but use the existing ordered list. The degree of centralisation is small because each CSVR is connected to a fixed number of APs forming a cluster without overlap (i.e. no one AP communicates with two CSVRs as compared with the situation where centralisation up to the interference neighbourhood is employed). A general genetic algorithm consists of an initial population followed by selection, crossover and mutation operations [14]. The CSVR uses the genetic algorithm process shown in Fig. 4 to find the best channel ordered list for each AP. Initial Population
Selection
Crossover
Mutation
Select & Send
Fig. 4. Genetic Algorithm performed by CSVR.
The CSVR has a population of individuals NP where each individual is a string that represents a concatenation of each AP’s channel priority list. Each element in the string is a channel number. An example of an individual’s string is shown in Fig. 5, where it is assumed that 3 APs are connected to a CSVR and each AP scans 5 channels (NS = 5). The priority in each priority list decreases moving from left to right for each AP. The initial population is generated randomly. AP 1 3
5
2
AP 2 11
9
6
1
14 15
AP 3 2
2
1
4
7
9
Priority decrease Fig. 5. An example of an individual’s string representation
The fitness value is evaluated for each of the NP individuals using a fitness function. The fitness value is a
measure of how good an individual is. Firstly, in a specific generation t, the fitness for the ith priority order in the channel priority list is evaluated using (2). K
∑
Fi (t ) = A
I i ,m (t ) + B
m =1
K
+C
∑S
i ,m
K
K
∑∑ D
i , m ,n
(t )
m =1 n =1 n≠m
(t , t − 1)
m =1
(2) Where 1≤ i ≤ NS and function Ii,m(t) is the averaged measured interference power for the channel in the ith priority position of AP m in the tth generation. Function Di,m,n(t) is 1 if the channel number in the ith priority position of AP m and AP n are different otherwise it is 0. This is to encourage the APs within the same CSVR to use different channels. Function Si,m(t,t-1) is 1 if the channel number in the ith priority position of AP m at generation t and t-1 are the same otherwise it is 0. This is to encourage each AP to use a previous channel. A, B and C are constants which weight the importance of functions Ii,m(t), Di,m,n(t) and Si,m(t,t-1) respectively. The constant C determines whether the algorithm will explore different channel combinations or will exploit the current channel combinations. When the algorithm is exploiting the current channel combinations (large C) then the channels used for transmission will not fluctuate. This enables APs associated with other CSVRs to better predict its channel usage. However, the network will converge quickly to a local optimum that may give poor SNR performance. On the other hand, if the algorithm tends to explore different combinations (small C) then this may give rise to a better SNR performance. This will cause the transmission channel to fluctuate and so is less predictable causing instability. The constant C should be set to balance between exploration and exploitation. The overall fitness value for an individual at generation t is thus:
F (t ) =
After the fitness of each individual is evaluated, the Selection operation picks the top 50% of the fittest individuals for the Crossover operation. The Crossover operation uses a partially mapped crossover method [15]. In the Mutation operation, every element in each individual is subjected to mutation with a small probability pm, where the channel number of each element is randomly changed. This is to encourage different channels to be explored. At the Select and Send operation in Fig. 4, a new generation of individuals is produced and the fitness value for each of them is evaluated. The fittest individual is selected and sent to update the respective APs. IV. SIMULATION AND RESULTS The simulation is performed using OPNET Modeler 7.0 employing a scenario with 37 cells as shown in Fig. 7, where the radius of each cell is 3 km. The simulation has 137 APs where each cell has from 2 to 6 APs giving a non-uniform traffic distribution. Boundary effects are reduced using this layout and measurements are taken from the centre cell (with 6 APs) shown shaded in Fig. 7. A total of 920 SUs are distributed randomly in the layout. There are 14 CSVR with a maximum cluster size of 10 APs and NS = 5 channels (in GA method). At the start of the simulation, all of the APs transmit using the same channel causing the worst-case interference amongst themselves and consequently the APs need to adapt to this situation. The uplink and downlink received SNRs, and packet throughput measured in terms of packets/packet frame are recorded. A packet frame is the time it takes an AP or a SU to transmit a packet.
NS
∑ W F (t ) i
(3)
i
i =1
Where Wi is a constant, which weights the importance of each element (i.e. priority order in the list). An example fitness function calculation for the string in Fig. 5 is shown in Fig. 6. Decreasing priority order i=1
i=2
i=3
i=4
i=5
3 6
5
2
11
9
m=1
AP 1
1
14
15
2
m=2
AP 2
2
1
4
7
9
m=3
AP 3
F1(t)
F2(t)
F3(t)
F4(t)
F5(t)
F(t) = W1F1(t) + W2F2 (t)+ W3F3 (t)+ W4F4 (t)+ W5F5(t)
Fig. 6. An example fitness function calculation
Fig. 7. Simulation layout.
The self-similar traffic characteristic exhibited by a packet data network is generated by each AP and SU using an ONOFF model as in [16], which uses a Pareto distribution for the ON and OFF periods. Pareto’s probability distribution function is given by,
p(t | t > β ) =
αβ α t α +1
(4)
With mean,
E[t ] =
αβ α −1
(5)
Where β is the minimum OFF (or ON) period and 1< α < 2. The values for α are 1.7 for ON-periods and 1.2 for the OFF-periods [16]. The value of β depends upon the data rate and average file size, which is assumed to be 13.9 kbytes for web browsing applications [10]. The radio propagation is assumed to follow the Random Height path loss model [17], which has a path-loss exponent of 2 for distances up to 1km and an exponent of 3.8 thereafter. The lognormal shadow standard deviation is 3.5 dB. Only co-channel interference and thermal noise are assumed in the simulation. The number of available channels is 15 each having a bandwidth of 15 MHz operating in the 5GHz U-NII band. Fig. 8 and Fig. 9 are the received SNR cumulative distribution curves for the downlink and uplink respectively. These figures show that the GA method generally performs the best in terms of received SNR followed by the LI method and that CS performs the worst. The LI method always picks the channel with the lowest interference power and hence gives a better SNR performance than the CS method. However, the LI method may choose a channel that causes interference to other APs and hence does not achieve long term frequency coordination among APs. The GA requires the measurement of a portion of available channels but gives a better SNR performance than the LI method. It also manages to achieve partial long term frequency coordination among APs since the GA algorithm will continue to search for the best channel ordered list. The first-percentile SNR for the 3 methods is listed in TABLE I. In the downlink the GA method has a 17 dB gain over the LI method and a 21.5 dB gain over the CS method.
In the uplink the GA method has a 14.5 dB gain over the LI method and a 23.5 dB gain over the CS method. The GA method over the long term gives a stable received SNR performance as compared with the other two methods. The received SNR performance in the uplink is better than the downlink because only the AP performs channel scanning and so channel selection is based on the uplink interference power. TABLE I First-Percentile Received SNR Direction Downlink Uplink
CS -0.5 dB 0 dB
LI 4 dB 9 dB
GA 21 dB 23.5 dB
TABLE II shows the packet throughput (packet/ packet frame) for uplink packets received by APs in the centre cell that have a SNR exceeding 18 dB [8]. The GA method has a 23% higher channel throughput than LI because the LI method needs to measure all channels before selecting one for transmission thereby causing packet delay and lowering packet throughput. The CS method after settling upon a priority list needs only to scan one channel and hence has a higher packet throughput than LI. Since the CS method has poorer SNR performance than the GA method, it has a 4.3% lower packet throughput than the GA method. TABLE II PACKET THROUGHPUT FOR ALL APS IN CENTRE CELL (PACKETS/ PACKET FRAME) CS 1.143
Throughput
LI 0.916
GA 1.194
CDF - Downlink 1 0.8 0.6 CDF
CS LI
0.4
GA
0.2 0 -15
-10
-5
0
5
10
15
20
25
30
Received SNR
Fig. 8. Downlink received SNR CDF.
35
40
45
50
55
60
65
CDF - Uplink 1
CDF
0.8 0.6
CS LI
0.4
GA
0.2 0 -15
-10
-5
0
5
10
15
20
25
30
35
40
45
50
55
60
65
Received SNR
Fig. 9. Uplink received SNR CDF.
V. CONCLUSIONS Various channel allocation methods are classified in the Channel Allocation Matrix. A DCA method using a Genetic Algorithm (GA) is proposed and is compared with the LI and CS method in a simulation of a BFWA network loaded with typical Internet traffic. It is shown that the GA method achieves a SNR gain (first-percentile) in excess of 14.5 dB as compared with the other two methods because the GA method is able to achieve long term frequency coordination among APs. The GA method gives 4.3% and 23% higher packet throughputs (packets/packet frame) than the CS and LI methods respectively. ACKNOWLEDGMENT The authors wish to thank the Cambridge Commonwealth Trust and Adaptive Broadband Ltd for their sponsorship. REFERENCES [1]
[2]
[3]
[4]
[5]
I. Katzela and M. Naghshineh, "Channel Assignment Schemes for Cellular Mobile Telecommunication Systems: A Comprehensive Survey," IEEE Personal Communications, pp. 10-31, vol. 3, June 1996. W. K. Lai and George G. Coghill, “Channel Assignment Through Evolutionary Optimization,” IEEE Transactions on Vehicular Technology, pp. 91-96, vol. 45, no. 1, February 1996. Antonio Capone and Marco Trubian, “Channel Assignment Problem in Cellular Systems: A New Model and a Tabu Search Algorithm,” IEEE Transactions on Vehicular Technology, pp. 1252-1260, vol. 48, no. 4, July 1999. Sandeep K. S. Gupta and Pradip K. Srimani, “Distributed Dynamic Channel Allocation in Mobile Networks: Combining Search and Update,” Proc. 1999 IEEE International Performance Computing and Communications Conference, pp. 120-126, Pheonix AZ, Feb 10-12, 1999. Kevin A. West and Gordon L. Stuber, “An Aggressive Dynamic Channel Assignment Strategy for a Microcellular Environment,” IEEE Transactions on Vehicular Technology, pp. 1027-1038, vol. 43, no. 4, November 1994.
[6]
[7]
[8]
[9]
[10]
[11]
[12]
[13]
[14] [15]
[16]
[17]
Kumar N. Sivarajan and Robert J. McEliece, “Dynamic Channel Assignment in Cellular Radio,” Proc. IEEE 40th Veh. Technol. Conference, pp. 631-637, 1990. Junhong Nie and Simon Haykin, “A Q-Learning-Based Dynamic Channel Assignment Technique for Mobile Communication Systems,” IEEE Transactions on Vehicular Technology, pp. 16761687, vol. 48, no. 5, September 1999. Matthew Cheng and Li Fung Chang, “Wireless Dynamic Channel Assignment Performance Under Packet Data Traffic,” IEEE Journal on Selected Areas in Communications, pp. 1257-1269, vol. 17, no. 7, July 1999. Yoshihiko Akaiwa and Hidehiro Andoh, “Channel Segregation – A Self-Organized Dynamic Channel Allocation Method: Application to TDMA/FDMA Microcellular System,” IEEE Journal on Selected Areas in Communications, pp. 949-954, vol. 11, no. 6, August 1993. Justin C.-I. Chuang and Nelson R. Sollenberger, “Spectrum Resource Allocation for Wireless Packet Access with Application to Advanced Cellular Internet Service,” IEEE Journal on Selected Areas in Communications, pp. 820-829, vol. 16, no. 6, August 1998. Kin K. Leung and Arty Srivastava, “Dynamic Allocation of Downlink and Uplink Resource for Broadband Services in Fixed Wireless Networks,” IEEE Journal on Selected Areas in Communications, pp. 990-1006, vol. 17, no. 5, May 1999. Osman Koyuncu, Sajal K. Das and Hakan Ernam, “Dynamic Resource Assignment Using Network Flows in Wireless Data Networks,” IEEE Vehicular Technology Conference Proceedings 1999, Houston Texas, May 16-19, 1999. Dietmar Kunz, “Transitions from DCA to FCA Behavior in a SelfOrganizing Cellular Radio Network,” IEEE Transactions on Vehicular Technology, pp. 1850-1861, vol. 48, no. 6, November 1999. Melanie Mitchell, An Introduction to Genetic Algorithms. London: The MIT Press, 1999. P. Larranaga, C. M. H. Kuijpers, R. H. Murga, I. Inza and S. Dizdarevic, “Genetic Algorithms for the Travelling Salesman Problem: A Review of Representations and Operators,” Artificial Intelligence Review, 13(2), pp. 129-170, April 1999. Walter Willinger, Murad S. Taqqu, Robert Sherman and Daniel V. Wilson, “Self-Similarity Through High-Variability: Statistical Analysis of Ethernet LAN Traffic at the Source Level,” IEEE/ACM Transactions on Networking, pp. 71-86, vol. 5, no. 1, February 1997. D. Crosby, “Propagation Modelling for Directional Fixed Wireless Access System,” Ph.D. dissertation, University of Cambridge, 17 November 1999.