Understanding Low-Wage Work in the United States Heather Boushey, Shawn Fremstad, Rachel Gragg, and Margy Waller March 2007
The Mobility Agenda A Special Initiative of Inclusion 202-470-2459 www.inclusionist.org
Center for Economic Policy and Research 1611 Connecticut Avenue, NW, Suite 400 Washington, DC 20009 202-293-5380 www.cepr.net
C o nt ents Introduction
1
What is a Low-Wage Job?
2
Downward Trends in Wage Levels for Low Wage Jobs
7
The Poor Work Conditions of Low-Wage Jobs
9
The Largest Low-Wage Occupations
13
Pulling Apart
16
Many Workers Have Not Benefited
19
Conclusion: New Ideas for Better Jobs
21
Appendix
22
A bo ut Margy Waller is director of, and Shawn Fremstad and Rachel Gragg are advisors to, Inclusion’s Mobility Agenda; Heather Boushey is senior economist at the Center for Economic and Policy Research. In February 2007, Inclusion and the Center for Economic and Policy Research established a new partnership. The Mobility Agenda is a special initiative of Inclusion at the Center for Economic and Policy Research.
A ck n owl ed gme nts John Schmitt of the Center for Economic Policy and Research and Sarah Sattelmeyer and Amelia Dietrich of The Mobility Agenda provided essential analytical and editorial assistance. John provided us with the data on productivity and median wage trends. The authors are responsible for any errors or omissions in the paper. Inclusion's Mobility Agenda thanks The Joyce Foundation for its support of the initiative's research and policy analysis on low-wage work.
The Mobility Agenda
ver 40 million jobs in the United States—about one in three—pay low wages. Unlike good jobs, most low-wage jobs do not offer employment benefits such as health insurance or retirement accounts, tend to have inflexible or unpredictable scheduling requirements, and provide little opportunity for career advancement. Globalization, automation, outsourcing, and other economic forces have all contributed to a changing domestic labor market. All too often low-wage jobs are replacing jobs that have traditionally supported a broad middle class. While there is considerable public concern about the erosion of the middle class, national policy-makers have done little in the last decade to improve the pay and conditions of low-wage work.
O
The next decade could be one of considerable progress for improving low-wage jobs. In November 2006, voters in six states boosted state minimum wages, and voters in even more states elected candidates who pledged to increase the federal minimum wage and take steps to improve the economy for everyone. Yet relatively little agreement exists about the policies (beyond raising the minimum wage) that can improve these jobs, even among experts studying low-wage work. The Mobility Agenda staff is developing a menu of new ideas and strategies for improving lowwage work, a set of options that goes beyond minimum wage to strengthen the labor market and build an economy that works for everyone. Our focus is on improving wages, benefits, and other conditions of low-wage work. We seek to encourage further public debate about the significance of low-wage work and to promote discussion among stakeholders—workers, employers, policymakers, academics, community organizers, and others—about the extent to which a more direct focus on the labor market and economic policy is necessary to reduce poverty and improve the well-being of low-income families.1 In this report, we define low-wage work and provide a description of the low-wage labor market. We also examine the extent to which opportunity exists for workers to move out of the low-wage labor market and into better-paying jobs.
1
For an analysis of how progressive policy advocates have focused too narrowly on defending social programs from conservative attack and not enough on promoting an inclusive policy agenda that addresses low-wage work and other labor market issues, see Heather Boushey, “A House Divided,” New Labor Forum 13(3), Fall 2004. Similarly, several recent policy papers and articles make the case for viewing social programs like Food Stamps and Temporary Assistance in relation to the labor market—this approach involves viewing beneficiaries of these programs as workers, even when they are temporarily out of the labor force, rather than recipients or people who are primarily defined by their receipt of a particular benefit. See, e.g., David Super, “The Quiet ‘Welfare’ Revolution: Resurrecting the Food Stamp Program in the Wake of the 1996 Welfare Law,” NYU Law Review 79(1271), 2004, and Margy Waller and Shawn Fremstad, “New Goals and Choices for Temporary Assistance: State Choices in the Decade After Enactment,” The Brookings Institution, August 2006.
1
Understanding Low-Wage Work in the United States
W h at Is a L ow- Wa ge J o b? While there is no precise, universally accepted definition of low-wage work, there are two general approaches based on wages. 2 We identify these as the basic-income and social-inclusion approaches. We adopt the social-inclusion approach that defines a low-wage job as one paying less than two-thirds of the median wage -- $11.11 per hour or less. The Basic-Income Approach The basic-income approach estimates the income necessary to purchase a minimal bundle of goods and services needed for daily living—including housing, transportation, groceries, child care, and health care. The most commonly used measure of basic consumption needs is the official U.S. poverty formula. However, due to the shortcomings of this measure a growing number of analysts use basic family budgets as an alternative. The U.S. poverty threshold varies by family size, number of related children, and, in families of one or two persons, whether the householder is age 65 or older. For a family unit of one person under age 65, the poverty threshold in 2006 was $10,488. By comparison, for a family unit of two adults and two children, the poverty line was $20,444.3 Scholars using the official U.S. poverty formula to determine whether a job is low-wage typically use the poverty threshold for a family of four. They define a low-wage job as one in which a full-time, year-round worker—someone who works 40 hours a week for 52 weeks or 2,080 hours in a year—earns less than the poverty threshold for a family of two adults and two children ($20,444 in 2006, or $9.83 an hour).4 According to this definition, about one out of every four workers—almost 35 million—held jobs in 2006 that paid poverty-level wages.5
2
Since one of our goals in this paper is to develop an easily understood dollar threshold that defines low-wage work and is primarily job-based rather than worker-based, we limit our review here to wage-based definitions. Other approaches define low-wage workers, for example, as those whose annual earnings are below a certain threshold, or who have low skill or education levels. We recognize, however, that in a technical sense the common definitions we review are all worker-based rather than job-based definitions, since they categorize jobs on the basis of workers’ earnings. For more on this distinction, see Jared Bernstein and Heidi Hartmann, “Defining and Characterizing the Low-Wage Labor Market” in The Low-Wage Labor Market: Challenges and Opportunities for Self-Sufficiency, prepared by The Urban Institute for the Assistant Secretary for Planning and Evaluation, U.S. Department of Health and Human Services, December 1999, aspe.hhs.gov/hsp/lwlm99/bernhart.htm. 3 U.S. Census Bureau, Poverty Thresholds 2006, www.census.gov/hhes/www/poverty/threshld/thresh06.html. The Census Bureau also calculates weighted average poverty thresholds for families of three or more people; these thresholds are based only on size of family unit, regardless of whether any are children. According to preliminary Census estimates, the weighted average poverty threshold for a family of four in 2006 is $20,615. 4 See, e.g., Beth Shulman, The Betrayal of Work: How Low-Wage Jobs Fail 30 Million Americans, New York: New Press, 2003. On p. 26, Shulman notes that the definition is “somewhat arbitrary”; Lawrence Mishel, Jared Bernstein, and Sylvia Allegretto, The State of Working America 2006/2007, Ithaca, NY: Cornell University Press, 2007; Marlene Kim, “Women Paid Low Wages: Who They Are and Where They Work,” Monthly Labor Review, Bureau of Labor Statistics, September 2000, p. 26, www.bls.gov/opub/mlr/2000/09/art3full.pdf. 5 Analysis by Heather Boushey of the CEPR extracts from the Current Population Survey Outgoing Rotation Group Files.
2
The Mobility Agenda The main argument in favor of using poverty thresholds to define low-wage work is their widespread use by researchers and government officials. Still, using the poverty threshold to define low-wage work has limited appeal, primarily due to its inadequacy as a measure of the income necessary to meet basic needs. When federal officials adopted the poverty guideline in the 1960s, they used a formula based on the share of household expenditures represented by the basic food budget in 1955. The threshold has since been updated annually for the overall rate of inflation. But changes in our social structures and household expenses have rendered the formula nearly useless as an objective measure of the income necessary to meet basic consumption needs. Federal officials have developed other measures of basic consumption requirements in an attempt to address some of the limitations of the poverty definition. The Census Bureau, for example, releases alternative poverty rate estimates using a formula that includes income and expenses not considered in the official definition. However, the alternative estimates continue to rely on the original poverty formula with only minor modifications6 As a result, while these estimates provide a more accurate measure of the number of families with income under the official thresholds, they do not address limitations of the formula in estimating the cost of meeting basic needs. A better alternative approach, developed by economists and other researchers,7 calculates basic family budgets by determining the cost of goods and services needed to live at an adequate level. Typically, these goods and services include food, housing, health care, transportation, child care, clothing, personal care, taxes, and other basic items. Costs are based on publicly available data. For example, food costs are based on the Department of Agriculture’s Low-Cost Food Plan and housing costs on the Department of Housing and Urban Development’s Fair Market Rent figures. Basic family budget levels are higher than the poverty threshold, which was originally designed to determine the minimum income necessary to avoid deprivation—such as hunger—in an extreme sense.8 While experts use a conservative definition of basic needs for the family budgets, they are based on today’s economy, in which housing, transportation, child care, and health care expenditures represent a larger share of basic household budgets than they did in the 1950s. Analysts and government officials use basic family budgets to measure gaps between the basic needs of low-wage households and their resources from earnings and employment benefits
6
In this sense, the current alternative measure used by the Census Bureau differs markedly from the measure recommended by the National Academy of Sciences. Under the NAS approach, poverty thresholds would be calculated by determining a dollar amount for shelter, food, utilities, and clothing, with a small percentage adjustment for other basic, non-work-related needs. 7 Examples include the Self-Sufficiency Standards developed by Diana Pearce of the University of Washington, and the Basic Family Budgets developed by the Economic Policy Institute. 8 Jared Bernstein, Chauna Brocht, and Maggie Spade-Aguilar, How Much is Enough? Basic Family Budgets for Working Families, Economic Policy Institute, 2000.
3
Understanding Low-Wage Work in the United States combined.9 Yet, basic family budgets are less useful for defining low-wage work. Both definitions of low-wage work, the one based on basic family budgets and the one on poverty thresholds, vary by household size. A definition of low-wage work for which earnings vary by household size seems unwieldy in many ways, including for the establishment of basic standards like minimum wage. Still, since these basic income formulas include basic needs, it is hard to justify a definition that does not include family-size variation. Of course, the formula works better for the most common use of basic needs budgets—measuring the gap between basic needs and resources from both public and private sources—since most publicly funded employment benefits, like child care, are based in part on household size. The Social-Inclusion Approach The social-inclusion approach avoids limitations of the basic income formulas by using a comparison with other jobs to define low-wage work.10 This approach defines low-wage work by drawing distinctions among jobs in the labor market. One formula defines low-wage jobs as one that falls in the bottom third (or sometimes the bottom quarter) of the wage distribution.11 In 2006, workers earning around $11.64 or less per hour—about 47 million workers—fell into this bottom third.12 Defining low-wage work by reference to the bottom third permits analysis of trends in wage growth over time. (See the next section for data on wage growth by thirds.) However, the share of the labor market with low wages is always fixed in this formula, so this methodology does not provide trend data about the number of low-wage jobs. Also, this formula does not provide information about the dispersion of wages—that is, how much less low-wage jobs pay. We can address this limitation by refining this methodology to define a low-wage job as one that pays much less than jobs in the middle and upper share of the labor market. The Organization for Economic Co-operation and Development (OECD), with 30 member countries including the United States, and many researchers, already use this approach.13 Accordingly, we define a low-wage job as one that pays less than two-thirds of the median wage for men. (A median-wage job is in the precise middle of the wage distribution. Half of all 9
The Bridging the Gaps project of the Center for Economic Policy and Research uses basic family budgets for this purpose. For more information, see http://www.bridgingthegaps.org/. 10 For more information on the concept of social inclusion and how low-wage work may present a barrier to inclusion, see Shawn Fremstad, “Social Inclusion and Social Policy in the United States,” Inclusion Working Paper, October 2005, http://inclusionist.org/files/socialinclusionusa.pdf. 11 Researchers use a variety of different percentiles under this approach. The Bureau of Labor Statistics, for example, ranks jobs by quartiles (fourths)—very-low-paying jobs are those held by workers with annual earnings that place them in the bottom one-fourth of total employment based on their earnings, and low-paying jobs are those held by workers in the next quartile. 12 Analysis by Heather Boushey of the CEPR extracts from the Current Population Survey Outgoing Rotation Group Files. 13 See, e.g., “OECD Submission to the UK Low Pay Mission,” Labour Market and Social Policy Occasional Papers No. 29, 1997, http://www.olis.oecd.org/OLIS/1997DOC.NSF/LINKTO/OCDE-GD(97)218.
4
The Mobility Agenda workers earn more than the median wage and half earn less.) We opt to use the median wage for men, rather than the median wage for all workers, to limit the extent to which gender inequality in wages affects the definition of low-wage jobs. In short, our preferred definition of low-wage work is any job that pays substantially less than the job held by a typical male worker. The median wage for men in the United States in 2006 was $16.66 an hour; jobs paying less than two-thirds of the median wage for men paid $11.11 or less per hour. Some 44 million workers—about one out of every three—held low-wage jobs paying much less than the rest of us are paid. The social-inclusion approach best captures what is most troubling about low-wage work in a wealthy nation like the United States. An economy that leaves a substantial segment of workers far behind the rest of the workforce is contrary to the national belief that the United States is “one nation, indivisible.” Greg Clark, a Conservative member of Parliament in the United Kingdom, provides the following vivid image to make a similar point about income inequality: One can picture our nation as a convoy crossing the desert. Everyone may be moving forward, but if the distance between those right at the back and [the] rest of the convoy keeps growing there comes a point at which it breaks up.14 Understood in this way, low-wage work is problematic not only because it leaves individual workers behind, but also because of the impact it has on the United States as a whole. As a nation, we are stronger and more cohesive if we have an economy that does not allow those at the back to fall so far behind that the essential unity of the nation breaks up. While this is primarily a normative argument, there is empirical evidence to back it up. In a recent survey of approaches to measuring poverty, John Cassidy argued that poverty in the United States should also be measured using a social-inclusion approach. Cassidy bases his argument in part on research suggesting that social exclusion has negative impacts on the health and well-being even of persons who do not lack basic incomes.15 While we favor the social-inclusion approach, we will also draw on labor market research that uses other methods to define low-wage work, as well as variations on these approaches. Despite differences in their conceptual justifications, a low-wage job is similar under both approaches: a low-wage job paid less than $9.83 to $11.64 an hour in 2006—$20,447 to $24,211 a year, for full-time, year-round work.16 14
Greg Clark, “Poverty Is Too Important an Issue to Leave to the Labour Party,” Conservative Home Blogs, http://www.tinyurl.com/wkjlo. Clark’s convoy image is borrowed from journalist Polly Toynbee’s book Hard Work: Life in Low-Pay Britain, London: Bloomsbury, 2003. See Polly Toynbee, “If Cameron Can Climb On My Caravan, Anything Is Possible,” The Guardian, November 23, 2006, http://www.guardian.co.uk/commentisfree/story/0,,1954789,00.html. 15 See John Cassidy, “Relatively Deprived: How Poor Is Poor,” The New Yorker, April 3, 2006, http://www.newyorker.com/fact/content/articles/060403fa_fact. 16 An additional strength of the social-inclusion approach is that it can be applied to wage data for a specific region. The poverty-line approach does not easily consider regional differences. An important body of research on basic family budgets addresses this limitation by using data on the cost of goods and services at the local level to determine the amount of income a family needs to have a basic standard of living. See Bernstein, Brocht, and Spade-
5
Understanding Low-Wage Work in the United States
Defining Low-Wage Work Poverty Level Much less than the rest
Basic-Income Approach 35 million workers Social-Inclusion Approach 44 million workers
$9.83 $11.11
Wages are not the only measure of good jobs, however. A good job provides both “good” wages and “good” working conditions, as well as employment benefits. For example, in a recent report, John Schmitt, an economist at the Center for Economic and Policy Research, defined a good job as one that pays at least $16 an hour, offers health insurance that is at least partly paid by the employer, and provides a pension plan.17 Schmitt also noted that: … these are not the only factors that would enter into a complete determination of whether a particular job is good. Other important job features would include the schedule, the amount of paid vacation and sick leave, the degree of job security, the level of on-the-job health and safety protections, the availability of familyfriendly policies, and many others. Schmitt finds that one in four jobs (25.2 percent) in 2004 were good jobs, and a similar share (26.6 percent) were bad jobs (jobs that did not meet any of the three criteria). By this measure, more than 30 million jobs are bad jobs. This report is about the low-wage labor market and focuses on defining only one dimension (wages) of good jobs. In a subsequent section, however, we review research revealing that lowwage jobs usually do not provide the benefits and flexibility associated with good jobs. Low-Wage Workers: Not Mostly Teenagers and Voluntary Part-Timers This paper defines low-wage work, quantifies the number of low-wage jobs, and describes the general characteristics—including health insurance and other benefits—of these jobs. Because we focus on jobs rather than workers, we provide little information about the demographic characteristics of lowwage workers. However, it is important to address two common myths: first, low-wage workers are mostly part-time employees with little interest in working full time; second, they are mostly teenagers. In fact, only 30.1 percent of low-wage workers (as defined under our preferred social-inclusion approach) were part-time workers in 2006 and a significant share of such workers are involuntarily underemployed. That is, they were working part time even though they would prefer to be working full time. Similarly, among low-wage workers who are between the ages of 18 and 64, about twothirds—64.2 percent—are older than 24 and younger than 60.
Aguilar, How Much Is Enough? The Economic Policy Institute has an online calculator that provides basic family budgets for over 400 U.S. communities: http://www.epi.org/content.cfm/datazone_fambud_budget. 17 John Schmitt, “How Good Is the Economy at Creating Good Jobs?” Center for Economic Policy and Research, October 2005. Because Schmitt is interested in assessing the extent to which the economic growth that took place between 1979 and 2004 has translated into similar improvements in jobs, his threshold good-job pay rate of $16 an hour equals the median hourly pay for men in 1979, adjusted for inflation since then.
6
The Mobility Agenda
Downward Trends i n W a g e L ev els f or L ow-Wa g e J o bs Figures 1 and 2 show the trends in wage levels for low-wage jobs over time using both socialinclusion definitions of low-wage work. These tables track the growth in inflation-adjusted wages since 1979.
Figure 1 shows the trends in wages for each third of the labor force.
•
The top third has seen consistent upward growth in wages since 1979.
•
Wages for the middle third were stagnant between 1979 and 1993, but increased steadily between 1994 and the first years of the 21st century.
7
Understanding Low-Wage Work in the United States
Figure 2 shows the trends in wages using the much-less-than-the-rest approach.
•
The wage trend for low-wage workers under this approach is roughly similar to that of the bottom third until about 2001.
•
Between 2001 and 2005, however, low-wage workers as measured under this approach experience a sharper decline in wages than the bottom third. By 2005, their wages had almost fallen back to 1979 levels.
8
The Mobility Agenda
The P o or W ork C o nd it i o ns o f L ow-Wa ge J o bs Most low-wage jobs do not provide benefits that are typically associated with a good job. As author Beth Shulman notes, “Inadequate wages are only the beginning. Low-wage jobs also mean few or no benefits, rigid schedules, late-night shifts, unsafe and unhealthy conditions, and lack of respect.”18 As we detail below, an extensive array of labor market research supports this conclusion. Health, Disability, and Life Insurance Low-wage jobs are less likely than higher-wage jobs to come with health insurance and other forms of insurance. •
According to the Economic Policy Institute, about 24 percent of workers in the bottom wage quintile have employer-provided health coverage, compared to 62 percent of workers in the middle wage quintile and 78 percent of workers in the top quintile.19 However, rates of employer-provided coverage have declined over the last 25 years for all quintiles.
•
Lower rates of employer-provided coverage also mean lower rates of coverage overall. Low-wage working mothers are much less likely to have employer-provided health insurance than higher-wage working mothers, and much more likely to have no coverage at all.20
•
According to the Bureau of Labor Statistics (BLS), workers earning an average wage of less than $15 per hour are much less likely to have access to dental care, vision care, or prescription drug coverage as part of their employer-provided health care package. For example, only 34 percent of lower-wage employees had access to dental care benefits compared to 62 percent of higher-wage employees.21
•
Employees in jobs with wages under $15 per hour paid a greater share of employment-based health care premiums than employees working in higher-paying jobs. For example, employees in the lower-wage jobs paid 34 percent of medical insurance premiums; employees in higher-wage jobs paid 27 percent of such premiums.22
•
Only 17 percent of workers earning under $15 per hour had access to long-term disability insurance, compared with 48 percent of those with higher wages. Lower-wage workers were also less likely to have access to life insurance and short-term disability insurance.23
18
Shulman, The Betrayal of Work, p. 25. Economic Policy Institute, “Change in Private Sector Employer-Provided Health Insurance Coverage, 19792004,” http://www.epi.org/datazone/06/health_ins.pdf. 20 Sunhwa Lee, “Women’s Work Supports, Job Retention, and Job Mobility,” Institute for Women’s Policy Research, November 2004, p. 2, http://www.iwpr.org/pdf/C359.pdf. 21 National Compensation Survey: Employee Benefits in Private Industry in the United States, March 2006, Bureau of Labor Statistics, August 2006, http://www.bls.gov/ncs/ebs/sp/ebsm0004.pdf, table 1. 22 National Compensation Survey, March 2006, table 11. 23 National Compensation Survey, March 2006, table 4. 19
9
Understanding Low-Wage Work in the United States The BLS National Compensation Survey provides data on both access to, and participation in, employee benefit plans. Employees have “access” to a plan if it is available for their use; they “participate” in a plan if they have paid the required contributions and fulfilled any applicable service requirements. Lower-wage employees have lower rates of participation in health care and retirement benefits that they have access to, in part because of the cost to them of participation. For example, according to the BLS data, about two-thirds of lower-wage employees who have access to medical care benefits participate in those benefits, compared to about four-fifths of higher-wage employees. There is little difference in participation rates by wage level when it comes to benefits that do not typically require employee contributions, such as life insurance and disability benefits. Retirement Benefits Low-wage jobs are less likely to provide pension coverage or other retirement plan options with employer contributions. •
Only about 14 percent of workers in the bottom wage quintile have employer-provided pension coverage, compared to about 48 percent in the middle quintile and 72 percent in the top quintile.24
•
Research conducted by the Families and Work Institute found that one-third of low-wage jobs provide a retirement plan option with an employer contribution, compared to almost two-thirds of mid-wage jobs and four-fifths of high-wage jobs.25
•
According to the Bureau of Labor Statistics, among workers earning less than $15 an hour, some 11 percent have access to defined benefit pension plans and 43 percent have access to defined contribution retirement plans; among workers earning more than $15 per hour, 34 percent have access to defined benefit pension plans and 69 percent have access to defined contribution retirement plans.26
Paid Time Off Jobs held by low-wage and low-income employees are much less likely to provide leave with pay for illness, vacations, and holidays. According to the Families and Work Institute:27 •
Only 39 percent of these low-wage jobs offer any paid sick days for personal illness, compared to 79 percent of jobs held by mid- and higher-wage and -income employees. Among workers with paid sick days for illness, middle- and higher-wage employees were more likely to say that the amount of paid time off was sufficient to meet their personal needs.
24
Economic Policy Institute, “Change in Private Sector Employer-Provided Pension Insurance Coverage, 19792004,” http://www.epi.org/datazone/06/pension_ins.pdf. 25 Families and Work Institute, “What Do We Know About Entry-Level, Hourly Employees?” Research Brief No. 1, November 2006, p. 7, http://familiesandwork.org/eproducts/brief1.pdf. This study defined a low-wage job as one paying less than $9.73 per hour in 2005 and a mid-wage job as one paying between $9.73 and $24.88 per hour. 26 National Compensation Survey, March 2006, table 1. 27 Families and Work Institute, Research Brief No. 1, table 2.
10
The Mobility Agenda
•
Only 51 percent of these low-wage jobs provide paid vacation days, compared to almost 90 percent of jobs held by higher-wage and -income employees.
•
Similarly, only 54 percent of these low-wage jobs provide paid holidays.
Workplace Flexibility The Families and Work Institute defines “workplace flexibility” to include “policies and practices that give employees greater control over their work schedules, work locations, and the ability to take time off to meet personal or family needs.”28 The researchers find that low-wage jobs provide much less workplace flexibility than higher-wage jobs. •
About 38 percent of jobs held by low-wage and low-income employees are lowflexibility jobs compared to 19 percent of other jobs.
•
Low-wage jobs provide much less flexibility for child care. Only 24 percent of low-wage jobs allowed parents any paid time off to care for a sick child (without having to use paid vacation days) compared to 54 percent of other jobs.
•
In some respects, flexibility was similarly limited in both low-wage and other jobs. For example, only about one-third of jobs provide employees complete or much control in scheduling work hours, and there is no difference between low-wage and other jobs on this measure.
Training and Education Low-wage jobs are less likely to provide training or education than better-paying jobs: •
A 2002 research review conducted by the Workforce Investment San Francisco Board concluded that higher-paid jobs are more likely to include employer-provided training.29
•
In recent research, the Families and Work Institute found that only 45 percent of jobs held by low-wage and low-income employees offer training or education for job skills
28
James T. Bond and Ellen Galinsky, “How Can Employers Increase the Productivity and Retention of Entry-Level, Hourly Employees?” Families and Work Institute, November 2006. The Institute uses 15 measures to gauge workplace flexibility: having traditional flextime (setting daily hours within a range periodically); having daily flextime; being allowed to take time off during the workday to address family matters; being allowed some amount of paid time off for personal illness; having enough paid time off for personal illness; being able to take a few days off to care for a sick child without losing pay or having to use vacation days; being able to take enough time off to care for a sick child; being able to work some regular, paid hours at home; being able to take breaks when one wants to; having complete or a lot of control in scheduling work hours; if part time, being a voluntary part-time employee; if full time, being able to move into a part-time job in the same position; having a supervisor who is accommodating when family or personal business arises; believing that one can use flexible work arrangements without jeopardizing job advancement; and seldom being required to work paid or unpaid overtime with little or no notice. 29 Workforce Investment San Francisco Board, “Research Brief: Employer-Provided Training,” 2002. http://www.picsf.org/research/misc2002/brief_10-02_er_training.pdf.
11
Understanding Low-Wage Work in the United States enhancement, compared to 64 percent and 81 percent of middle-wage and high-wage jobs, respectively. •
Better-educated workers are more likely to receive employer-provided education and training than less-educated workers.30
Table 1. Findings from Families and Work Institute Survey Benefit Health Coverage with Employer Contribution: Individual Worker
Wage and Income Group LowMidHigh-Wage/Income Wage/Income Wage/Income 42% 87% 94%
Health Coverage with Employer Contribution: Individual Worker and Family
34%
78%
87%
Paid Time Off for Personal Illness
39%
74%
90%
Paid Vacation Days
51%
89%
88%
Paid Holidays
46%
86%
89%
Pension (Defined Benefit)
16%
39%
48%
Any Retirement Plan with Employer Contribution
32%
72%
87%
Job Training or Education
45%
64%
81%
Source: Adapted from Table 2 in Families and Work Institute, 2006.
30
See Gary P. Green, “Gender, Race and Employer-Provided Job Training in Low-Wage Jobs,” Rural Poverty Center Working Paper No. 06-01, February 2006.
12
The Mobility Agenda
The L ar gest L ow- Wag e O c c u pat i o ns: R et ai l S al es, J anit ori al S er vi c es and C l ea ni ng, C hi l d C ar e, and R est aurant W ork Low-wage jobs are often described as service-sector jobs. While it is true that most low-wage jobs are in service industries, it is also true that the vast majority of all jobs in the economy, including large numbers of better-paying jobs, are in the service sector. About 83 percent of jobs are in service-providing industries and the remaining 17 percent are in goods-producing industries. It is more helpful to examine which occupations are predominately low-wage ones. The Bureau of Labor Statistics defines an occupation as: … a set of activities or tasks that employees are paid to perform. Employees that perform essentially the same tasks are in the same occupation, whether or not they are in the same industry. Some occupations are concentrated in a few particular industries, other occupations are found in the majority of industries.31 Data available from the Bureau of Labor Statistics identify these occupations. Each year, the Bureau of Labor Statistics produces occupational employment and wage estimates based on data collected in a national survey of employers. BLS uses the Standard Occupation Classification system, which categorizes all jobs into 821 detailed occupations and 23 major groupings of detailed occupations. We define a low-wage occupation as one in which half or more of the workers earn $11.11 or less an hour. As table 2 shows, six of the 23 major groupings of occupations are low-wage ones—occupational groups in which at least half of all jobs pay low wages. Table 3 lists the largest low-wage occupations (as opposed to occupational groupings). All of the occupations listed in table 3 employ more than half a million employees. Among other things, this table shows that: •
The single largest low-wage occupation is retail sales, with 4.3 million workers in 2005, half of whom earned less than $9.20 an hour.
•
The median wage for janitors and cleaners (not including maids and housekeeping cleaners) is $9.23 an hour; 2.1 million workers held such jobs in 2005.
•
Care providers—including child care workers, personal and home care aides, and home health aides—make up another major segment of the low-wage workforce. Half of the 557,000 workers who provide child care earn less than $8.20 an hour.
31
Bureau of Labor Statistics, “What Basic Concepts are Essential to Understanding the OES Survey?” http://www.bls.gov/oes/oes_ques.htm#Ques2. See the appendix for more information on the Occupational Employment Survey occupational groupings.
13
Understanding Low-Wage Work in the United States
Table 2. Low-Wage Occupations in 2005: Major Occupational Categories
Occupational Title Sales and related occupations Food preparation and serving related occupations Building and grounds cleaning and maintenance occupations Healthcare support occupations Personal care and service occupations Farming, fishing, and forestry occupations
Total Employed
10th Percentile Hourly Wage
25th Percentile Hourly Wage
Median Hourly Wage
75th Percentile Hourly Wage
90th Percentile Hourly Wage
13,930,320
$6.62
$7.84
$10.64
$18.48
$31.24
10,797,700
$5.83
$6.53
$7.73
$9.72
$12.77
4,342,550
$6.59
$7.66
$9.50
$12.44
$16.40
3,363,800
$7.43
$8.86
$10.64
$13.34
$16.63
3,188,850
$6.21
$7.22
$8.89
$11.88
$17.11
443,070
$6.66
$7.41
$8.41
$11.34
$16.28
Source: Authors' analysis of Bureau of Labor Statistics, Occupational Employment Survey, May 2005. Excludes self-employed.
Waiters and waitresses have the lowest earnings. About half earn less than $14,050 a year. Almost 2.3 million workers are waiters or waitresses.
14
The Mobility Agenda
Table 3. Low-Wage Occupations in 2005: Occupations with More than 500,000 Employees Occupational Title
Total Employed
10th Percentile Hourly Wage
25th Percentile Hourly Wage
Median Hourly Wage
Retail salespersons
4,344,770
$6.54
$7.55
$9.20
Cashiers
3,481,420
$5.98
$6.75
$7.82
Office clerks, general
2,997,370
$6.98
$8.79
$11.09
Laborers and freight, stock, and material movers, hand
2,363,960
$6.88
$7.99
$9.91
Combined food preparation and serving workers, including fast food
2,298,010
$5.69
$6.28
$7.11
Waiters and waitresses Janitors and cleaners, except maids and housekeeping cleaners
2,274,770
$5.64
$6.18
$6.83
2,107,360
$6.50
$7.56
$9.32
Stock clerks and order fillers
1,625,430
$6.82
$7.84
$9.66
Nursing aides, orderlies, and attendants
1,391,430
$7.49
$8.84
$10.31
Receptionists and information clerks
1,088,400
$7.31
$8.81
$10.65
Security guards
994,220
$6.99
$8.16
$9.98
Landscaping and groundskeeping workers
896,690
$7.08
$8.14
$9.94
Maids and housekeeping cleaners
893,820
$6.16
$7.08
$8.21
Food preparation workers
880,360
$6.18
$7.04
$8.19
Packers and packagers, hand
840,410
$6.18
$7.06
$8.36
Cooks, restaurant
791,450
$6.82
$7.91
$9.54
Home health aides
663,280
$6.80
$7.67
$9.04
Cooks, fast food
631,190
$5.74
$6.37
$7.25
Tellers
599,220
$7.82
$9.02
$10.24
Personal and home care aides
566,860
$6.00
$6.96
$8.34
Child care workers
557,680
$6.03
$6.88
$8.20
Helpers--production workers Counter attendants, cafeteria, food concession, and coffee shop
528,610
$6.97
$7.99
$9.80
501,390
$5.90
$6.58
$7.60
Source: Authors' analysis of Bureau of Labor Statistics, Occupational Employment Survey, May 2005. Employment figures exclude self-employed.
15
Understanding Low-Wage Work in the United States
P ul l i n g A p art: The In cr ease i n In eq ual i t y a nd t h e Decl i n e i n E c o n o mi c M o bi l it y Returning to the metaphor of the U.S. workforce as a caravan or convoy crossing the desert, we have established that there are a large number of workers—about one in three—who have fallen far behind the rest of us. But is the gap growing or shrinking?
Recent evidence suggests it is growing. The U.S. labor market has become increasingly divided into “high-wage and low-wage jobs at the expense of middle-wage work.”32 Figure 3 illustrates 32
David Autor, Lawrence Katz, and Melissa Kearney, “The Polarization of the U.S. Labor Market,” National Bureau of Economic Research, January 2006. For an earlier analysis of labor-market polarization in Great Britain, see Maarten Goos and Alan Manning, “Lousy and Lovely Jobs: the Rising Polarization of Work in Britain,” Centre for Economic Performance, London School of Economics and Political Science, December 2003. Goos and Manning also review literature on the U.S. trends and conclude that “[a]lthough these studies do differ slightly in their conclusions, common themes do emerge, most notably that, in the last 30 years, there has been a very big increase in the number of high-paid jobs and (probably) an increase in the number of low-paid service jobs ….”
16
The Mobility Agenda this polarization, charting the change in share of occupations based on their place in the wage distribution over two decades: 1980 to 1990 and 1990 to 2000. The red line shows that the share of jobs with wages in the bottom 20th percentile increased during the 1990s, as did the share of jobs with wages in roughly the top third of the wage distribution. The share of middle-class jobs declined. Moreover, inequality in the United States is complicated by limited economic mobility. A review of the evidence on economic mobility over time in the United States shows that most low-wage workers do not usually move up. One of the leading studies, conducted by Katherine Bradbury and Jane Katz of the Federal Reserve Bank of Boston, tracked families’ incomes over 10-year periods.33 Among families with incomes that put them in the bottom fifth of the income distribution, slightly more than half remained there after 10 years, and about a quarter had moved up, but only to the second quintile of earners. (See figure 4.) Moreover, among families who started out in the second fifth, about a quarter dropped to the bottom fifth over the 10-year period. Bradbury and Katz also found a decline in mobility over time. In general, mobility rates were higher in the 10-year period of 1969-79 than in 1988-98. They also find that mobility in recent decades has been achieved in large part by working more hours—particularly by wives—and not simply by movement into increasingly better jobs over time.34 Another way to examine mobility is to consider the ability of children to improve on the economic circumstances of their parents. Studies of this kind of mobility—typically known as intergenerational mobility—find that children who are born into low-income families in the United States have much less chance of moving up as adults than children who are born into better-off families have of maintaining their status or moving up. Moreover, many advanced economies, including those of Canada and the nations of Scandinavia, have significantly more intergenerational mobility than the United States.35 In very simple terms, we have many more entry-level (low-wage) jobs than we have entry-level workers—that is, workers who are new to the labor market—and too few jobs that provide a middle-class or better standard of living for the vast bulk of workers who have spent years in the labor market. It turns out that in the U.S. labor market, it is not possible for everyone to be middle class, no matter how hard they work. Moreover, it has been getting harder to do over time. 33
Katherine Bradbury and Jane Katz, “Are Lifetime Incomes Growing More Unequal? Looking at New Evidence on Family Income Mobility,” Regional Review, Federal Reserve Bank of Boston, Fourth Quarter 2002; Bradbury and Katz, “Women’s Labor Market Involvement and Family Income Mobility When Marriages End,” New England Economic Review, Fourth Quarter 2002; Bradbury and Katz, “Wives’ Work and Family Income Mobility,” Public Policy Discussion Papers, No. 04-3, Federal Reserve Bank of Boston, 2004. 34 This may be changing—in a recent survey, Hertz finds that in 2003-04, “people who work long hours on a consistent basis no longer appear to be able to generate much upward mobility for their families.” Tom Hertz, “Understanding Mobility in America,” Center for American Progress, April 2006, http://www.americanprogress.org/kf/hertz_mobility_analysis.pdf. 35 See also Hertz, “Understanding Income Mobility,” in Unequal Chances: Family Background and Economic Success, edited by Samuel Bowles, Herbert Gintis, and Melissa Osborne Groves, New York: Russell Sage Foundation, 2005; and Heather Boushey, “Horatio Alger Is Dead”, Center for Economic Policy and Research, 2005 (presentation).
17
Understanding Low-Wage Work in the United States
18
The Mobility Agenda
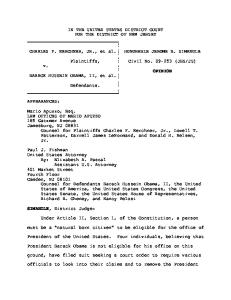
Ma n y W or kers Hav e Not Be n efit ed Fr om T heir In cr eased O utput a nd Pr o d u ct i vit y While productivity has driven overall economic growth, the average worker in the United States has not shared in the benefits. In recent years, despite increases in the overall productivity of the workforce, wages have been stagnant or falling in real terms. For several decades before 1980, productivity growth and wages rose together—in other words, U.S. workers were more productive and they shared equitably in the gains from their productivity. But, as figure 5 shows, in the last few decades workers have continued to become more productive, but they have not shared in the gains from their increased productivity. Between 1973 and 2006, productivity increased by 83 percent, while the median wage increased by only 13 percent.36
Fig. 5. Producing More, Benefiting Less: Trends in Productivity and Wages, 1973 to 2006.
1973 = 100
Since 1973, labor productivity has increased by 83 percent, but the median wage has increased by only 13 percent.
Source: Analysis by John Schmitt of CEPR of Current Population Survey Outgoing Rotation Group and CPS May Earnings Supplement (1973-1978, from Economic Policy Institute) and Bureau of Labor Statistics data.
36
Using a broader measure of compensation—one that includes health care and retirement benefits—does not significantly change this analysis. See Economic Policy Institute, “The State of Working America 2006/2007,” September 2006 advance proofs, fig. 3N.
19
Understanding Low-Wage Work in the United States Similarly, John Schmitt of the Center for Economic Policy and Research finds that the percentages of good jobs and bad jobs changed relatively little between 1979 and 2004, even though national income on an average per-person basis grew from about $24,000 in 1979 to $38,500 in 2004. In short, instead of the rising tide lifting all boats, it did little to lift a greater share out of bad jobs or into good jobs. Moreover, after controlling for improvements between 1979 and 2004 in the human capital of the U.S. workforce—American workers today are, on average, older and much better educated than they were at the end of the 1970s—Schmitt finds that the economy now produces 25 to 30 percent fewer good jobs than it did 25 years ago. The experience of other advanced economies shows that it is possible to combine economic growth with higher standards of living for more citizens. People living in the United States are more likely to live poorly in economic terms than are people living in nearly all other advanced nations. About one in four full-time jobs in the United States pay less than two-thirds of median earnings. Most other countries with advanced economies have a much larger proportion of middle- and upper-wage jobs than the United States.37
37
See Marco Mira d’Ercole and Andrea Salvini, “Towards Sustainable Development: The Role of Social Protection,” Organization for Economic Co-operation and Development, Social, Employment and Migration Working Paper #12.
20
C o n c l usi o n: New Id eas for Bett er J o bs There is no precise, universally accepted definition of low-wage work, but two widely used approaches set the threshold for low-wage work in the range of $9.83 to $11.64 an hour in 2006, or, for a full-time worker, $20,447 to $24,211 a year—well below what is necessary for even a relatively modest standard of living in this country. The best definition of low-wage work in our view—one we call the social-inclusion approach— defines a low-wage job as one that pays substantially less than the job held by a typical male worker. We define substantially less as less than two-thirds of the median wage for a male worker. The median wage for men in the United States in 2006 was $16.66 an hour; jobs paying less than two-thirds of the median wage for men paid $11.11 or less per hour. Some 44 million workers—about one out of every three—held low-wage jobs under this definition. Regardless of the measure used, at a minimum more than 30 million jobs pay low wages in today’s economy and more than one in four U.S. workers holds one of these jobs. Most lowwage jobs do not provide benefits that are typically associated with a good job and the workers employed in low-wage jobs have limited economic mobility. The U.S. labor market has become increasingly polarized into “high-wage and low-wage jobs at the expense of middle-wage work.”38 Our public and private policy must acknowledge this reality and provide solutions to turn low-wage jobs from bad jobs into better jobs. The Mobility Agenda staff surveyed stakeholders across the country about new ideas and strategies for improving wages and working conditions in the low-wage labor market. Our initial scan in 2006 identified seven categories of new ideas and strategies for additional research: paid time off and flexible work schedule policies, employer investment strategies, democratic workplaces, accountable development, portable retirement accounts, health care coverage, and wage and hour enforcement.39 In a series of regional meetings, policy briefs, and briefings, The Mobility Agenda staff will analyze these ideas and bring them to the attention of research and policy-making communities, including community leaders, local and state elected officials, academics, organizers, advocates, and the broader public. This work will expand understanding of low-wage work, stimulate public debate, inform the decisions of policy-makers, and promote the creation of better jobs and a stronger economy.
38
Autor, Katz, and Kearney, “Polarization of the U.S. Labor Market.” Margy Waller, “National Scan Summary,” The Mobility Agenda, December 2006, http://www.inclusionist.org/files/CMC/scan-summary.pdf. 39
Understanding Low-Wage Work in the United States
A ppend i x Distinguishing Between Service Occupations and the Service-Providing Industries Jobs are often classified by industry sector or subsector. There are two general industry sectors: goods-producing industries and service-providing industries. Under the classification used by the U.S. Department of Labor, each sector has the following subsectors: Goods-Producing -natural resources and mining -construction -manufacturing
Service-Providing -trade, transportation, and utilities -information -financial activities -professional and business services -education and health services -leisure and hospitality -other services
About 83 percent of jobs are in the service-providing sector, while 17 percent are in the goodsproducing sector. Jobs can also be classified by occupation. Employees that perform essentially the same tasks are in the same occupation, whether or not they work in the same industry. Some occupations are concentrated in a few particular industries; other occupations are found in many industries. There are more than 800 occupational categories and 23 major occupational groups: Management Business and financial operations Computer and mathematical occupations Architecture and engineering Life, physical, and social sciences Community and social services Legal occupations Education, training, and library occupations Arts, design, entertainment, sports, and media Health care practitioners/technical occupations Health care support occupations Protective service Food preparation/serving-related occupations Building and grounds cleaning/maintenance Personal care and service
Sales and related occupations Office and administrative support Farming, fishing, and forestry Construction and extraction Installation, maintenance, and repair Production Transportation and material moving Military-specific occupations
22