Behav Ecol Sociobiol (2007) 61:679–688 DOI 10.1007/s00265-006-0296-8
ORIGINAL ARTICLE
Can environmental heterogeneity explain individual foraging variation in wild bottlenose dolphins (Tursiops sp.)? Brooke L. Sargeant & Aaron J. Wirsing & Michael R. Heithaus & Janet Mann
Received: 6 October 2005 / Revised: 17 October 2006 / Accepted: 19 October 2006 / Published online: 5 December 2006 # Springer-Verlag 2006
Abstract Because behavioral variation within and among populations may result from ecological, social, genetic and phenotypic differences, identifying the mechanism(s) responsible is challenging. Observational studies typically examine social learning by excluding ecological and genetic factors, but this approach is insufficient for many complex behaviors associated with substantial environmental variation. Indian Ocean bottlenose dolphins (Tursiops sp.) in Shark Bay, Western Australia show individual differences in foraging tactics, including possible tool use with marine sponges and social learning may be responsible for this diversity. However, the contributions of ecological Communicated by T. Czeschlik B. L. Sargeant : J. Mann Department of Biology, Georgetown University, Washington, DC 20057, USA A. J. Wirsing Department of Biological Sciences, Behavioural Ecology Research Group, Simon Fraser University, Burnaby BC V5A 1S6, Canada
factors to the development of these foraging tactics were not previously investigated. Here, we determined the relationship between ecological variables and foraging tactics and assessed whether differences in habitat use could explain individual differences in foraging tactics. We monitored 14 survey zones to identify how foraging tactics were spatially distributed and matched behavioral data to the ecological variables within each zone. Three of four foraging tactics were significantly correlated with ecological characteristics such as seagrass biomass, water depth, presence of marine sponges and season. Further, individual differences in habitat use were associated with some tactics. However, several tactics overlapped spatially and previous findings suggest demographic and social factors also contribute to the individual variation in this population. This study illustrates the importance of environmental heterogeneity in shaping foraging diversity and shows that investigating social learning by ruling out alternative mechanisms may often be too simplistic, highlighting the need for methods incorporating the relative contributions of multiple factors.
M. R. Heithaus Department of Biological Sciences, Marine Biology Program, Florida International University, Biscayne Bay Campus ACI 371, 3000 NE 151 Street, North Miami, FL 33181, USA
Keywords Foraging . Bottlenose dolphins . Ecological variation . Social learning
J. Mann Department of Psychology, Georgetown University, Washington, DC 20057, USA
Introduction
Present address: B. L. Sargeant (*) Department of Biological Sciences, Florida International University, 11200 SW 8th Street, Miami, FL 33199, USA e-mail:
[email protected]
Indian Ocean bottlenose dolphins (Tursiops sp.) in Shark Bay, Western Australia exhibit a diverse array of foraging tactics that vary substantially among individuals and demographic groups (Mann and Sargeant 2003). Although social learning has been proposed as one mechanism for this diversity (Mann and Sargeant 2003; Krützen et al. 2005), alternative mechanisms have not been fully examined.
680
Here, we assess the contribution of ecological heterogeneity in creating this variation. The importance of social learning in foraging variation has recently received considerable attention and debate (e.g., Heyes and Galef 1996; Whiten et al. 1999; Rendell and Whitehead 2001; Fragaszy and Perry 2003a; Laland and Hoppitt 2003). Experimental support for socially learned foraging behaviors has been well documented in a number of non-cetacean species in captivity (e.g., Palameta and Lefebvre 1985; Aisner and Terkel 1992; Laland and Williams 1997; Galef 2003) and in the field (Reader et al. 2003), but such experimental techniques are not feasible for wild cetaceans. Scientists have examined social learning in observational studies of wild populations for decades, primarily in non-human primates, but this process has proved challenging. In practice, researchers typically attempt to rule out ecological and genetic factors as possible explanations for differences between groups, leaving social learning as the remaining candidate (Boesch et al. 1994; McGrew et al. 1997; Whiten et al. 1999; van Schaik et al. 2003a). In light of this new paradigm, measuring ecological contributions to foraging diversity is critical for at least two reasons. First, a common goal is to document social learning by identifying whether ecology can explain differences among individuals or groups. However, this method is questionable because a lack of ecological contribution cannot be proven (equivalent to “proving the null”) (Fragaszy and Perry 2003b). Even in the relatively few studies of animal culture that have sought to rigorously address ecological differences (Boesch et al. 1994; McGrew et al. 1997; van Schaik and Knott 2001; Humle and Matsuzawa 2002; Hunt and Gray 2003; van Schaik et al. 2003a,b), it is unclear how exhaustively one must search before confidence in a lack of ecological explanation is achieved (Laland and Hoppitt 2003; Galef 2004). In fact, some proposed cultural behaviors initially assumed to lack an ecological explanation have later been found to have significant correlations with prey or habitats (Humle and Matsuzawa 2002). Therefore, thorough attempts to identify relevant ecological differences and multivariable methods are required to address behavioral diversity before one can infer solely cultural explanations. Second, appropriate ecological contexts are a precondition for a given tactic to be successful so ecological correlates of foraging behaviors should be expected. Accordingly, several studies have linked ecological variables to foraging behaviors, including putative cultural variants that differ among groups (Humle and Matsuzawa 2002; van Schaik et al. 2003b; Sanz et al. 2004). Thus, contributions of both ecological and social factors are likely common. Insofar as methodological approaches to the study of social learning seek to exclude ecological contributions, the complex interactions of factors
Behav Ecol Sociobiol (2007) 61:679–688
involved in foraging development are oversimplified and false dichotomies are generated. Therefore, methods need to be developed that allow social learning to be examined in concert with other factors. Variation in foraging behaviors has been documented within and across multiple populations of cetaceans (e.g., Hoelzel et al. 1989; Baird 2000; Rendell and Whitehead 2001; Nowacek 2002; Mann and Sargeant 2003), but in many cases the factors underlying this diversity are not well understood. Cetacean foraging success may be linked to particular habitat characteristics and prey distribution patterns. For example, the highest densities of foraging Indian Ocean bottlenose dolphins are often found in shallow seagrass habitats that contain the highest densities of prey (Heithaus and Dill 2002), while the distribution of foraging bottlenose dolphins (Tursiops truncatus) in Moray Firth, Scotland is correlated with seabed gradients that may cause fish aggregations (Hastie et al. 2004). However, these studies did not address tactical diversity and how foraging tactics may change with habitats. Variation in foraging tactics should exist across habitats because ecological conditions should modify the relative success rates for different tactics. Indeed, specific foraging tactics used by dolphins are often associated with particular habitats such as seagrass flats, sand banks or shorelines (e.g., Guinet 1991; Hoelzel 1991; Rossbach and Herzing 1997; Connor et al. 2000). Whether the variation in foraging tactics among groups or individuals is related to habitat use or other factors, however, is less understood. Because alternative foraging behaviors can result from differences in demographic characteristics, phenotypes, genetics, social learning and ecology (e.g., Partridge and Green 1985; Boesch et al. 1994; Mann and Sargeant 2003), studies that directly examine the role of ecological factors are required. While foraging variation among groups was linked to differences in ecological conditions in a few cetacean studies (Hoelzel et al. 1989; Baird and Dill 1995; Chilvers and Corkeron 2001; Benoit-Bird et al. 2004; Whitehead and Rendell 2004), rarely are social, demographic and/or genetic contributions simultaneously considered (see Whitehead and Rendell 2004 for an exception) and few of these studies have addressed individual variation, leaving the specific factors influencing foraging tactics of individuals largely unresolved. In Shark Bay, dolphins use numerous foraging tactics and individual differences are clear (Mann and Sargeant 2003). For many tactics, one might predict an association with particular environmental features. Tail-out dives, for example, may be restricted to deeper water, while spongecarrying may be isolated to areas where sponges are present. Despite these predictions, however, it is possible that tactics overlap spatially and dolphins could potentially carry sponges to other areas. Thus, the relationships
Behav Ecol Sociobiol (2007) 61:679–688
between ecological habitats and tactics need to be quantified. Previous studies examining matrilineal similarity suggest at least some foraging tactics used by dolphins in Shark Bay involve vertical social learning, particularly from mothers to daughters (Mann and Sargeant 2003; Krützen et al. 2005). However, because mothers and calves tightly associate, ecological influences (in the absence of social learning) and vertical social learning could produce identical patterns of mother–calf similarity. Despite claims that ecological explanations can be excluded for at least some behaviors (Krützen et al. 2005), the contribution of ecological factors to the development of foraging tactics has not yet been investigated at the appropriate spatial scale. In addition, because Shark Bay dolphins have a fission–fusion social structure (Smolker et al. 1992) with differences in home range among associating individuals (e.g., WatsonCapps 2005), ecological differences likely correspond with the use of dissimilar tactics by individuals. Therefore, we examined whether dolphin foraging tactics in Shark Bay are associated with ecological factors and whether patterns of habitat use could potentially explain the intrapopulation variation that has been observed. For example, we compared the occurrence of sponge-carrying, the only known likely case of tool use (sensu Beck 1980) in wild dolphins, to the availability of tools (marine sponges), parallel to studies of tool use in primates (e.g., Boesch et al. 1994; McGrew et al. 1997; van Schaik and Knott 2001). Specifically, we examined whether: (1) foraging tactics overlap in spatial distribution; (2) foraging tactics are associated with habitat characteristics; (3) access to marine sponges is associated with variation in apparent tool use (sponge-carrying) and (4) sponge-carrying individuals use different habitats than individuals that do not carry sponges.
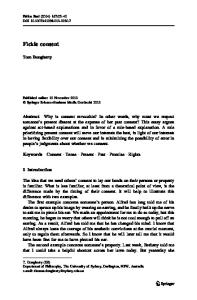
Materials and methods Study site We studied the spatial distribution of foraging tactics of wild Indian Ocean bottlenose dolphins (Tursiops sp.) offshore of Monkey Mia in Shark Bay, Western Australia (25° 47′ S, 113° 43′ E) (Fig. 1a) from 1997 to 1999 and 2004 as part of a longitudinal dolphin research project (established in 1984). Shark Bay is relatively shallow throughout with shallow seagrass banks (<4 m), deeper channels (>6 m) and embayment plains (4–13 m). Shallow areas compose approximately 17% of the study area and are largely covered (∼85–90%) by two seagrass species, Amphibolis antarctica and Posidonia australis (Heithaus and Dill 2002). The substrate of deeper waters is mainly sand or silt with a few isolated seagrass patches (Heithaus and Dill 2002; Heithaus 2004). Individual dolphins were
681
identified by natural dorsal fin shape and markings with the aid of a photographic catalogue (sensu Würsig and Würsig 1977). Sexes of most individuals are known and were determined by (1) the presence of a dependent calf (Smolker et al. 1992), (2) views of the ventral area (Smolker et al. 1992) and/or (3) DNA analyses (Krützen et al. 2003). Over 900 individual dolphins have been identified since 1982 and approximately 600 dolphins are seen frequently in the main study area (roughly 250 km2). Shark Bay bottlenose dolphins are referred to as Tursiops sp. because their species status remains unresolved. Field methods To quantify spatial variation in foraging tactics, three observers searched for dolphins at a speed of 6–9 km/h from 4.5 m outboard boats along 14 transects (Fig. 1b). Transects covered both shallow and deep habitats and were sampled repeatedly. Three of these transects (T10, T13, T14) were sampled only in 2004. Only dolphins within 300 m of the transect (i.e., a 600 m-wide “survey zone”) were used in analyses. As dolphins were commonly sighted up to 1 km from the transect, we are confident that sighting reliability of dolphins within 300 m of the transect was high. Transects were conducted in haphazard order with only one pass per transect counted per day. Only transect passes that were fully completed and conducted in good weather conditions (Beaufort state <3) were used. A total of 901 usable transect passes were conducted (n=63–100 passes per transect, except T10, T13 and T14 where n=9–10 passes per transect in 2004 only). All dolphins encountered within a survey zone transect were typically surveyed (n=907 surveys) at distances of ≤ 50 m. Surveys lasted at least 5 min, during which observers determined dolphin identities, predominant group behaviors, GPS location and any foraging behaviors. Only behaviors occurring in the first 5 min of surveys were used in analyses. Group composition was determined using a 10 m chain rule, i.e., dolphins within 10 m of any group member were considered part of the group (Smolker et al. 1992). Individual dolphins were normally surveyed only once during a particular transect pass, but were surveyed more than once if resighted in a new group in which unsighted dolphins were the majority (>50%). Foraging tactics were determined based on surfacing and diving characteristics, the presence of specific prey or the use of probable foraging tools (Table 1; Mann and Sargeant 2003). Surveys conducted from 1997 to 1999 (n=760) recorded data on foraging behaviors for the group while surveys conducted in 2004 (n=147) recorded all foraging tactics for individual dolphins. Therefore, for surveys conducted from 1997 to 1999, foraging tactics were sometimes coded post hoc based on diving and surfacing
682
Behav Ecol Sociobiol (2007) 61:679–688
Fig. 1 a Study area in the eastern gulf of Shark Bay, Western Australia. b Foraging tactics observed on transects in ≥15 surveys. Bathymetric map shows the areas of shallow (≤4 m; lightest shading), moderate (4–7 m; moderate shading) and deep (>7 m; darkest shading) water
patterns and other identifying characteristics and only the survey data collected in 2004 were used to identify individuals who engaged in sponge-carrying in our sample. Foraging behaviors occurred in the first 5 min of 558 of the 907 surveys conducted. However, foraging could only be categorized into defined tactics (Mann and Sargeant 2003) for 263 of the 558 surveys in which foraging occurred. Of the 11 tactics observed (described in Mann and Sargeant 2003), 5 were observed during transect surveys in ≤5 surveys. For each survey zone, seagrass biomass (aboveground volume), sponge coverage and water depth were quantified
in 2004. We selected these ecological variables because they were easily measurable and potentially linked to the differences in the use of particular foraging tactics across space. Within each survey zone, sampling stations (n=75– 120 per transect) were positioned every 200 m along the transect line and along parallel lines 100 and 200 m from the transect line. At each sampling site, a diver quantified percent seagrass coverage (m2) and height (cm) (species combined) within a 1-m2 quadrat dropped to the substrate. Within each quadrat, aboveground seagrass biomass (volume, km3) was estimated by multiplying seagrass coverage by seagrass height. These values were pooled and then
Behav Ecol Sociobiol (2007) 61:679–688
683
Table 1 Dolphin foraging tactics observed during systematic transects in Shark Bay Foraging tactic
Description
Reference
Bottom grubbing
Dolphin orients toward and pokes rostrum into the seagrass or the seafloor with the body positioned vertically; only visible in shallow water Dolphin chases fish belly-up and traps fish at the surface of the water Dolphin carries a sponge on its rostrum during stereotyped tail-out dive/peduncle dive foraging Dolphin surfaces in discrete bouts with tail-out and/or peduncle dives at a rate of 0.3/min; dolphin remains submerged 1–3 min
Mann and Sargeant 2003 Mann and Smuts 1999 Smolker et al. 1997
Snacking Sponge-carrying Tail-out/peduncle dive foraging
multiplied by the ratio of survey zone area to quadrat area to generate a total estimate of seagrass biomass for the survey zone. Similarly, sponge coverage was measured in each quadrat and expressed as the average percent of each quadrat’s area covered by sponges of the type carried by dolphins. Finally, water depth was expressed as the average of measurements taken at each sampling point using an echo sounder, which was corrected for tidal state. These ecological variables were assigned to each transect pass for analyses. Because transect passes were the experimental units, the use of average measurements across survey zones was appropriate despite potential microhabitat variation at finer scales within the survey zones. Shallow and deep transects were paired and alternated between deep and shallow areas across the study area, which decreases the likelihood of spatial autocorrelation (see Heithaus and Dill 2006). Statistical analysis To examine the spatial distribution and overlap of foraging tactics, 263 surveys during which foraging behaviors were sighted were plotted using GIS software (ArcView 3.2, Environmental Systems Research Institute). Snacking, tailout/peduncle dive foraging, bottom grubbing and spongecarrying were observed in 15, 66, 71 and 125 surveys, respectively. Other tactics were not observed with sufficient frequency for analysis. At least 304 individuals were surveyed 1–30 times each (mean=6.4, SD=6.1); 452 surveys included at least one dolphin that could not be individually identified. Surveys were summarized for each transect pass and each pass was then coded according to whether a given foraging tactic was observed at least once for at least one individual. Transect passes were coded according to season as warm (September– May) or cold (June–August) because the season is associated with shifts in dolphin habitat use and in the community of large vertebrates present in the bay (Heithaus 2001; Heithaus and Dill 2002). Logistic regression (SAS 9.1, SAS Institute) was used to test the effects of tidal height, season, seagrass biomass, water depth and season interactions on the probability of sighting each tactic along transect passes (n= 901 passes). Sponge coverage was only included in the
Mann and Sargeant 2003
analyses of sponge-carrying and tail-out/peduncle dive foraging. Correlations between explanatory values were weak enough to allow independent evaluation in the regression (all Pearson correlations |r|<0.75) (Meyers et al. 2006). Non-significant explanatory factors (p>0.05) were removed using a stepwise backward elimination procedure. We always included the survey zone area as a covariate in logistic regressions, regardless of its level of significance, to control for the variation in search effort among transects. The sample size was slightly smaller (n=892) for models including tidal height, but because the tidal height did not significantly contribute to the models in any case, all final models used 901 observations. Possible pseudoreplication caused by repeated passes of transects did not affect the model(s). Similar analyses conducted for tactics not predicted by season in which all data points were collapsed to generate a single value for each survey zone produced identical results (B.L. Sargeant, unpublished data). Thus, the costs of pseudoreplication were presumably low and outweighed by enhanced resolution (e.g., seasonal and tidal effects) and the ability to account for within-transect variance gained by using transect passes as the units of analysis. Unlike many other tactics (Mann and Sargeant 2003), the identification of sponge-carriers requires relatively few observations because sponge-carrying comprises a large portion of time budgets (ca. 45%) and consequently regular sponge-carriers are known (e.g., Krützen et al. 2005). Therefore, to determine whether non-sponge-carriers lack access to sponges, we also used transect surveys to determine the numbers of sponge-carriers and nonsponge-carriers sighted in survey zones in which sponges were available. To assess whether the relative use of habitats differed between female sponge-carriers (n=14) and female non-sponge-carriers (n=48), we compared the average transect depth, the average transect seagrass biomass and the percentage of surveys within spongecarrying survey zones of these two groups using Mann– Whitney U tests. We used non-parametric tests due to large differences in sample size between the groups and lack of normality and homogeneous variances. Sponge-carrying survey zones were defined as the five survey zones in which sponge-carrying was observed. For each female
684
Behav Ecol Sociobiol (2007) 61:679–688
surveyed at least five times, the variables were calculated over all surveys in which they were sighted within the first 5 min. Because of a known sex bias in the use of sponge-carrying (Mann and Sargeant 2003), we included only females to limit potential confounds associated with this bias. The number of surveys per individual did not differ significantly between female sponge-carriers (n=14, median=9.0, minimum=5, maximum=30) and female non-sponge-carriers (n=48, median=10.5, minimum=5, maximum=22) (Mann–Whitney U=323.0, Z=−0.22, p=0.826, n=62).
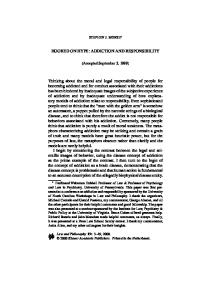
Results There was substantial spatial overlap among frequently sighted foraging tactics (Fig. 1b). However, while some tactics appeared to be spatially widespread (e.g., snacking), others were restricted to transects of particular water depths and/or habitats (e.g., bottom grubbing, sponge-carrying). While tail-out/peduncle dive foraging was observed on all transects in which sponge-carrying was observed, it was also observed on four additional transects with shallower water depths (Fig. 1b). Sponges were only found in three survey zones, although sponge-carrying was documented in these and in two additional survey zones. Three of four foraging tactics were significantly correlated with at least one variable (Table 2). The probability of observing sponge-carrying increased with increasing water depth and sponge coverage (Fig. 2). The probability of observing tail-out/peduncle dive foraging increased with Table 2 Summary of logistic regression for predicting sightings of foraging tactics on transect passes (n=901 for final models, except snacking n=892)
Terms and their odds ratio point estimates (odds ratio) (95% Wald confidence limits in parentheses), coefficient estimates (beta est), standard errors of estimates (SE), Wald statistics (Wald χ2 ) and Wald statistic p values (P(χ2 )) are shown. Only significant explanatory factors are included, except for snacking in which no predictor variables were significant and all main effects are shown.
Terms
water depth (Fig. 3). The probability of observing bottom grubbing increased in cold seasons, increased with seagrass biomass and decreased with water depth (Fig. 4). Snacking was used in a manner indistinguishable from random with respect to measured variables (Table 2). All 11 individuals observed sponge-carrying in 2004 were previously identified as regular sponge-carriers (Mann and Sargeant 2003). Five of these sponge-carriers also engaged in tail-out/peduncle dive foraging in 2004. Sponges were recorded in 3 survey zones and 25 regular sponge-carriers and at least 177 non-sponge-carrying individuals were sighted in those same survey zones over all years. Thus, in survey zones with sponges, only 12% of dolphins sighted actually used sponge-carrying. The percent of surveys in sponge-carrying survey zones was significantly greater for female sponge-carriers (n=14) (median=100%, minimum=80%, maximum=100%) compared to female non-sponge-carriers (n=48) (median=33%, minimum=0%, maximum=100%) (Mann–Whitney U= 50.0, Z=−4.86, p<0.001, n=62). Sponge-carriers also had a significantly higher average transect depth (median= 6.3 m, minimum=5.1 m, maximum=6.6 m) and significantly lower average transect seagrass biomass (median= 16,258 m3, minimum=4,429 m3, maximum=61,988 m3) than non-sponge-carriers (median = 3.9 m, minimum = 0.8 m, maximum=6.7 m, and median=81,751 m3, minimum=12,322 m3, maximum=265,755 m3, respectively) (Mann–Whitney U=69.0, Z=−4.50, p<0.001 and Mann– Whitney U=69.0, Z=−4.50, p<0.001, respectively). Notably, 2–6 non-sponge-carrying females had sponge-carrying
Odds ratio
Sponge-carrying Intercept Survey zone area 1.3 (0.26, 6.12) Sponge coverage 36.6 (11.31, 118.64) Water depth 1.6 (1.32, 1.98) Tail-out/peduncle dive foraging Intercept Survey zone area 0.2 (0.033, 0.91) Water depth 1.8 (1.47, 2.16) Bottom grubbing Intercept Survey zone area 10.9 (1.23, 96.28) Season 0.2 (0.12, 0.50) Seagrass biomass 1.0 (1.00, 1.00) Water depth 0.4 (0.25, 0.69) Snacking Intercept Survey zone area 0.8 (0.05, 15.5) Season 1.0 (0.35, 2.81) Seagrass biomass 1.0 (1.0, 1.0) Tidal height 0.6 (0.15, 2.14) Water depth 0.9 (0.59, 1.42)
Beta est
SE
Wald χ2
P(χ2)
−6.02 0.23 3.60 0.48
2.03 0.81 0.60 0.10
8.76 0.08 36.07 21.75
0.0031 0.7755 <0.0001 <0.0001
−1.09 −1.75 0.58
1.91 0.84 0.098
0.33 4.28 35.05
0.5683 0.385 <0.0001
−7.44 2.39 −1.39 6.44E-6 −0.88
2.29 1.11 0.35 1.84E-6 0.26
10.52 4.59 15.45 12.20 11.50
0.0012 0.0321 <0.0001 0.0005 0.0007
−2.04 −0.18 −0.01 −3.54E-6 −0.57 −0.09
3.32 1.49 0.53 3.45E-6 0.68 0.22
0.38 0.01 0.0006 1.05 0.70 0.16
0.5396 0.9028 0.9802 0.3054 0.4019 0.6917
685
70 60 50
8m
40
7m 6m 5m
30 20
0. 5
0. 4
0. 3
0. 2
0. 1
10 0 0
Percent of transect passes
Behav Ecol Sociobiol (2007) 61:679–688
Sponge coverage (%) Fig. 2 Predicted values of the percent of transect passes with spongecarrying with varying levels of sponge coverage at standard water depths. Survey zone area was held constant at its mean (2.5 km2)
survey zone (2 dolphins), depth (5 dolphins) and seagrass (6 dolphins) measures that fell within the 95% confidence interval for the mean values for sponge-carriers.
Discussion Despite numerous descriptions of the bottlenose dolphin’s foraging flexibility, this study is the first to explore the relationship between multiple tactics and specific habitats and therefore, the first to provide insight into the larger question of how such diversity arises. Although some foraging tactics were used throughout the main study area, others showed tight correspondence with ecological factors. These findings suggest that these tactics are specific to habitats and/or to prey within those habitats and may not be successful in other areas and that patterns of habitat use help explain individual differences observed in this population and others. Bottom grubbing occurred mainly in shallow habitats with high seagrass biomass. Bottom grubbing is unlikely to be visible in deep water, even if it occurs there, raising doubts about the biological importance of the water depth effect. However, disruptions in tracking hidden prey when returning
to the surface for breathing could lower the profitability of bottom grubbing in deep water. In addition, the effects of season and seagrass biomass are likely real. For example, the two shallow transects with lowest seagrass biomass measures also had the fewest bottom grubbing surveys. This is likely linked to patterns of prey distribution in the study area. Seagrass beds have a greater abundance of prey than sand flats (Heithaus 2004, 2005), making them attractive foraging sites. Consequently, we surmise that bottom grubbing enables dolphins to ferret prey out of seagrass and that the presence and height of seagrasses are important determinants of the use of this tactic. Bottom grubbing was more common during the cold season. This is likely due to a large reduction in the use of shallow seagrass habitats during warm seasons caused by increased predation risk from tiger sharks (Galeocerdo cuvier) in these habitats (Heithaus and Dill 2002), but seasonal shifts in fish community composition (Heithaus 2004) may also be responsible. Both sponge-carrying and tail-out/peduncle dive foraging were largely restricted to deep waters. However, sponge-carrying was primarily limited to channels with high sponge abundance whereas tail-out/peduncle dive foraging was a more generalized moderate and deep water foraging tactic. It is interesting to note that sponges are available to many individuals in these channels that were never observed sponge-carrying, but engaged in tail-out/ peduncle dive foraging. Snacking showed no clear association with the habitat measures we analyzed. Because this behavior is used to capture a variety of fish species at the surface of the water, the ecological factors we measured are unlikely to influence its use. Mann and Sargeant (2003) showed that snacking was the first and most common foraging tactic used by calves, suggesting that it may be easily learned. The apparent lack of habitat specificity shown here implies that snacking may be used in any maternal home range, enabling any calf to adopt the tactic. Habitat features may nevertheless influence snacking, as this tactic could be associated with environ-
Percent of transect passes
40 35 30 25 20 15 10 5
40 35 30
1m
25
3m
20 15 10 5 0
0 6. 2
5. 8
5
5. 4
4. 6
4. 2
3. 8
3 3. 4
2. 6
2. 2
1. 8
1. 4
0 1
0. 6
Percent of transect passes
45
Water depth (m)
Fig. 3 Predicted values of the percent of transect passes with tail-out/ peduncle dive foraging with varying water depths. Survey zone area was held constant at its mean (2.5 km2)
0.05
0.1
0.15
0.2
0.25
0.3
Seagrass biomass (km 3 x 1,000)
Fig. 4 Predicted values of the percent of transect passes with bottom grubbing with varying levels of seagrass biomass at standard water depths in the cold season. Survey zone area was held constant at its mean (2.5 km2)
686
mental conditions at finer scales than measured here. For example, the relative use of the upper portions of the water column could be important in the use of snacking. Most foraging behaviors in Shark Bay have been observed elsewhere, suggesting that environmental conditions can largely shape dolphin foraging tactics in the absence of genetic or social transmission. For example, “kerplunking” (Connor et al. 2000) occurs along the west coast of Florida (Nowacek 2002; Gazda et al. 2005), bottom grubbing occurs in Florida and the Bahamas (Rossbach and Herzing 1997; Nowacek 2002) and catching fish using a belly-up swim—as in snacking—has been observed in many locations (e.g., Leatherwood 1975; Bel’kovich 1991; Ballance 1992). This convergence suggests that there are some “universal” tactics that can be employed in coastal habitats (Nowacek 2002) and that most foraging behaviors used need not require unusual innovation or social transmission but rather can be learned by individuals interacting with their local environments. Several studies of primate tool use have examined whether some populations do not use the behavior because they lack appropriate tools, food items or social knowledge. In many cases, the appropriate tools and food items appear to be available to groups that do not use them (Boesch et al. 1994; van Schaik and Knott 2001; van Schaik et al. 2003a,b). Sponge-carrying shows a similar pattern within a single population. Only 12% of individuals sighted where sponges were available are known to use sponge-carrying, suggesting that the exposure to the appropriate habitat alone is not sufficient for sponge-carrying development. It is interesting to note that non-sponge-carrying dolphins used tail-out/ peduncle dive foraging in areas where sponge-carrying was also observed. Sponge-carrying was observed in two survey zones in which sponges were not found. We have observed sponge-carriers transporting sponges during non-foraging activities such as traveling (unpublished data). Because surveys provide only brief snapshots of behavior and dolphins may use a single sponge for hours (unpublished data), we could not determine whether dolphins located sponges within a survey zone or carried them in from other areas. However, given that sponges were uncommon even where found (average of 0.05–0.55% of 1-m2 quadrats), sponges may grow in those survey zones but too sparsely to be detected with our sampling method. The use of foraging tactics, however, may require more than simple exposure to appropriate habitats. Individuals may experience different costs and benefits of foraging tactics as a result of incongruous range sizes and compositions. For example, McGrew et al. (1997) considered optimal foraging theory in terms of the costs of transporting tools and the differences in diet when examining why some populations of chimpanzees do not use nut cracking. Sponge-carriers were sighted in deep channel habitats
Behav Ecol Sociobiol (2007) 61:679–688
where sponge-carrying occurs more than non-spongecarriers, indicating habitat use alone could potentially explain the use of this tactic, at least within demographic groups (e.g., adult females). However, the issue is still more complex because a small handful of non-sponge-carriers had habitat use measures similar to sponge-carriers. The absence of sponge-carrying in these individuals may have derived from a lack of social learning experience, their failure to learn the behavior despite exposure to the appropriate stimuli and/or because they experienced different trade-offs. While sponge-carrying might provide benefits, it seems to require lengthy foraging times, an asocial lifestyle and possibly a lengthy investment in learning (Mann and Sargeant 2003; unpublished data). In sum, these results present a complex interaction of both social and ecological factors to the variation in sponge-carrying and suggest that more detailed assessments of optimal foraging predictions are needed. Given how much individual variation is predicted by the rough habitat measures used here, even more may be accounted for with finer scale assessments of habitat use. For example, sponge-carriers may cluster around sponge assemblages or other microhabitats more than non-sponge-carriers. Social learning is typically implicated when variation in foraging behaviors among groups or individuals is demonstrated and is often further addressed by attempts to separate effects of ecological, genetic and social factors. It has previously been suggested that several foraging tactics used in Shark Bay are traditions with socially learned behaviors transmitted matrilineally from mothers to calves (Mann and Sargeant 2003; Krützen et al. 2005). This study, however, shows that there is a strong ecological basis for several foraging tactics and emphasizes the importance of explicitly addressing ecological contributions rather than attempting to exclude them. Given that individuals use different sets of habitats, it also raises the possibility that ecological variation could largely explain the individual variation in tactical use, even in the case of spongecarrying. In contrast, a previous study by Krützen et al. (2005) concluded that social learning was responsible for sponge-carrying because ecological and genetic mechanisms underlying the variation could be excluded. However, ecological explanations were dismissed solely because sponge-carriers and non-sponge-carriers had overlapping home ranges. Such overlap does not mean equivalent habitat use and finer scale examination of habitat use would be needed particularly because sponge-carrying is associated with deep channel habitats. Correlations between ecological factors and the use of particular foraging tactics do not rule out social learning, particularly when mothers determine the habitat use patterns of calves (i.e., local enhancement, Heyes 1994). Even if habitat use helps explain why many dolphins do not use sponge-
Behav Ecol Sociobiol (2007) 61:679–688
carrying, for example, the matrilineal pattern among those that do (Mann and Sargeant 2003; Krützen et al. 2005) suggests that offspring may at least learn elements of habitat use patterns from mothers, if not the tactic itself. The extent to which ecological variation independently explains this diversity requires further investigation by examining the relative effects of multiple factors. More precisely, a complete analysis of the development of foraging tactics needs to incorporate the relative roles of social, ecological, demographic and genetic factors to examine variation between and within individuals. Further, evaluating the causes of foraging diversity by excluding alternative mechanisms is likely to be ineffective and methods should be developed that incorporate many factors and their interactions. Acknowledgements We thank our colleagues from the Shark Bay Dolphin Research Project for their contributions to the long-term database, the Western Australia Department of Conservation and Land Management for providing logistical support and the Western Australia Department for Planning and Infrastructure for providing tidal data. The Monkey Mia Dolphin Resort and Magellan also contributed generous support during data collection. We thank L. Douglass for valuable statistical advice and R. Barr, L. Dill and anonymous reviewers for helpful suggestions. Special thanks to A. Hough, R. Lam, R. Abernethy, V. Alla, L. Barre, F. Bretos, S. Buchannan, J. Burghardt, M. Davis, H. Finn, C. Genrich, P. Greene, K. Harper, J. Laski, K. Martin, J. McLash, R. McPhie, B. Stalvie, and K. Wirsing for assistance with data collection and to J. Watson-Capps for providing the bathymetry map for the study area. Funding was provided by the Dolphins of Monkey Mia Research Foundation, the Eppley Foundation for Research (JM), Florida International University (MRH), Georgetown University (BLS, JM), the Helen V. Brach Foundation (JM), Honda Motors (BLS, JM), the Lerner-Gray Award (American Museum of Natural History) (MRH), Magellan (BLS, JM), Mercury Marine (AJW, MRH), Monkey Mia Wildsights (AJW), the National Geographic Society Expeditions Council grants (EC0151-03, EC26-98) (AJW, MRH), the National Science Foundation Graduate Research Fellowship (BLS, MRH), the National Science Foundation grant 9753044 (JM), NSERC Canada grant A6869 (L.M. Dill, AJW, MRH), the PADI Foundation (AJW, MRH) and the Shane Award (Society for Marine Mammalogy) (MRH). This research was conducted under permits from the Western Australia Department of Conservation and Land Management and the Georgetown University Animal Care and Use Committee.
References Aisner R, Terkel J (1992) Ontogeny of pine cone opening behaviour in the black rat, Rattus rattus. Anim Behav 44:327–336 Baird RW (2000) The killer whale: foraging specializations and group hunting. In: Mann J, Connor RC, Tyack PL, Whitehead H (eds) Cetacean societies: field studies of dolphins and whales. University of Chicago Press, Chicago, IL, pp 127–153 Baird RW, Dill LM (1995) Occurrence and behaviour of transient killer whales: seasonal and pod-specific variability, foraging behaviour and prey handling. Can J Zool 73:1300–1311 Ballance LT (1992) Habitat use patterns and ranges of the bottlenose dolphin in the Gulf of California, Mexico. Mar Mamm Sci 8:262–274
687 Beck BB (1980) Animal tool behavior: use and manufacture of tools by animals. Garland STPM Press, New York, p 307 Bel’kovich VM (1991) Herd structure, hunting, and play: bottlenose dolphins in the Black Sea. In: Pryor K, Norris KS (eds) Dolphin societies: discoveries and puzzles. University of California Press, Berkeley, CA, pp 17–77 Benoit-Bird KJ, Würsig B, McFadden CJ (2004) Dusky dolphin (Lagenorhynchus obscurus) foraging in two different habitats: active acoustic detection of dolphins and their prey. Mar Mamm Sci 20:215–231 Boesch C, Marchesi P, Marchesi N, Fruth B, Joulian F (1994) Is nut cracking in wild chimpanzees a cultural behaviour? J Hum Evol 26:325–338 Chilvers BL, Corkeron PJ (2001) Trawling and bottlenose dolphins’ social structure. Proc R Soc Lond B 268:1901–1905 Connor RC, Heithaus MR, Berggren P, Miksis JL (2000) “Kerplunking”: surface fluke-splashes during shallow water bottom foraging by bottlenose dolphins. Mar Mamm Sci 16:646–653 Fragaszy DM, Perry S (eds) (2003a) The biology of traditions: models and evidence. Cambridge University Press, Cambridge, UK, p 456 Fragaszy DM, Perry S (2003b) Towards a biology of traditions. In: Fragaszy DM, Perry S (eds) The biology of traditions: models and evidence. Cambridge University Press, Cambridge, UK, pp 1–32 Galef BG Jr (2003) “Traditional” foraging behaviors of brown and black rats (Rattus norvegicus and Rattus rattus). In: Fragaszy DM, Perry S (eds) The biology of traditions: models and evidence. Cambridge University Press, Cambridge, UK, pp 159–186 Galef BG Jr (2004) Approaches to the study of traditional behaviors of free-living animals. Learn Behav 32:53–61 Gazda SK, Connor RC, Edgar RK, Cox F (2005) A division of labour with role specialization in group-hunting bottlenose dolphins (Tursiops truncatus) off Cedar Key, Florida. Proc R Soc Lond B Biol Sci 272:135–140 Guinet C (1991) Intentional stranding apprenticeship and social play in killer whales (Orcinus orca). Can J Zool 69:2712–2716 Hastie GD, Wilson B, Wilson LJ, Parsons KM, Thompson PM (2004) Functional mechanisms underlying cetacean distribution patterns: hotspots for bottlenose dolphins are linked to foraging. Marine Biology 144:397–403 Heithaus MR (2001) The biology of tiger sharks, Galeocerdo cuvier, in Shark Bay, Western Australia: sex ratio, size distribution, diet, and seasonal changes in catch rates. Environ Biol Fishes 61:25– 36 Heithaus MR (2004) Fish communities of subtropical seagrass meadows and associated habitats in Shark Bay, Western Australia. Bull Mar Sci 75:79–99 Heithaus MR (2005) Habitat use and group size of pied cormorants (Phalacrocorax varius) in a seagrass ecosystem: possible effects of food abundance and predation risk. Marine Biology 147:27–35 Heithaus MR, Dill LM (2002) Food availability and tiger shark predation risk influence bottlenose dolphin habitat use. Ecology 83:480–491 Heithaus MR, Dill LM (2006) Does tiger shark predation risk influence foraging habitat use by bottlenose dolphins at multiple spatial scales? Oikos 114:257–264 Heyes CM (1994) Social learning in animals: categories and mechanisms. Biol Rev 69:207–231 Heyes CM, Galef BG Jr (eds) (1996) Social learning in animals: the roots of culture. Academic, San Diego, CA, p 411 Hoelzel AR (1991) Killer whale predation on marine mammals at Punta Norte, Argentina: food sharing, provisioning and foraging strategy. Behav Ecol Sociobiol 29:197–204 Hoelzel AR, Dorsey EM, Stern SJ (1989) The foraging specializations of individual minke whales. Anim Behav 38:786–794
688 Humle T, Matsuzawa T (2002) Ant-dipping among the chimpanzees of Bossou, Guinea, and some comparisons with other sites. Am J Primatol 58:133–148 Hunt GR, Gray RD (2003) Diversification and cumulative evolution in New Caledonian crow tool manufacture. Proc R Soc Lond B Biol Sci 270:867–874 Krützen M, Sherwin WB, Connor RC, Barre LM, Van de Casteele T, Mann J, Brooks R (2003) Contrasting relatedness patterns in bottlenose dolphins (Tursiops sp.) with different alliance strategies. Proc R Soc Lond B Biol Sci 270:497–502 Krützen M, Mann J, Heithaus MR, Connor RC, Bejder L, Sherwin WB (2005) Cultural transmission of tool use in bottlenose dolphins. Proc Natl Acad Sci USA 102:8939–8943 Laland KN, Hoppitt W (2003) Do animals have culture? Evol Anthropol 12:150–159 Laland KN, Williams K (1997) Shoaling generates social learning of foraging information in guppies. Anim Behav 53:1161–1169 Leatherwood S (1975) Some observations of feeding behavior of bottle-nosed dolphins (Tursiops truncatus) in the Northern Gulf of Mexico and (Tursiops cf T. gilli) off Southern California, Baja California, and Nayarit, Mexico. Mar Fish Rev 37:10–16 Mann J, Sargeant B (2003) Like mother, like calf: the ontogeny of foraging traditions in wild Indian Ocean bottlenose dolphins (Tursiops sp.). In: Fragaszy DM, Perry S (eds) The biology of traditions: models and evidence. Cambridge University Press, Cambridge, UK, pp 236–266 Mann J, Smuts B (1999) Behavioral development in wild bottlenose dolphin newborns (Tursiops sp.). Behaviour 136:529–566 McGrew WC, Ham RM, White LJT, Tutin CEG, Fernandez M (1997) Why don’t chimpanzees in Gabon crack nuts? Int J Primatol 18:353–374 Meyers LS, Gamst G, Guarino AJ (2006) Applied multivariate research: design and interpretation. Sage, Thousand Oaks, CA, USA Nowacek DP (2002) Sequential foraging behaviour of bottlenose dolphins, Tursiops truncatus, in Sarasota Bay, FL. Behaviour 139:1125–1145 Palameta B, Lefebvre L (1985) The social transmission of a foodfinding technique in pigeons: what is learned? Anim Behav 33:892–896 Partridge L, Green P (1985) Intraspecific feeding specializations and population dynamics. In: Sibly RM, Smith RH (eds) Behavioural
Behav Ecol Sociobiol (2007) 61:679–688 ecology: ecological consequences of adaptive behaviour. Blackwell Scientific, Oxford, pp 207–226 Reader SM, Kendal JR, Laland KN (2003) Social learning of foraging sites and escape routes in wild Trinidadian guppies. Anim Behav 66:729–739 Rendell L, Whitehead H (2001) Culture in whales and dolphins. Behav Brain Sci 24:309–382 Rossbach KA, Herzing DL (1997) Underwater observations of benthic-feeding bottlenose dolphins (Tursiops truncatus) near Grand Bahama Island, Bahamas. Mar Mamm Sci 13:498–504 Sanz C, Morgan D, Gulick S (2004) New insights into chimpanzees, tools, and termites from the Congo Basin. Am Nat 164:567–581 Smolker RA, Richards AF, Connor RC, Pepper JW (1992) Sex differences in patterns of association among Indian Ocean bottlenose dolphins. Behaviour 123:38–69 Smolker R, Richards A, Connor R, Mann J, Berggren P (1997) Sponge carrying by dolphins (Delphinidae, Tursiops sp.): a foraging specialization involving tool use? Ethology 103:454–465 van Schaik CP, Knott CD (2001) Geographic variation in tool use on Neesia fruits in orang-utans. Am J Phys Anthropol 114:331–342 van Schaik CP, Ancrenaz M, Borgen G, Galdikas B, Knott CD, Singleton I, Suzuki A, Utami SS, Merrill M (2003a) Orangutan cultures and the evolution of material culture. Science 299:27–28 van Schaik CP, Fox EA, Fechtman LT (2003b) Individual variation in the rate of use of tree-hole tools among wild orang-utans: implications for hominin evolution. J Hum Evol 44:11–23 Watson-Capps JJ (2005) Female mating behavior in the context of sexual coercion and female ranging behavior of bottlenose dolphins (Tursiops sp.) in Shark Bay, Western Australia. Ph.D. Dissertation, Department of Biology, Georgetown University, Washington, DC, USA Whitehead H, Rendell L (2004) Movements, habitat use and feeding success of cultural clans of South Pacific sperm whales. J Anim Ecol 73:190–196 Whiten A, Goodall J, McGrew WC, Nishida T, Reynolds V, Sugiyama Y, Tutin CEG, Wrangham RW, Boesch CB (1999) Cultures in chimpanzees. Nature 399:682–685 Würsig B, Würsig M (1977) The photographic determination of group size, composition, and stability of coastal porpoises (Tursiops truncatus). Science 198:755–756