Towards Better Measurement of Attention and Satisfaction in Mobile Search Dmitry Lagun
Chih-Hung Hsieh
Dale Webster
Emory University
Google Inc.
Google Inc.
Vidhya Navalpakkam Google Inc.
[email protected]
[email protected]
[email protected]
[email protected]
ABSTRACT Web Search has seen two big changes recently: rapid growth in mobile search traffic, and an increasing trend towards providing answer-like results for relatively simple information needs (e.g., [weather today]). Such results display the answer or relevant information on the search page itself without requiring a user to click. While clicks on organic search results have been used extensively to infer result relevance and search satisfaction, clicks on answerlike results are often rare (or meaningless), making it challenging to evaluate answer quality. Together, these call for better measurement and understanding of search satisfaction on mobile devices. In this paper, we studied whether tracking the browser viewport (visible portion of a web page) on mobile phones could enable accurate measurement of user attention at scale, and provide good measurement of search satisfaction in the absence of clicks. Focusing on answer-like results in web search, we designed a lab study to systematically vary answer presence and relevance (to the user’s information need), obtained satisfaction ratings from users, and simultaneously recorded eye gaze and viewport data as users performed search tasks. Using this ground truth, we identified increased scrolling past answer and increased time below answer as clear, measurable signals of user dissatisfaction with answers. While the viewport may contain three to four results at any given time, we found strong correlations between gaze duration and viewport duration on a per result basis, and that the average user attention is focused on the top half of the phone screen, suggesting that we may be able to scalably and reliably identify which specific result the user is looking at, from viewport data alone.
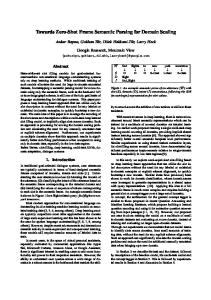
Figure 1: An example of the search results page showing Knowledge Graph result. The yellow area indicates current position of the browser’s viewport (visible portion of the page).
Keywords
search engines’ traffic (about one in every five searches) is generated by mobile devices[25]. Another recent change in search is the increasing trend towards providing answer-like results for simple information needs that are popular on mobile (e.g., [weather today], [pizza hut hours]). Such results display the answer or relevant information on the search page itself without requiring the user to click. Instant information is desirable on mobile devices, but poses a challenge – while clicks on organic search results have been extensively used to infer result relevance and search satisfaction [5, 6], answer-like results often do not receive clicks, which makes it difficult to evaluate answer quality and search satisfaction. Together, the rapid growth in mobile traffic and answer-like results in Search warrants better understanding of user attention and satisfaction in search on mobile devices. Search behavior on mobile devices can be different than on desktop for several reasons. Unlike traditional desktop computers with large displays and mouse-keyboard interactions, touch enabled mobile devices have small displays and offer a variety of touch interactions, including touching, swiping and zooming. As a result, user
Search on mobile phone, user attention and satisfaction, viewport logging.
1.
INTRODUCTION
Recent years have witnessed a rapid explosion in the usage of mobile devices on the web. According to recent surveys, web browsing on mobile devices increased five fold from 5.2% three years ago to 25% in April 2014[26]; and a significant amount of
Permission to make digital or hard copies of part or all of this work for personal or classroom use is granted without fee provided that copies are not made or distributed for profit or commercial advantage, and that copies bear this notice and the full citation on the first page. Copyrights for third-party components of this work must be honored. For all other uses, contact the owner/author(s). Copyright is held by the author/owner(s). SIGIR’14, July 6–11, 2014, Gold Coast, Queensland, Australia. ACM 978-1-4503-2257-7/14/07. http://dx.doi.org/10.1145/2600428.2609631.
1
experience and search behavior on mobile devices is different – for example, due to the lack of a physical keyboard, users tend to issue shorter queries than on the desktops [19]. Compared to large desktop displays (13-30" displays or bigger), the displays on mobile phones are small (4-5" or smaller), and limit the amount of information that the user can view simultaneously. We introduce viewport as the portion of the web page that is visible on the phone screen at a given point in time. Viewport coordinates are recorded in the web page coordinate system, (i.e., upon scrolling, viewport moves towards the bottom of the web page). Since the small displays on mobile phones limit the number of visible search results to 3-4, viewport tracking could be used to better measure users’ attention on a web page, as was recently recognized by some researchers [21, 13]. To the best of our knowledge, there is no quantitative evaluation or validation of viewport data in how well it can approximate user attention on mobile devices, or be used to detect search satisfaction. In this paper we test the utility of viewport signals. To approximate attention from viewport tracking, we measure the result view time - the duration for which a search result appeared within the viewport. In desktop settings, the amount of time user spent gazing (or hovering with mouse cursor) on a particular result was shown to be useful for inferring result relevance [24], predicting feature clicks [15], improving ranking, estimating snippet attractiveness[21] and whole page quality [22]. While cursor hovers do not exist on mobile devices, these findings suggest that measurement of viewing time of results on mobile could lead to several useful applications in relevance estimation and whole page optimization. In this paper we demonstrate how viewport metrics can be used to measure user attention (eye gaze), and detect search satisfaction. Specifically, our paper makes the following contributions:
[23] used eye tracking to study gaze trajectories on a search results page in more detail. They found that only 25% of users examine search results in the order they are presented by the search engine. A similar study was conducted by Guan and Cutrell [10], who showed the effect of target result position on searcher’s examination behavior. Apart from organic search results, previous work explored user attention and search behavior and their relation to ads and rich informational panels in the desktop settings. Buscher et al.[4] investigated the effect of ad quality on searcher’s receptiveness to the advertisements. They found that when ad quality varied randomly, users paid very little attention to the ads. Navalpakkam et al.[24] conducted a controlled study where they varied the presence and relevance of a rich informational panel placed to the right of organic search results. They found that the information panels containing information relevant to the user’s task attract more attention and longer mouse cursor hovers. Our work is similar to Navalpakkam et al. in that we both study user behavior in the presence of informational panels among the search results (results based on Knowledge Graph1 ). However, there are important differences: 1) we study attention and satisfaction on mobile search, while the previous study was conducted in desktop settings; 2) unlike desktop where the information panel appears on the right hand side of the page (and hence may be ignored), on mobile phones, the information panel is interleaved between organic search results. In addition to informational panels, we also study Instant Answer results, such as related to current weather information, price of currency exchange, etc. User factor and individual differences strongly affect the way searchers examine the results and interact with the search engine. Aula et al.[1] reported two types of search result examination patterns – economic and exhaustive. Economic users inspect results sequentially from the top to bottom and click on the first relevant link they notice. In contrast, exhaustive searchers thoroughly examine the search result page and consider every result before deciding what to click. Dumais et al. [8] extended this work by clustering users based on their examination behavior of whole search page. In addition to user examination pattern on organic search results they considered user attention on advertisements. Despite the abundance of research about searcher’s attention on desktops, attention on mobile devices remained relatively unexplored. Huang and Diriye [13] discussed the potential utility of viewport logging on touch-enabled mobile devices. In this paper, we use client based viewport logging (similar to [13]) to track user interactions on the search result page. Recent study of Guo et al. [12] investigated the value of user interaction data on mobile phones for predicting search success. Continuing this line of research Guo et al. [11] demonstrated the utility of tracking touchbased interactions to improve relevance estimation of destination web pages (a web page linked by a search result). Among many user activity metrics, they found the inactivity time on a web page to be highly correlated with page relevance. While their work focused on user interactions and behavior on the destination pages, this paper considers viewport behavior and in addition, eye tracking, on the search results page. Kim et al. [20] investigated result examination strategies on different screen sizes. Similarly to [23] they adopted taxonomy of three examination strategies: Depth-First, Mixed, Breadth-First. Surprisingly, they did not find any significant variation in the way users examine search results on large and small displays. It is worth noting that they used a simulation of the mobile phone screen, and it is possible that behavior on simulated phone screens (shown on
• presents first quantitative eye tracking and viewport tracking study in search on mobile phones • identifies increased scrolling past answer, and increased time below answer as clear, measurable signals of searcher dissatisfaction • demonstrates strong correlations between gaze duration on a result and its view duration (r=0.7) on a per-result basis (3-4 results could appear simultaneously on the viewport) • reports that average user attention is focused on the top half of the phone screen; together with the previous finding, this suggests that we may reliably identify the specific result seen by the user from viewport data alone. We begin by surveying related work in eye tracking for search on desktops and user behavior for search on mobile devices. We then describe our experiment and user study, followed by the analysis of searcher’s attention and satisfaction on mobile phones. We conclude with a discussion reviewing the findings and limitations of this study, along with suggestions for future work.
2.
RELATED WORK
Eye tracking technology has been extensively used in studies of web search result examination behavior in desktop settings. Granka et al. [9] studied how users browse search results and select links. They showed that users spend most of the time inspecting the first and the second result before their first click. Based on insights gained from eye tracking, Joachims et al. [17] compiled the most common examination strategies and demonstrated their utility in inferring user-perceived relevance of result ranking. Lorigo et al.
1
2
http://www.google.com/insidesearch/features/search/knowledge.html
a desktop monitor) and an actual mobile device can vary substantially for reasons mentioned in the introduction (e.g., actual phones can be held in the hand, and allow several touch interactions including zooming in and scrolling that simulated phones may not offer). To the best of our knowledge, the study of Biedert et al.[2] remains the only quantitative eye tracking study of reading behavior performed on an actual mobile device. While our study uses a similar technical setup, we focus on analyzing search behavior on a mobile phone (search attention and satisfaction). In addition, we demonstrate the utility of viewport based metrics and their high correlation with user attention.
3.
USER STUDY AND DATA COLLECTION
In order to evaluate our ideas, we designed and conducted a user study with answer-like search results. We split the user study into two parts: first, to study how a rich information panel with Knowledge Graph results (KG) affects user search and attention behavior, and second, to study how Instant Answers (IA) influence search and attention behavior. Knowledge Graph results are often shown for queries related to some entity, e.g. famous person, place, etc. Examples of such queries are [angelina jolie] or [louvre] (shown in Figure1). Examples of queries that trigger Instant Answers include [weather today], [twitter stock price], [define amazing], [giants schedule]). Our choice of dividing the study into two parts is motivated by the fact that KG and IA have quite different user interfaces which may potentially affect results of the study. Indeed, both result types (KG and IA) provide users with answer-like information (i.e., the information is visible on the search page, no need to click through), but they have different user interfaces. Instant Answer result type has a diverse UI, sometimes interactive, such as in weather and “calculator” related queries; sometimes containing charts and graphs, such as in weather and finance, and sometimes containing text only, such as in dictionary lookup queries. On the other hand, KG results have a consistent user interface and appearance – an image block on top, followed by textual facts, and some links. Both parts of the study used the following protocol. Participants were presented with a web page containing a list of 20 search tasks. Each entry in the list consisted of the task description, followed by 2 hyperlinks – one pointing to the search results page (with a predefined query related to the task), and the second pointing to the post-task questionnaire. Participants were instructed to read the task description, (attempt to) find the answer to the task, and complete the post-task questionnaire. To ensure that the tasks had similar levels of difficulty, two authors of the paper verified that for each task, the corresponding search results page (SERP) contained the answer in one of the search result snippets, and the task could be solved by simply inspecting the results. Thus, the tasks were fairly easy (required less than a minute) and participants were instructed to spend not more than three minutes per task. Upon finding the answer, participants were asked to navigate back to the study home page by using the “Back” button on the phone, and follow the second hyperlink to complete the post-task questionnaire. On the post-task questionnaire page, participants were asked to rate their satisfaction with the search results as a whole (single rating) on a 7 point likert scale – 1 being completely dissatisfied and 7 being completely satisfied. Note that the queries were predefined per task, and query reformulation was not allowed. For the first part of the study, we used a 2 x 2 within subject design with two factors: Relevance of the Knowledge Graph result to the user’s information need, and Presence of the Knowledge Graph result on the search page. Both factors have two levels: Relevance -
Figure 2: Top panel shows Tobii mobile stand including scene camera, the eye tracker and a mobile phone placed at the device holder. We used this setup to perform eye tracking in our user study. Bottom panel illustrates post-processing step of mapping gaze from scene camera coordinates to phone screen coordinates.
relevant or irrelevant, Presence - present or absent. Each participant performed 20 search tasks (5 tasks per condition). The task presentation order was randomized to eliminate any learning or task order effects. In order to familiarize participants with the mobile device and the study flow, each participant completed 4 practice tasks prior to starting the study. After completing 20 tasks in the first study, participants were given a 5 minute break before proceeding to the second part of the study, which was similar, except that it focused on Instant Answer results instead of Knowledge Graph results. In second the part, IA was always present and we only varied the single factor: IA Relevance. This enabled us to double the number of tasks per condition (from 5 in KG to 10 in IA).
3.1
Participants
We recruited 30 participants with informed consent (12 male and 18 female) aged 18-65, with various occupations and self-reported mobile search experience. Data from 6 participants was excluded due to calibration problems with the eye tracker (missing fixations, poor calibration accuracy). Most of the participants had normal or corrected vision (e.g. contact lenses) and were able to read from the mobile phone without wearing glasses.
3.2
Apparatus
We used the Tobii X60 eye tracker to record participant’s eye gaze movements on the mobile phone. The eye tracker allowed us to record eye gaze with a frequency of 60 Hz and accuracy of 0.5◦ of visual angle [27]. We used a Nexus 4 mobile phone running Android operating system as the mobile device. The Chrome 3
Query university of cambridge golden gate bridge the avengers movie sfo to atl price aapl earnings world cup 2014
Task Description KG Relevant KG Not Relevant What was the enrollment of the University of Cam- Find the rank of University of Cambridge in acabridge in 2012? demic rankings. What is the length of the Golden Gate Bridge? Find information regarding tolling and transit through the Golden Gate Bridge. Who was director of the Avengers movie? Find a link to watch the Avengers movie trailer. IA Relevant IA Not Relevant Find the ticket price of the Delta flight from San Find a website to compare different prices for flights Francisco (SFO) to Atlanta (ATL). from San Francisco (SFO) to Atlanta (ATL). What is the current stock price of Apple Inc.? Find Apple Inc. earnings in second quarter of 2013. When does the FIFA 2014 world cup start? Find a website to buy tickets for the FIFA 2014 world cup. Table 1: Example task descriptions used in the user study.
browser was used to display the task description page and search result pages. The phone was attached to Tobii’s mobile stand as shown in the top panel of Figure 2. As part of the Tobii mobile stand setup, the scene camera was configured to capture the video of the mobile device during the study (sample screenshot shown in bottom panel of Figure 2). The experiment began by calibrating eye gaze of each participant using a five point calibration (four points were shown in the corners of the phone screen and one point was shown in the center). Unfortunately, Tobii X60 does not record eye gaze in the phone’s coordinate system, which is required for determining the exact result seen by the user, hence gaze data was processed using the procedure described in Section 3.4.
3.3
actual eye gaze coordinates on the phone in pixels one needs to scale vphone with phone’s screen size (378 x 567 px). To associate eye gaze data with a particular page view recorded in the viewport logs, we synchronized the eye tracker’s clock with the clock used by the viewport logging on the phone. This allowed us to map each gaze position to the corresponding search result on the SERP by using the bounding boxes of all results on page recorded in the viewport logs. The resulting mapping was accurate enough to distinguish gaze position between two adjacent lines of text, allowing even more fine grained analysis at sub-result level. The raw eye gaze data was parsed to obtain a sequence of fixations (brief pauses in eye position for around 100-500ms) and saccades (sudden jumps in eye position) using standard algorithms [7]. Eye fixations and their duration are thought to represent meaningful information processing and can approximate attention [7]. Thus, our subsequent analysis was performed using eye fixations.
Viewport Logging
To record the exact information that was displayed on the phone screen at any given time, we instrumented custom viewport logging. This allowed us to record the portion of the web page currently visible on the screen, as well as bounding boxes of all search results shown on the page. Viewport logging was instrumented with JavaScript and inserted into every SERP shown to the users. Our script recorded bounding boxes of the search results, shortly after the page was rendered in the browser, and logged viewport change events such as scrolling and zooming. All the viewport events were buffered and subsequently sent with an HTTP request to a user study server where they were stored for subsequent analysis. Such instrumentation allowed us to reconstruct what the user saw on the screen at any point of time.
3.4
4.
RESULTS
We begin by analyzing the relationship between user behavior metrics, derived from gaze, viewport and user actions, and the experimental conditions of our user study. Then, we present our findings about user attention during search on mobile, including the effect of result rank position and strong preference for the top half of the screen. We conclude with presenting correlation analysis of result viewing time measured with eye tracking and result display time measured using viewport.
4.1
Gaze Data Post-Processing
Effect of Answer Presence on Satisfaction
As search engines strive to provide answer-like results to users to satisfy their information need instantly (without the need to click), it becomes challenging to evaluate the effect of disturbing the original ranked list (of clickable results) with a novel type of result (that is often not clickable). In this section, we attempt to quantify how user behavior and satisfaction are affected by injecting Knowledge Graph (KG) (described in section 3) to the search results page. We formulated the following hypothesis:
As mentioned earlier, Tobii X60 captures gaze position in the scene camera coordinate system instead of the phone coordinate system2 , which poses a challenge as quantitative analysis of attention on results requires gaze data to be in the phone coordinate system. To this end, we designed a custom software to annotate bounding boxes around the phone screen in Tobii’s scene video of each participant, and to accurately map gaze from the scene to phone coordinate system. The bottom panel in Figure 2 illustrates the difference between scene and phone coordinate systems. To perform the mapping, we chose two vectors along the phone’s vertical and horizontal axes: vhoriz = v3 − v0 and vvert = v1 − v0 , where vi corresponds to a vertex of the phone screen bounding box, as shown in Figure 2. The eye gaze position in the phone coordinate system is given by vphone = (v − v0 )A−1 where A = [vvert , vhoriz ] is the coordinate change matrix. Finally, to get the
• H1: on average, users will be more satisfied when KG is present than when it is absent. To test this hypothesis, we performed a 2-way repeated measures ANOVA (within subjects design) and examined the effect of KG presence on user’s satisfaction ratings. Consistent with H1, the mean satisfaction ratings increased from 5.28 ± 0.09 when KG is absent to 5.69±0.09 when KG is present (F(1,23)=13.35,p=0.001), revealing a significant effect of KG presence on user satisfaction.
2 A Tobii technical support specialist confirmed that Tobii x60 cannot record gaze coordinates in the phone coordinate system.
4
Metric
Gaze
Viewport
Page
TimeOnKG (s) % TimeOnKG TimeBelowKG (s) % TimeBelowKG TimeOnKG (s) % TimeOnKG TimeBelowKG (s) % TimeBelowKG NumberOfScrolls TimeOnPage (s) TimeOnTask (s) SatisfactionScore
KG Present Relevant Not Relevant 0.64 ± 0.20 0.62 ± 0.09 34 ± 5 39 ± 4 1.19 ± 0.32 0.73 ± 0.12 24 ± 4 28 ± 3 3.96 ± 0.42 5.38 ± 0.34 25 ± 2 20 ± 1 11.28 ± 2.18 12.83 ± 1.26 16 ± 2 26 ± 2 1.77 ± 0.28 3.32 ± 0.25 5.37 ± 0.65 7.98 ± 0.47 48.30 ± 30.06 163.82 ± 33.12 6.03 ± 0.13 5.39 ± 0.13
KG Absent Relevant Not Relevant
3.2 ± 0.33 9.80 ± 0.85 115.89 ± 39.31 5.0 ± 6.15
2.52 ± 0.29 7.42 ± 0.65 64.13 ± 29.81 5.51 ± 0.11
p-value 3 p=0.067 p=0.179 p=0.380 p=0.279 p<0.001 p=0.029 p=0.001 p<0.001 p=0.003 p<0.001 p<0.001 p=0.002
Table 2: Gaze, Viewport and Page metrics summarized for each experiment condition (M ± SE).
(a)
(b)
(c)
(d)
Figure 3: Average values of NumberOfScrolls, TimeOnTask, TimeOnPage and SatisfactionScore for four experimental conditions with error bars indicating standard errors. Statistical significance of group pairwise comparisons is annotated using the following coding: NS - not significant, * - p-value<0.05, ** - p-value<0.01, *** - p-value<0.001
Gaze metrics: TimeOnKG and TimeBelowKG report total fixation time spent (in seconds) viewing Knowledge Graph results; %TimeOnKG and %TimeBelowKG report corresponding quantities divided by time spent on all search result elements. Viewport metrics: TimeOnKG and TimeBelowKG report the total duration (in seconds) for which the Knowledge Graph result was inside the user’s viewport (visible to the user); %TimeOnKG and %TimeBelowKG viewport metrics report the corresponding quantities divided by the sum of viewport time of all result elements. Page metrics: NumberOfScrolls reports number of times the user scrolled down; TimeOnPage reports total time the user spent on the search result page; TimeOnTask reports the time user spent on completing the task (task end is determined by submission of the task satisfaction rating); SatisfactionScore reports the user’s satisfaction rating regarding search engine’s performance in the task. For each of the metrics we performed a two-way with-subject design ANOVA for two factors related to Knowledge Graph result – KG presence and KG relevance. We start by analyzing the effect of answer relevance on these metrics. Since answer relevance makes sense only when KG is present, we focus on that condition (blue lines in Figures 3a-d). Consistent with H2, we found that the users are more satisfied when KG is relevant than irrelevant (6.03 ± 0.13 for relevant vs. 5.39 ± 0.13 for irrelevant, F(1,23)=14.47, p<0.001), suggesting that relevant Knowledge Graph results significantly enhance user satisfaction. Consistent with H3, when KG was relevant, users quickly found the answer and completed the task faster, while when KG was irrelevant, they spent more time on the page looking for the answer. Thus, time on task increased significantly from 48.30±30.06
This shows that users are more satisfied when the answer-like result is present. As expected, when KG is absent, we did not find any statistically significant differences in satisfaction between questions used for KG relevant and KG irrelevant tasks, since they had similar difficulty levels(F(1,23)=3.578, p=0.07)).
4.2
Effect of Answer Relevance
Prior research in the desktop domain identified the relevance and position of results as two major factors influencing user behavior in search. In this section we investigate the effect of answer relevance on user behavior, and Section 4.3 describes the effect of result position on the attention distribution on mobile phones. We focus on KG- and IA- present conditions in order to identify useful behavior metrics that can signal the relevance of answer-like results. To this end we formulated four hypotheses: • H2: when KG is present, users will be more satisfied when it is relevant than when it is not. • H3: users will take longer time to complete the task when KG is irrelevant than when it is relevant. • H4: users will reject irrelevant KG results sooner, i.e., spend less time on irrelevant KG results. • H5: users will scroll down further and spend more time inspecting results below, when KG is irrelevant. Table 2 summarizes gaze, viewport and page metrics computed for the data collected in the KG part of the study. These metrics are defined below. 5
Metric Gaze TimeOnIA (s) % TimeOnIA TimeBelowIA (s) % TimeBelowIA Viewport TimeOnIA (s) % TimeOnIA TimeBelowIA (s) % TimeBelowIA NumberOfScrolls NumberOfEvents TimeOnPage (s) TimeOnTask (s) SatisfactionScore
IA Relevant
IA Not Relevant
p-value
0.55 ± 0.09 45 ± 5 1.21 ± 0.23 55 ± 5
0.74 ± 0.11 38 ± 3 1.41 ± 0.17 62 ± 3
p=0.812 p=0.237 p=0.298 p=0.343
1.96 ± 0.24 11 ± 1 11.74 ± 1.59 32 ± 3 1.33 ± 0.17 6.12 ± 0.39 3.89 ± 0.43 90.7 ± 1.65 6.25 ± 0.09
3.64 ± 0.26 16 ± 1 19.02 ± 1.30 56 ± 2 2.96 ± 0.20 9.93 ± 0.38 7.17 ± 0.41 102.82 ± 1.73 5.08 ± 0.11
p<0.001 p<0.001 p<0.001 p<0.001 p<0.001 p<0.001 p<0.001 p<0.001 p<0.001
Table 3: Summary of Gaze, Viewport and Page (M ± SE) for “IA Relevant” and “IA Not Relevant” experiment conditions. Time related metrics are measured in seconds.
(a) KG Relevant
gaze time on KG results when they are irrelevant compared to the relevant KG results. Viewport time increased from 3.96 ± 0.42 on relevant KG results to 5.38 ± 0.34 seconds on irrelevant KG results (p<0.001); similar increase in % time on KG as reported in Table 2. The latter fact seems counter-intuitive, as we would expect irrelevant answers to get rejected sooner, and relevant answers to receive more attention. A plausible explanation is: since both relevant and irrelevant KG results display information on entities related to the query, users do not know that it is irrelevant to their task until they have read it fully (e.g., for the task [find watchable cartoons of the Simpsons], the user would see a KG result on the Simpsons entity, showing images of the Simspons cartoon and names of characters). Thus, expecting to find the answer in KG, users may read through the entire KG result, and upon not finding the answer, they continue to examine the remaining results below. We suspect for this reason, irrelevant KG results in our study get more viewport and gaze time. It is worth noting that increased attention on a result does not necessarily mean it is more relevant (it may also indicate user difficulty). This ambiguity was also found by Just and Carpenter [18]. We believe a stronger test of relevance is the user’s next action – did the user scroll past the answer and spend more time examining results below? If so, it suggests that users were probably not satisfied with the answer. Consistent with H5, we found that irrelevant KG results were indeed associated with increased scrolling down the page (3.32±0.25 vs. 1.77 ± 0.28; p<0.05) and more time below KG in seconds (12.83 ± 1.26 vs. 11.28 ± 2.18 seconds, p=0.01) and as a % of page time (% time below KG for irrelevant KG results is 26 ± 2 vs. 16±2 for relevant KG results, p<0.001). Similar patterns were observed with eye gaze. Figure 4 illustrates this by showing heatmaps of gaze activity comparing the KG relevant vs. KG irrelevant across all users in the study. The red hotspots that received high attention are positioned near the Knowledge Graph results. Note the increased gaze activity below irrelevant KG results on Figure 4b as compared to relevant KG results on Figure 4a, suggesting that upon looking at irrelevant KG results, since users did not find the answer, they continued to inspect results below KG (unlike in the relevant condition where upon looking at relevant KG results, users found the answer and completed the task).
(b) KG Not Relevant
Figure 4: Attention heatmaps for KG Relevant and KG Not Relevant conditions. This figure shows that on average, across all users in the study, there is increased gaze activity below KG when it is irrelevant than relevant.
to 163.33 ± 33.12 seconds (p<0.05), and time on page also increased significantly from 5.37 ± 0.65 to 7.98 ± 0.47 seconds (p<0.05). Consistent with H5, relevant KG results were associated with less scrolling down the page (1.77 ± 0.28 vs. 3.32 ± 0.25; p<0.05). Thus, in all cases we observe positive effect of KG results on user experience. As expected and as shown in the red lines in Figures 3a-d, when KG is absent, there were no statistically significant differences between the KG relevant and irrelevant conditions. To aid more in-depth analysis of metrics in our study (2x2 design), we performed post-hoc tests on pairwise comparisons between the conditions using a 1-way ANOVA with Bonferroni correction and annotated corresponding plots of Figure 3 with significance markers. Comparisons that are significantly different are denoted by a “*” in Figure 3, and the rest are denoted by “NS” for not significant. We focus on Figure 3d here. As seen in Section 4.1 and consistent with H1, users are significantly more satisfied when KG is present than absent (F(1,23)=13.35, p=0.001). Interestingly, for KG-irrelevant tasks, KG presence had no effect (F(1,23)=0.349, p=0.56). This suggests that Knowledge Graph results do not harm user satisfaction, even when they are not directly answering user’s information need. We found a significant interaction effect between KG presence and relevance (F(1,23)=12.41, p=0.001), as seen by the intersecting lines on Figure 3d. Figures 3a-3c are similar to Figure 3d, and show the number of scrolls, time on task and time on page as a function of KG presence and relevance. Unlike H4, we found that users spend more viewport time and
3
6
For Page measures the p-values are computed using the repeated
Table 3 summarizes gaze, viewport and page metrics for the second part of the study on Instant Answers (IA), which was designed with a single factor IA Relevance making data analysis significantly simpler. Most of the findings we discovered by comparing relevant vs. irrelevant conditions in the KG part of study apply to IA results as well. For example, consistent with H2, H3, H5 for KP, when IA was relevant (vs. not), we found that users were significantly more satisfied, completed the task sooner (less time on task and page), scrolled less and spent less time below the answer. Although gaze metrics lacked statistical significance, likely due to the large variance in the data, they exhibited similar behavior as the viewport metrics providing additional evidence for the validity of viewport data for evaluation answer like results. Finally, we verify that viewport metrics can be related to searcher’s satisfaction. We restrict our analysis to the KG Present where Knowledge Graph results were shown to the user (eliminating Absent condition where answer like viewport metrics are undefined). The linear regression analysis reveals statistically significant effect of gaze metrics on the user satisfaction scores (gaze TimeBelowKG F(2,138) = 7.55, p-value < 0.001 and viewport TimeBelowKG F(2,138) = 42.18, p-value < 0.001). The results are almost identical for Instant Answer data. This finding allows us to establish the relationship between viewport metrics and the user satisfaction with answer-like results. To summarize, we established that the time spent below an answer result, measured using viewport data, can signal result relevance and user satisfaction with the search. We confirm that amount of scrolling is negatively correlated with user satisfaction, which is consistent with previous findings in the desktop and mobile settings. Finally, we found that relevance of Knowledge Graph results and Instant Answers have similar effect on user behavior, as measured using gaze and viewport data.
4.3
Figure 5: This figure shows how viewport time (left panels) and gaze time (right panels) vary with result position. Top-left panel shows viewport time in ms, and the bottom-left panel shows viewport time as a fraction of time on all results on that page. The right panels show similar plots for eye gaze.
unlikely, we may observe that viewport time decreases with position. This remains to be tested in a future study. An obvious question is whether the bump at position 2 or 3 is an artifact of viewport data, or is a real attention phenomenon that occurs with eye gaze too. The right panels in figure 5 show gaze time on each result in milliseconds (top-right panel) and in % (bottomright panel) as a function of result position (x axis). Similar to viewport, we find a main effect of result position or rank on time on result (F(9, 1720) = 15.1, p<0.001) and a bump at position 2 (% time on result is significantly higher for second result than the first: t(343)=-2.3, p=0.02). We believe this may be a function of scrolling too – due to the small screen size in phones, the second result may only be partially visible; in order to bring it fully into view, the user has to adjust the scroll distance by continuing to look at the second result until it its bottom portion comes into view. This finding of non-monotonic attention decay with rank position may have implications for results ranking and design of a novel discount function (as opposed to MAP or NDCG[16]) that better reflects user experience in mobile search. We plan to investigate this question in the future work.
Effect of Result Position
It is well known in search on desktops that the first result receives much higher portion of user attention and clickthrough rate (CTR) than the second result, and in general, attention and CTR decrease from top to bottom on the SERP. We tested whether a similar phenomenon exists on mobile phones. We considered data from the KG absent condition, so that the SERP consists of 10 organic clickable web results, which is the most commonly studied scenario prior work on search on desktops. The left panels in figure 5 show viewport time on result in milliseconds (top-left panel) and in % (bottom-left panel) as a function of result position (x axis). A 1-way ANOVA shows a main effect of result position or rank on time on result (F(9, 2660) = 64.57, p<0.001) suggesting that position bias affects user attention on mobile phones too. While for most positions the viewport time on result (in ms, %) decreases with result position, we find a surprising bump at positions 2 and 3 (significantly higher % time on the second result than the first: t(528)=-2.2, p=0.02; and higher % time on the third result than the first: t(504)=-3.7, p<0.001). Authors verified that this is not a bug and is indeed feature of the mobile data. One possible explanation for the bump at position 2 and 3 is the presence of short scrolls on mobile phones. Figure 6 illustrates this with an example – unlike desktop where the page up down keys allow users to move from one page fold to another non-overlapping page fold, in mobile phones, users often tend to perform short scrolls that may render the second or third result visible across more viewports and for longer time than the first result. It is possible that for navigational tasks where users mostly click the first result (e.g., twitter), since scrolling is
4.4
Attention Distribution on the Screen
Figure 7 shows the attention distribution across all users and conditions in our study. The left panel shows a heatmap of gaze activity (note that the red hotspots of increased attention are clearly shifted to the top half of the screen). The right panel shows a histogram of eye fixations as a function of y position. The median fixated y position was 224 pixels which is above the screen center (290 pixels). Thus, we found that on average, almost 70 % of the users’ attention was focused on the top half of the phone screen, with little or no attention paid to the bottom 1/3 portion of the screen (only 14%). This trend was consistent on a per user basis (20/24 users showed the preference for top half of the screen). We hypothesize that weighting viewport measurements by this attention distribution may further improve gaze viewport correlations.
5.
GAZE AND VIEWPORT CORRELATION
We have already shown in the previous section that viewport metrics can signal relevance of answer like results and reflect user’s
measures ANOVA; for Viewport and Gaze measures Wilcoxon rank sum test is used. 7
Figure 6: This figure shows that in the presence of short scrolls, the second/third result may be visible across several viewports and for longer compared to the first result.
Figure 8: This figure shows fairly strong gaze viewport correlations. In each panel, the x axis is a gaze measure, and the y axis is the corresponding viewport measure. Left panels show time measures in milliseconds, while right panels show time measures as a % of time on all results on that page.
number of viewports). Table 4 reports the gaze-viewport correlations for combinations of the above factors. P We denote the baseline approach computing viewport time = n v=1 tv as C1. We find that the best combination among C1-C4 is C4 (C2 is close), which is weighted by result exposure and viewport coverage. The scatter plots in Figure 8 are generated using C4. Figure 8 (top-left panel) shows the scatter plot of viewport time on result vs. gaze time on result, both measured in milliseconds. Each data point in the scatter plot is a (user, query, condition, result) tuple. The correlations are reasonably strong (Pearson’s correlation r=0.57; the blue line shows the metric values obtained by binning the data into deciles, binned r = 0.77). Figure 8 (top-right panel) is similar, but shows a scatter plot of percent time on result (time on result / time on page) as measured by gaze (x axis) and viewport (y axis). Interestingly, we found higher correlations using % time on result than absolute time on result in milliseconds (raw correlation: r = 0.69 vs. 0.57; binned correlation: r = 0.97 vs. 0.77). We suspect that the normalization (by time on all results on the page) helps adjust for the pace at which users read/consume the page. For example, some users may quickly glance and skim through the results, while others may read carefully. In such cases, the absolute time measure will vary a lot while the percent time measure may be relatively stable. Since 3-4 results may be shown on the viewport simultaneously, the observed gaze-viewport correlation on a per-result basis (raw correlation of 0.69, binned correlation in deciles of 0.97) is high and suggests that we may reliably infer how long a specific result was seen by the eye, from the viewport data alone. The middle and bottom panels in Figure 8 are similar to the top panel, and show gaze viewport correlations for other measures, such as time spent below KG (mid-left panel) and percent time
Figure 7: Heatmap of where users spent more time looking on the phone is shown on the left (hotspots of attention in red, cool spots indicate lack of attention). Note that the attention distribution appears shifted to the top half of the phone screen. Histogram of fixations along the vertical or y axis is shown on the right panel.
satisfaction with the search. In this section we investigate whether viewport data can serve for an additional benefit – tracking user attention. To this end, we attempt to correlate result viewing time measured with the eye tracking and viewport data. If a reasonably strong correlation between gaze and viewport time exists, it implies that we can measure user attention at scale from viewport data alone. We analyze viewing time on per-result basis. We gather all the data collected in the user study independent of experimental condition, relevance, result position and result type (traditional web results vs. answer-like results). We hypothesize that viewport time alone might provide a poor proxy for the user’s attention, thus, in order to refine our measurements we account for two factors: result coverage and exposure defined below. Let v denote the viewport. We explore different ways of computing viewport time on result as a combination of the time the result was visible on the viewport (tv ) and two factors: how much of the result area was visible to a user (result exposure, ev ) and how much of the viewport real estate did the result occupy (viewport coverage, cv ). viewport time on result using all factors is computed as PTotal n (t ∗ cv ∗ ev ), where v can take values from [1, n] (n is the v v=1 8
Formula C1 C2 C3 C4
weight by coverage no yes no yes
weight by exposure no no yes yes
time on element (ms) 0.55 0.57 0.53 0.57
%time result 0.6 0.69 0.63 0.69
on
time below KG (ms) 0.71 0.71 0.56 0.71
% time below KG 0.84 0.86 0.82 0.86
time below IA (ms) 0.58 0.59 0.57 0.59
% time below IA 0.79 0.79 0.79 0.81
Table 4: Correlations between gaze and viewport times with viewport time computed in one of four possible ways.
spent below KG (i.e., time below KG / time on all results on the page, mid-right panel) measured using gaze (x axis) and viewport (y axis). Here too, we find strong gaze viewport correlations, and again, the % time measures show higher correlations than time in millisecond measures (time below KG: r = 0.71, %time below KG: r = 0.86). The bottom panel in Figure 8 shows correlations for time below IA (r = 0.59) and % time below IA (r = 0.81). In all three figures, we find that the percent time measures, that are normalized by time on page, show higher gaze-viewport correlations than time in millisecond measures, for reasons discussed earlier.
6.
tention is focused on the top-left and decreases towards the bottom and right of the search result page, in our study on mobile phones, we found that on average, user attention is focused on the center and top half of the screen. This, together with the already strong gaze viewport correlations (r=0.7 for %time on a page element as shown in Fig 8) suggests that by using the appropriate weighting functions on viewport data, we may identify which result the user is looking at, with high confidence. In other words, this offers an opportunity, for the first time, to scalably and reliably measure user attention on mobile phones. Another possible direction for improving accuracy of user attention measurements is to follow the work Huang et al. [14] and Navalpakkam et al. [24] that advocate to directly predict user attention on the screen from user interactions. While the absence of cursor movements in mobile phones makes attention prediction more difficult, we hypothesize that features of smaller screen size and the time user spends in the viewport without scrolling can be used to improve the accuracy of the “vanilla” approach that uses viewport time information only. In addition to understanding searcher attention on mobile phones, we examined search satisfaction and its effect on viewport data. We systematically varied task-relevance (whether the KG/IA contained the answer to the user’s task), and found that users reported less satisfied when the KG/IA was task-irrelevant than when it was relevant. We also identified viewport metrics that signal user dissatisfaction with answers – increased scrolling down the SERP and increased % time below the answer. We found that when the KG/IA is task-irrelevant, users read through it (expecting to find the answer) and upon not finding the answer, they continued to examine results below, leading to increased scrolling down the page, and increased time below KG/IA (in milliseconds, and as a % of page time). These results suggest that we may auto-detect answer satisfaction at scale by using viewport signals.
DISCUSSION
To our knowledge, this is the first quantitative mobile eye tracking study in search. As more traffic goes mobile, there is a need to better understand user attention and satisfaction on mobile devices. Prior work has focused on search behavior in desktops. These studies report a Golden Triangle [23], where searcher attention is focused near the top-left of the page and decreases as we go down or to the right on the SERP. It is not clear whether attention behavior on desktop will generalize to mobile phones, as they differ from desktops in several ways – small real estate, variety of touch interactions (touch, scroll, swipe, zoom) and tendency to perform short queries. In this study, we found that indeed, user attention behavior on mobile phones is very different from that on desktops. First, unlike desktop where engagement (both clicks and attention) has been widely reported to decrease from top to bottom positions [9, 10], on mobile phones, we found surprisingly, that the second result gets more viewport and gaze time than the first. The most likely explanation for this is short scrolls. Unlike desktop where searchers can use the page up/down keys on the keyboard to move from one page fold to the next (no overlap between the results in different page folds), on mobile phones, users tend to perform short and continuous scrolls that render the second and third results visible across more viewports and hence longer than the first. Figure 6 illustrates this with an example. This bias towards the second position occurs in eye gaze too. We think this is because the second result is often partially hidden, and to bring it fully into view, the user has to carefully scroll (to avoid scrolling too much or too little) by continuously looking at the result until it is fully visible, leading to longer gaze time on the second result than the first. It is possible that in the absence of scrolling, viewport and gaze time on results (in mobile phones) may decrease with position, similar to desktop. For example, navigational tasks ("BBC") where the user often clicks the first result, may not require scrolling, and may show higher viewport time on the first than second result. In our study, however, all tasks were non-navigational, and often involved scrolling. An intriguing question that immediately follows is, whether there is a more appropriate evaluation metric or rank position discount that better reflects user experience on mobile phones than current evaluation metrics, such as mean average precision or discounted cumulative gain. The second finding which is different on mobile phones than desktop is that, unlike the Golden Triangle in desktop, where at-
6.1
Limitations and Future Work
We acknowledge several limitations of this study. First, we focused on tasks with information seeking search intent and have not explored navigational search intent [3]. In our data we observed 2.51 viewport scrolls performed on average. We expect the amount scrolling activity to be smaller for navigational searches, as often the first result is the destination site (e.g. queries like “BBC” or "Twitter"). In the absence of scrolling, we may find that attention strictly decreases with result position (unlike the bump at position 2 observed in this study). Second, in this study, we fixed the mobile phone’s position by mounting it to the eye tracker’s stand. In real life, user’s attention on the phone can vary depending on whether s/he is moving or not; whether the user is right handed or left handed or, perhaps interacting with the phone with both hands. Other factors such as demographics can also influence user behavior. For example, depending on the user’s language s/he may read information on the phone from left to right or vice-versa. Age and experience with touch interfaces is widely recognized throughout research community as an important factor in touch interactions, thus can affect user 9
attention/search behavior. Third, examination habits on the mobile device may vary across users, as noted by [2]. While Figure 7 already shows a clear pattern - most users prefer focusing on the top half of the phone screen, it is possible that a few users may prefer the center or bottom of the screen. In our future work we plan to address this limitation by exploring the possibility of adaptively weighting user attention based on current user actions, e.g. direction of page examination (upward or downward). Despite these limitations, our study offers the hope of accurately measuring user eye-fixated result at scale on mobile phones. Future work will consider tablets (this study focused on mobile phones) and other devices, satisfaction with clickable results (including ads), and explore diverse user settings such as users who are moving or multi-tasking.
7.
[10] Z. Guan and E. Cutrell. An eye tracking study of the effect of target rank on web search. In Proc. of SIGCHI, pages 417–420. ACM, 2007. [11] Q. Guo, H. Jin, D. Lagun, S. Yuan, and E. Agichtein. Mining touch interaction data on mobile devices to predict web search result relevance. In Proc. of SIGIR, pages 153–162. ACM, 2013. [12] Q. Guo, S. Yuan, and E. Agichtein. Detecting success in mobile search from interaction. In Proc. of SIGIR, pages 1229–1230. ACM, 2011. [13] J. Huang and A. Diriye. Web user interaction mining from touch-enabled mobile devices. Proc. of HCIR, 2012. [14] J. Huang, R. White, and G. Buscher. User see, user point: gaze and cursor alignment in web search. In Proc. of SIGCHI, pages 1341–1350. ACM, 2012. [15] J. Huang, R. W. White, G. Buscher, and K. Wang. Improving searcher models using mouse cursor activity. In Proc. of SIGIR, pages 195–204. ACM, 2012. [16] K. Järvelin and J. Kekäläinen. Cumulated gain-based evaluation of IR techniques. ACM Transactions on Information Systems (TOIS), 20(4):422–446, 2002. [17] T. Joachims, L. Granka, B. Pan, H. Hembrooke, and G. Gay. Accurately interpreting clickthrough data as implicit feedback. In Proc. of SIGIR, pages 154–161. ACM, 2005. [18] M. A. Just and P. A. Carpenter. A theory of reading: From eye fixations to comprehension. Psychological Review, 87:329–354, 1980. [19] M. Kamvar and S. Baluja. A large scale study of wireless search behavior: Google mobile search. In Proc. of SIGCHI, pages 701–709. ACM, 2006. [20] J. Kim, P. Thomas, R. Sankaranarayana, and T. Gedeon. Comparing scanning behaviour in web search on small and large screens. In Proc. of the Australasian Document Computing Symposium, pages 25–30. ACM, 2012. [21] D. Lagun and E. Agichtein. Viewser: enabling large-scale remote user studies of web search examination and interaction. In Proc. of SIGIR, pages 365–374. ACM, 2011. [22] D. Lagun and E. Agichtein. Re-examining search result snippet examination time for relevance estimation. In Proc. of SIGIR, pages 1141–1142. ACM, 2012. [23] L. Lorigo, M. Haridasan, H. Brynjarsdóttir, L. Xia, T. Joachims, G. Gay, L. Granka, F. Pellacini, and B. Pan. Eye tracking and online search: Lessons learned and challenges ahead. Journal of the American Society for Information Science and Technology, 59(7):1041–1052, 2008. [24] V. Navalpakkam, L. Jentzsch, R. Sayres, S. Ravi, A. Ahmed, and A. Smola. Measurement and modeling of eye-mouse behavior in the presence of nonlinear page layouts. In Proc. of WWW, pages 953–964. International World Wide Web Conferences Steering Committee, 2013. [25] RKG Digital Marketing Report, Q2 2013. Retrieved from http://www.rimmkaufman.com/blog/ rkg-digital-marketing-report-q2-2013-released/10072013/, 2013. [26] Statcounter Global Stats. Retrieved from http://gs.statcounter.com/#mobile_vs_ desktop-ww-monthly-201208-201308, 2014. [27] Tobii X Series Eye Trackers Product Description. Retrieved from http://www.tobii.com/Global/Analysis/Downloads/ Product_Descriptions/Tobii_TX_Product_description.pdf.
CONCLUSION
We demonstrated, for the first time, that by tracking the browser viewport (visible portion of the page), one can develop viewport metrics that are strongly correlated with user attention (eye gaze) and search satisfaction on mobile phones. Focusing on answerlike results, in a controlled lab study, we identified that increased scrolling past answer and increased time below answer are signals of user dissatisfaction with answer results. We demonstrated strong gaze-viewport correlations on a per-result basis, and found that attention (on average) is focused on the top half of the phone, suggesting that we may infer the amount of attention received by a specific result (of 3-4 results shown in the viewport) scalably and reliably using viewport data alone. Potential applications of this work include better estimation of result relevance and satisfaction in search, and could benefit other areas including advertising, web page design and optimization, and measuring engagement in social networking sites.
8.
REFERENCES
[1] A. Aula, P. Majaranta, and K.-J. Räihä. Eye-tracking reveals the personal styles for search result evaluation. In Proc. of Human-Computer Interaction-INTERACT, pages 1058–1061. Springer, 2005. [2] R. Biedert, A. Dengel, G. Buscher, and A. Vartan. Reading and estimating gaze on smart phones. In Proc. of the Symposium on Eye Tracking Research and Applications, pages 385–388. ACM, 2012. [3] A. Broder. A taxonomy of web search. In ACM SIGIR Forum, pages 3–10. ACM, 2002. [4] G. Buscher, S. T. Dumais, and E. Cutrell. The good, the bad, and the random: an eye-tracking study of ad quality in web search. In Proc. of SIGIR, pages 42–49. ACM, 2010. [5] B. Carterette and R. Jones. Evaluating search engines by modeling the relationship between relevance and clicks. In Proc. of NIPS, pages 217–224, 2007. [6] O. Chapelle and Y. Zhang. A dynamic bayesian network click model for web search ranking. In Proc. of WWW, pages 1–10. ACM, 2009. [7] A. T. Duchowski. Eye tracking methodology: Theory and practice, volume 373. Springer, 2007. [8] S. T. Dumais, G. Buscher, and E. Cutrell. Individual differences in gaze patterns for web search. In Proc. of IIiX, pages 185–194. ACM, 2010. [9] L. A. Granka, T. Joachims, and G. Gay. Eye-tracking analysis of user behavior in WWW search. In Proc. of SIGIR, pages 478–479. ACM, 2004. 10